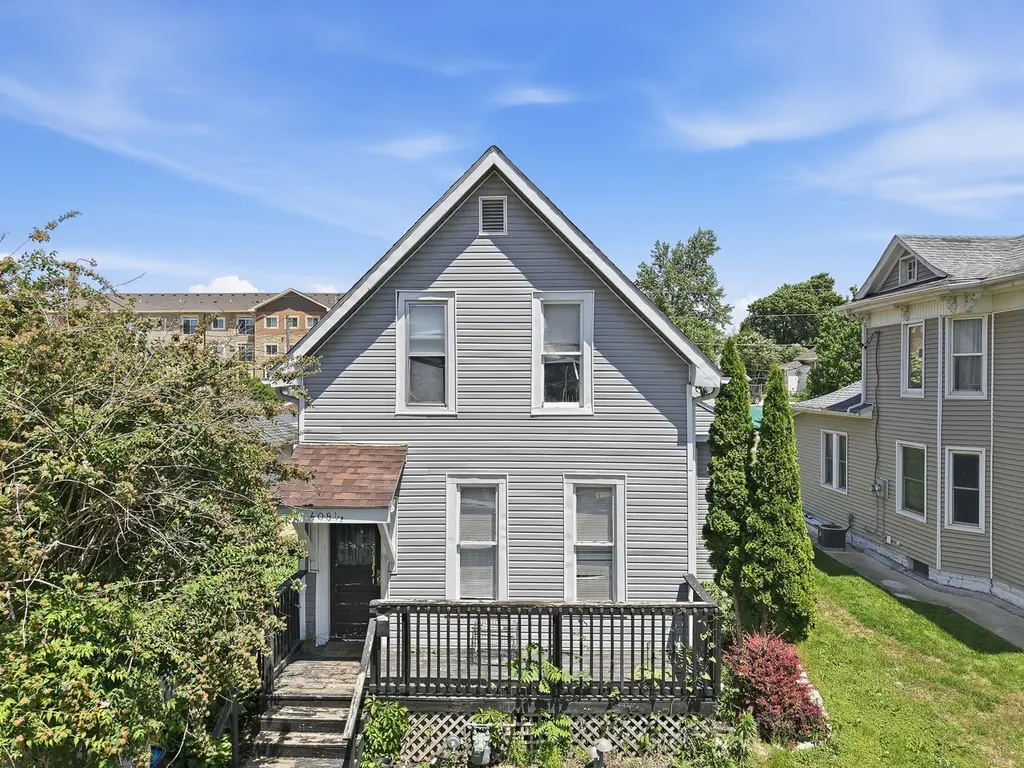
408 1/2 E Linn St · Marshalltown, IA
Flood risk 1/10 · Minimal
- FEMA flood zone
- X (unshaded)
- Chance of flooding over 30 yrs
- 0.0%
- Est. flood insurance / yr
- $473 – $860
Fire risk 4/10 · Minor
- Est. fire insurance / yr
- $902 – $1,676
Heat risk 3/10 · Minor
- Hot days now (above 102°F)
- 7 days/yr
- Hot days in 30 yrs
- 15 days/yr
Wind risk 2/10 · Minimal
- Chance of severe wind over 30 yrs
- —
Air-quality risk 1/10 · Minimal
- Unhealthy air days now
- 0 days/yr
- Unhealthy air days in 30 yrs
- 0 days/yr
Risk factors via First Street. Map © Google.
Why this score? — see what drove the F grade
The composite is a weighted blend of 9 inputs, each scored 0–100. Each bar is that input's sub-score; the figure is the points it added to the 100-point composite (weight × sub-score).
- Cash flow +13.8/30.0
- Schools +4.3/10.0
- DSCR +4.2/10.0
- Livability +3.9/5.0
- 1% rule +3.4/10.0
- Rent growth +2.5/5.0
- Condition / age +2.5/5.0
- ARV discount +0.0/15.0
- Appreciation +0.0/10.0
$117,900
🖨 Deal sheet 📄 Offer letter ✓ Due diligence
Listing remarks MLS
Remodeled 3 bedroom home with lots of improvements. Vinyl siding, metal facia, soffit and gutters. New shingles. Open floor plan. Eat in kitchen with new stove and refrigerator. New flooring throughout. New furnace and water heater. Remodeled bathroom. Detached garage. Close to downtown. Call today!
Key facts
- Newer flooring
- Remodeled bathroom
- Eat-in kitchen
Tags
Property features AI
Exterior
- Parking: Detached 1-car garage
- Utilities: Public water; Public sewer
- Home design: 2-story house; Zoned R
- Construction: Asphalt shingle roof
- Exterior features: Rectangular lot; Concrete road access
Interior
- Kitchen: Dishwasher; Microwave; Refrigerator; Stove
- Flooring: Carpet
- Bathrooms: 1 full bathroom
- Heating & cooling: Central air conditioning; Forced-air heating (natural gas)
- Interior features: Partial basement
- Laundry & utility: Main-level laundry
Neighborhood map
What this means for you Summary
Snapshot
- This is a 3-bed/1.0-bath single-family listed at $118k.
Deal economics
- At list price, monthly cash flow is $11 ($132/yr) — positive.
- The deal already cash-flows at list — no discount required.
- To meet the 1% rule (rent ≥ 1% of price), the offer needs to be $99k (15.8% below list).
- Recommended offer: $99k (15.8% below list) — sets the bar for 1% rule.
- Cap rate 6.4% vs local median 4.5% in Marshalltown — top-decile yield for the area; either an underpriced asset or a hidden risk that comps aren't pricing in. Stress-test before assuming the spread holds.
Location & tenants
- Location reads 78/100 on livability (#133 in IA, #2,464 nationally) — a middle-class / working-renter tenant base. Strengths: commute A+, cost of living A+, housing A+; Watch: employment C-, amenities F.
- Marshalltown Community School District (town): math 50% / reading 52% proficiency, ranked #278 of 289 in IA (top 96%) — acceptable for families but not a draw, mixed tenant base, ~2y average lease; 60% free/reduced lunch — lower-income household profile, screen leases tightly.
- Market conditions: 161 active listings in the ZIP; 5 comparable units currently listed for rent nearby; rentals lingering (median 44d on market — plan ~5-8 weeks vacancy on turnover, expect pricing pressure); 100% of comp listings sitting > 30 days — soft ceiling on asking rent; 35 units permitted in Marshall County in 2024 (0 in 5+ unit buildings).
- This rent is only 17% of the median local income ($70k/yr) — well below the 30% rent-burden line; pricing power to push rent on renewal without tenant pushback.
Forward outlook
- Local home prices are declining (-3.0%/yr); year-one equity from $815 of loan paydown is wiped out by about $4k of value loss. Plan a longer hold.
- Marshall County population projected at +8% by 2050 — modest demand growth; plan on rents tracking national, not racing it.
Negotiation context
- It's been on market 15 days — a 2% lower offer ($116k) is reasonable based on typical stale-listing flexibility.
- 2 sale attempts since 3y ago with the ask held roughly flat each time — persistent listings suggest the price (not the market) is what's stuck; bring a comps-based counter.
- Current owner paid $50k; list at $118k implies a 136% gain — meaningful room to come down on a strong offer.
Risks & watch-outs
- Watch-outs: built in 1915 — expect roof / HVAC / electrical / plumbing capex.
Questions for the listing agent
- Built in 1915 — when were the roof, HVAC, electrical panel, plumbing, and water heater last replaced?
- Is there a deadline driving the sale (1031 exchange, divorce, estate, relocation)? That informs how much negotiation room exists.
- The area grade is low — what's the realistic commute time and amenity access for the typical tenant pool here? Any planned neighborhood developments (good or bad) we should know about?
- What's the average days-on-market for RENTAL listings here right now (not sales)? A rising rental-DOM trend means longer vacancies and softer asking-rent achievability than the comps imply.
- What's the recent tenant-quality profile in this submarket — average credit score on applications, eviction rate, late-payment / NSF rate, and stable-employment percentage? A property-management company in the area should have these aggregated.
- How much new for-sale + rental construction is in the pipeline within 1–3 miles? Heavy new supply typically softens prices + rents 12–24 months out; constrained supply supports both.
Investment metrics
- 1% rule
- 0.84% ✗
- Cap rate
- 6.41%
- Cash-on-cash
- 0.40%
- DSCR
- 1.02
- GRM
- 9.9
CMA / ARV
- ARV (on-the-fly)
- $99,992
- Comps found
- 12
Show comp detail 12 sales within ~0.75 mi
| Address | Dist | Beds/Ba | Sqft | Sold | Price | $/sf | Match |
|---|---|---|---|---|---|---|---|
| 701 S 7th Ave | 0.50mi | 3/1.0 | 864 (+0%) | 5mo | $141,000 | $163 | 72 |
| 105 S 7th Ave | 0.19mi | 2/1.0 (-1) | 816 (-5%) | 8mo | $95,000 | $116 | 70 |
| 108 N 5th Ave | 0.29mi | 2/1.0 (-1) | 912 (+6%) | 13mo | $135,000 | $148 | 61 |
| 8 S 7th Ave | 0.23mi | 2/1.0 (-1) | 952 (+10%) | 9mo | $47,000 | $49 | 60 |
| 702 Woodbury St | 0.47mi | 2/1.0 (-1) | 800 (-7%) | 8mo | $95,000 | $119 | 54 |
| 206 N 5th Ave | 0.36mi | 2/1.0 (-1) | 754 (-12%) | 8mo | $117,500 | $156 | 51 |
| 208 N 7th Ave | 0.42mi | 2/1.5 (-1) | 749 (-13%) | 7mo | $30,530 | $41 | 46 |
| 808 S 9th Ave | 0.68mi | 2/1.0 (-1) | 768 (-11%) | 1mo | $67,000 | $87 | 45 |
| 208 W Nevada St | 0.63mi | 4/1.5 (+1) | 792 (-8%) | 6mo | $148,000 | $187 | 45 |
| 8 E Lincoln St | 0.63mi | 2/1.0 (-1) | 948 (+10%) | 9mo | $92,000 | $97 | 41 |
| 432 Union St | 0.55mi | 2/1.0 (-1) | 748 (-13%) | 9mo | $32,000 | $43 | 40 |
| 110 Marion St | 0.73mi | 2/1.0 (-1) | 964 (+12%) | 2mo | $60,000 | $62 | 40 |
Match score weights: distance 35% · size 25% · config 20% · recency 20%. Top-matched comps best support the ARV.
Projected returns pro-forma
-3.0% appreciation · 3.0% rent growth · sell at horizon
- IRR
- -15.7%
- Equity multiple
- 0.44×
- Total profit
- $-18,413
- Equity at exit
- $17,579
- IRR
- -7.2%
- Equity multiple
- 0.54×
- Total profit
- $-15,172
- Equity at exit
- $10,194
Cash invested: $33,012 (down + closing). Projections, not guarantees.
Landlord ↔ Tenant lean methodology
- Overall (STATE)
- 83 Strongly Landlord-Friendly
- State Iowa
- 83 Strongly Landlord-Friendly · R+6
- County
- — inherits STATE
- City
- — inherits STATE
ZIP-level market 50158
- Active inventory
- 161
- Price-to-rent
- 9.9×
Monthly cashflow live
- Estimated rent
- $993 high interval (Pro) →
- Mortgage (P&I)
- −$618
- Tax from tax record
- −$106 /mo · $1,272/yr
- Insurance
- −$49
- HOA
- −$0
- Vacancy / Maint / Mgmt
- −$209
- Net cashflow
- $11
Break-even live
UW: 25.0% down · 7.5% · 30yr · 1.5% tax · 5.0% vac · 8.0% maint · 8.0% mgmt
Financing live
Cash to close
- Down payment
- $29,475
- Closing costs
- $3,537
- Reserves months
- —
- Total cash needed
- —
Loan-product check · same deal, 3 products live
Conventional
25% down · 7.5% · 30yr
- Down + closing
- —
- Monthly P&I
- —
- Monthly cashflow
- —
- DSCR
- —
- Eligible?
- —
Personal DTI + credit; lowest rate.
DSCR
20% down · 8.5% · 30yr
- Down + closing
- —
- Monthly P&I
- —
- Monthly cashflow
- —
- DSCR
- —
- Eligible?
- —
No personal income docs; deal must DSCR.
Hard money
10% down · 12.0% · 12mo
- Down + closing
- —
- Monthly P&I
- —
- Monthly cashflow
- —
- DSCR
- —
- Eligible?
- —
Short-term bridge; refi at stabilization.
Rent comps 5 comps
| Address | Beds | Baths | Sqft | Rent | $/sqft | DOM | Units | Dist |
|---|---|---|---|---|---|---|---|---|
| 511 S 7th Ave Marshalltown, IA | 2.0 | 1.0 | 784 | $738 | $0.94 | 43d | 2 | 0.44mi |
| 605 S 7th Ave Unit 605-01 Marshalltown, IA | 2.0 | 1.0 | 784 | $700 | $0.89 | 43d | 1 | 0.46mi |
| 505 N 13th Ave Marshalltown, IA | 2.0 | 1.0 | 676 | $1,095 | $1.62 | 43d | 1 | 0.88mi |
| 511 W State St Unit 5 Marshalltown, IA | 2.0 | 1.0 | 911 | $895 | $0.98 | 43d | 1 | 0.89mi |
| 1010 Washington St Marshalltown, IA | 3.0 | 1.0–2.0 | 1098 | $1,262 | $1.15 | 43d | 3 | 1.35mi |
Listing history 12 events
-
2026-06-19days on market $117,900 Active 15 DOM
-
2026-06-18days on market $117,900 Active 14 DOM
-
2026-06-17days on market $117,900 Active 13 DOM
-
2026-06-16days on market $117,900 Active 12 DOM
-
2026-06-15days on market $117,900 Active 11 DOM
-
2026-06-14days on market $117,900 Active 9 DOM
-
2026-06-12days on market $117,900 Active 8 DOM
-
2026-06-09days on market $117,900 Active 5 DOM
-
2026-06-08days on market $117,900 Active 4 DOM
-
2026-06-07days on market $117,900 Active 3 DOM
-
2026-06-05remarks 699-char remark
-
2026-06-05$117,900 Active 1 DOM
ⓘ Source: listings_history table (triggers on properties + properties_extension) + one-shot
backfill from property_details.listing_events for pre-trigger history.
Tax reassessment forecast IA · Partial reset (capped growth)
- Current annual tax
- $1,272 · $106/mo
- Projected year-2 tax
- $1,562 · $130/mo
- Expected delta
- +$290/yr (+$24/mo · 22.8%)
ⓘ Screening estimate from a state-policy table — verify with the county assessor before closing.
Climate risk First Street
- Flood 1/10 Low FEMA zone X (unshaded) · 0% chance over 30 yrs
- Wildfire 4/10 Moderate
- Heat 3/10 Moderate 7 d/yr ≥102°F today · 15 d/yr by 30 yrs out
- Wind 2/10 Low
- Air quality 1/10 Low 0 unhealthy d/yr today · 0 by 30 yrs out
Nearby sold comps map
Loading sold comps map…
Walkable amenities ~0.75 mi
Loading nearby amenities…
Taxation est. · year 1
- Rental income
- $11,915
- − Mortgage interest
- −$6,604
- − Property taxes
- −$1,272
- − Insurance
- −$590
- − Repairs & maintenance
- −$953
- − Management
- −$953
- − Depreciation
- −$3,430
- Taxable loss
- −$1,887
- Est. tax savings @ 24.0%
- +$453
- After-tax cash flow
- $585/yr
For passive investors: Depreciation is non-cash, so a rental often shows a tax loss while cash-flowing — sheltering income. Rental losses are passive: they offset passive income freely, and up to $25,000/yr can offset ordinary (W-2) income if you actively participate and your MAGI is under $100k (phasing out to $0 by $150k); unused losses carry forward. On sale, claimed depreciation is recaptured at up to 25%, and gains may owe capital-gains tax (a 1031 exchange can defer both). Figures are a year-1 estimate at your 24.0% rate — not tax advice; consult a CPA.
Schools (NCES district)
- District
- Marshalltown Community School District
- NCES district ID
- 1918720
- Math proficiency
- 50% ▼ -8.00%
- Reading proficiency
- 52% ▬ 0.00%
- Median HH income
- $47,877
- Composite
- 43.41/100
- National rank
- #3015
- State rank
- #278 of 289 in IA
Livability — Marshalltown
- Score
- 78/100
- State rank
- #133
- US rank
- #2464
Category grades
Schools grade is shown separately in the Schools card above.
Census & demographics
- Census place
- Marshalltown, IA
- County
- Marshall County · 31,396 people
- City population
- 31,396
- Metro
- Marshalltown, IA
- Population (ZIP)
- 31,396
- Household income
- $70,367
- Rent vs Own
- Severe rent burden
- 369.0
Population outlook (Marshall County) Hauer SSP2
- Today (2025)
- 41,166 people
- By 2030
- 41,477 · +0.8%
- By 2040
- 42,548 · +3.4%
- By 2050
- 44,472 · +8.0%
- By 2075
- 52,719 · +28.1%
- By 2100
- 60,912 · +48.0%
Race, ethnicity, and origin ACS 2023
- Neighborhood character
- Majority White (60%)
- Race & ethnicity
- White 60% Hispanic / Latino 30% Two or more races 14% Asian 5% Black 2% Native American 1%
- Hispanic origin (detail)
- Mexican 25%
- Common ancestry
- Portuguese 3% Italian 2% Iranian 1%
- Foreign-born
- 17% · Canada, Philippines, China
- Languages at home
- 71% English-only · Spanish 24% Other Asian/Pacific 4% French/Haitian/Cajun 1%
Political lean MEDSL · Marshall
- 2024 margin
- R (+15.6) · D 41.4% · R 57.0% · Other 1.6%
- 2008→2024 swing
- -24.9pp toward R · 2008: 9.3pp · 2024: -15.6pp
- All cycles
- 2024: R+15.6 2020: R+7.7 2016: R+8.5 2012: D+8.9 2008: D+9.3
Not yet ingested
- Civics
- —
Market trends
- HPI YoY
- ▼ -161.80%
- Current HPI
- 177.4692
- Rent YoY
- —
- Metro
- Marshalltown, IA
- State GDP YoY
- ▲ 2.48%
- F500 in state
- 4
Industry mix (Fortune 500 HQ in IA)
| Industry | F500 HQs | Revenue |
|---|---|---|
| Financial Services | 1 | $16B |
|
||
| Retail / Convenience | 1 | $15B |
|
||
Price history
+573.7% since first listed13 events — show timeline
- 2026-06-04 Listed $117,900 DMMLS
- 2026-05-07 Sold (Public Records) $50,000 Public Records
- 2023-06-29 Sold (Public Records) $82,000 Public Records
- 2023-06-26 Sold (MLS) $87,000 IAR
- 2023-06-02 Pending — IAR
- 2023-04-16 Price Changed $84,500 IAR
- 2023-04-12 Price Changed $88,500 IAR
- 2023-04-06 Price Changed $92,500 IAR
- 2023-04-03 Price Changed $99,500 IAR
- 2023-03-30 Price Changed $104,900 IAR
- 2023-03-24 Price Changed $109,900 IAR
- 2023-03-21 Listed $114,900 IAR
- 1999-10-14 Sold (Public Records) $17,500 Public Records
Property tax history
+3.5%/yrLatest (2025): $1,272 · +6.0% YoY. Source: county tax records.
Cash-flow waterfall
monthlySold comps — $/sqft
last 12 mo · ≤1 miLoading sold comps…