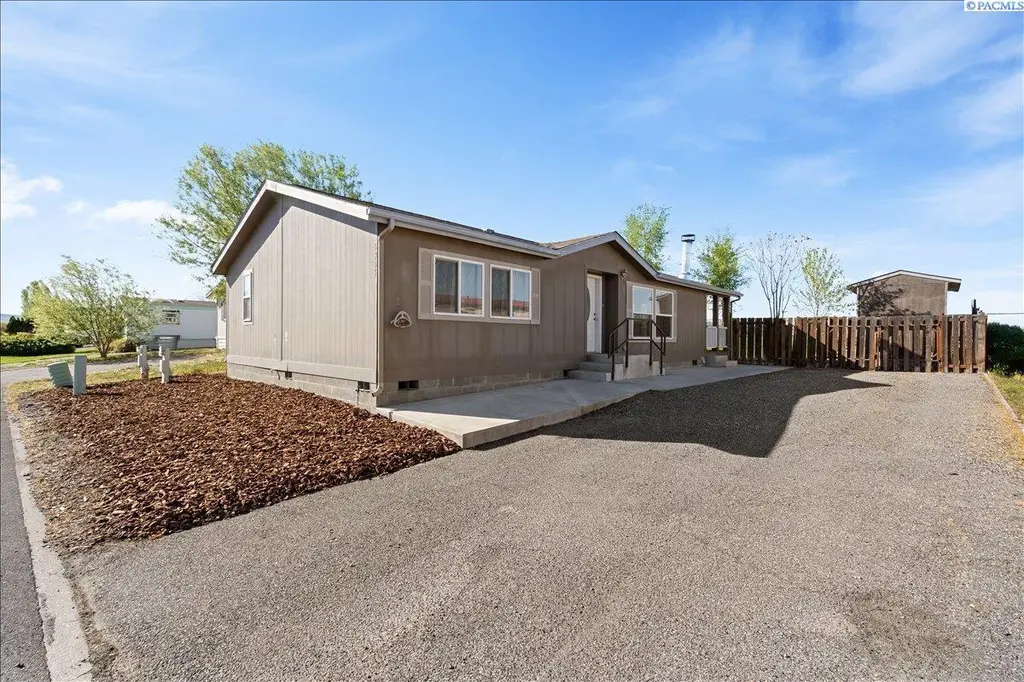
6306 James St · West Richland, WA
Flood risk 1/10 · Minimal
- FEMA flood zone
- X
- Chance of flooding over 30 yrs
- 0.0%
- Est. flood insurance / yr
- $507 – $1,088
Fire risk 6/10 · Moderate
- Est. fire insurance / yr
- $604 – $1,122
Heat risk 5/10 · Moderate
- Hot days now (above 98°F)
- 7 days/yr
- Hot days in 30 yrs
- 15 days/yr
Wind risk 1/10 · Minimal
- Chance of severe wind over 30 yrs
- —
Air-quality risk 8/10 · Major
- Unhealthy air days now
- 14 days/yr
- Unhealthy air days in 30 yrs
- 14 days/yr
Risk factors via First Street. Map © Google.
Why this score? — see what drove the B- grade
The composite is a weighted blend of 9 inputs, each scored 0–100. Each bar is that input's sub-score; the figure is the points it added to the 100-point composite (weight × sub-score).
- Cash flow +30.0/30.0
- 1% rule +10.0/10.0
- DSCR +10.0/10.0
- Schools +5.3/10.0
- Livability +3.6/5.0
- ARV discount +3.2/15.0
- Rent growth +2.5/5.0
- Condition / age +2.5/5.0
- Appreciation +0.0/10.0
$125,000
🖨 Deal sheet 📄 Offer letter ✓ Due diligence
Listing remarks MLS
Charming home that is almost brand new and well cared for. Home is a Valley which is a high end MFH. Rooms are very spacious throughout. Home has vaulted ceilings, some ceiling fans and solar tube for lighting. Living room has a wood burning fireplace to enjoy the cool nights. Kitchen is open and has upgraded cabinets with some pull outs, a knife drawer and stainless steel appliances. Master bathroom has a walk in shower. On the back of the home there is a large covered wood deck to enjoy the outdoors from. Back yard is fully fenced and has a 10 x 16 shed. This home is move in ready.
Key facts
- Covered deck
- Laminate flooring
- Ensuite bath
Tags
Neighborhood map
What this means for you Summary
Snapshot
- This is a 2-bed/2.0-bath manufactured listed at $125k.
Deal economics
- At list price, monthly cash flow is $704 ($8k/yr) — positive.
- The deal already cash-flows at list — no discount required.
- Meets the 1% rule at list price ($2k rent vs $125k).
- Recommended offer: $123k (1.5% below list) — sets the bar for market timing.
- Cap rate 13.1% vs local median 3.2% in West Richland — top-decile yield for the area; either an underpriced asset or a hidden risk that comps aren't pricing in. Stress-test before assuming the spread holds.
Location & tenants
- Location reads 71/100 on livability (#236 in WA) — a middle-class / working-renter tenant base. Strengths: crime A+, employment A+, housing A+; Watch: cost of living D+, amenities F, commute F.
- Richland School District (urban): math 52% / reading 64% proficiency, ranked #61 of 291 in WA (top 21%) — acceptable for families but not a draw, mixed tenant base, ~2y average lease.
- Market conditions: 243 active listings in the ZIP; 7 comparable units currently listed for rent nearby; rentals leasing fast (median 14d on market — plan ~1-2 weeks tenant-placement turnaround); high-income renter base; 1,532 units permitted in Benton County in 2024 (389 in 5+ unit buildings).
Forward outlook
- Local home prices are declining (-3.0%/yr); year-one equity from $864 of loan paydown is wiped out by about $4k of value loss. Plan a longer hold.
- Benton County population projected at +32% by 2050 — long-run rental-demand tailwind backs the buy-and-hold thesis.
- At projected returns (-3.0% appreciation + 3.0% rent growth), your $35k cash investment doubles in ~6 years — after that, you're playing with house money.
Negotiation context
- It's been on market 18 days — a 2% lower offer ($123k) is reasonable based on typical stale-listing flexibility.
- 2 sale attempts since 6y ago; this cycle's ask has dropped $10k (7%) from the opening price — seller is motivated, your offer sets the floor, not the list.
- Current owner paid $92k; 36% above their basis — modest negotiation headroom, anchor on the comps not their cost.
Risks & watch-outs
- Climate carrying-cost: major wildfire risk; extreme-heat days projected 7→15/yr by 2055 (HVAC capex compounding) — expect insurance premiums to compound above CPI over the hold.
Questions for the listing agent
- Is there a deadline driving the sale (1031 exchange, divorce, estate, relocation)? That informs how much negotiation room exists.
- Schools are B-rated — typically a magnet for longer-tenancy family renters. What's the average tenant stay here, and is there a school-zone premium baked into asking?
- What's the average days-on-market for RENTAL listings here right now (not sales)? A rising rental-DOM trend means longer vacancies and softer asking-rent achievability than the comps imply.
- What's the recent tenant-quality profile in this submarket — average credit score on applications, eviction rate, late-payment / NSF rate, and stable-employment percentage? A property-management company in the area should have these aggregated.
- How much new for-sale + rental construction is in the pipeline within 1–3 miles? Heavy new supply typically softens prices + rents 12–24 months out; constrained supply supports both.
Investment metrics
- 1% rule
- 1.50% ✓
- Cap rate
- 13.05%
- Cash-on-cash
- 24.15%
- DSCR
- 2.07
- GRM
- 5.6
CMA / ARV
- ARV (on-the-fly)
- $114,072
- Comps found
- 11
Show comp detail 11 sales within ~0.75 mi
| Address | Dist | Beds/Ba | Sqft | Sold | Price | $/sf | Match |
|---|---|---|---|---|---|---|---|
| 6306 James St | 0.00mi | 2/2.0 | 1,176 (0%) | 1mo | $125,000 | $106 | 99 |
| 6309 Desert Vw | 0.12mi | 2/1.0 | 1,164 (-1%) | 2mo | $70,000 | $60 | 87 |
| 6305 James St | 0.02mi | 2/2.0 | 1,080 (-8%) | 9mo | $101,500 | $94 | 78 |
| 595 N 60th Ave | 0.29mi | 3/2.0 (+1) | 1,152 (-2%) | 0mo | $288,000 | $250 | 78 |
| 201 N 69th Ave | 0.35mi | 3/2.0 (+1) | 1,188 (+1%) | 4mo | $120,000 | $101 | 74 |
| 104 N 68th Ave | 0.31mi | 3/2.0 (+1) | 1,248 (+6%) | 6mo | $100,000 | $80 | 65 |
| 6806 James St | 0.30mi | 3/2.0 (+1) | 1,269 (+8%) | 6mo | $95,000 | $75 | 63 |
| 205 N 69th Ave | 0.34mi | 2/2.0 | 1,078 (-8%) | 12mo | $104,999 | $97 | 60 |
| 6228 Meyers St | 0.19mi | 3/2.0 (+1) | 1,296 (+10%) | 13mo | $130,150 | $100 | 58 |
| 6705 Haag St | 0.35mi | 2/2.0 | 1,247 (+6%) | 23mo | $85,000 | $68 | 54 |
| 334 Buckwheat Ct | 0.15mi | 3/2.0 (+1) | 1,026 (-13%) | 23mo | $135,000 | $132 | 48 |
Match score weights: distance 35% · size 25% · config 20% · recency 20%. Top-matched comps best support the ARV.
Projected returns pro-forma
-3.0% appreciation · 3.0% rent growth · sell at horizon
- IRR
- 17.4%
- Equity multiple
- 1.70×
- Total profit
- $24,580
- Equity at exit
- $18,638
- IRR
- 25.9%
- Equity multiple
- 3.26×
- Total profit
- $79,069
- Equity at exit
- $10,808
Cash invested: $35,000 (down + closing). Projections, not guarantees.
Landlord ↔ Tenant lean methodology
- Overall (STATE)
- 28 Tenant-Leaning
- State Washington
- 28 Tenant-Leaning · D+8
- County
- — inherits STATE
- City
- — inherits STATE
ZIP-level market 99353
- Active inventory
- 243
- Price-to-rent
- 5.6×
Monthly cashflow live
- Estimated rent
- $1,876 high interval (Pro) →
- Mortgage (P&I)
- −$656
- Tax from tax record
- −$70 /mo · $842/yr
- Insurance
- −$52
- HOA
- −$0
- Vacancy / Maint / Mgmt
- −$394
- Net cashflow
- $704
Break-even live
UW: 25.0% down · 7.5% · 30yr · 1.5% tax · 5.0% vac · 8.0% maint · 8.0% mgmt
Financing live
Cash to close
- Down payment
- $31,250
- Closing costs
- $3,750
- Reserves months
- —
- Total cash needed
- —
Loan-product check · same deal, 3 products live
Conventional
25% down · 7.5% · 30yr
- Down + closing
- —
- Monthly P&I
- —
- Monthly cashflow
- —
- DSCR
- —
- Eligible?
- —
Personal DTI + credit; lowest rate.
DSCR
20% down · 8.5% · 30yr
- Down + closing
- —
- Monthly P&I
- —
- Monthly cashflow
- —
- DSCR
- —
- Eligible?
- —
No personal income docs; deal must DSCR.
Hard money
10% down · 12.0% · 12mo
- Down + closing
- —
- Monthly P&I
- —
- Monthly cashflow
- —
- DSCR
- —
- Eligible?
- —
Short-term bridge; refi at stabilization.
Rent comps 7 comps
| Address | Beds | Baths | Sqft | Rent | $/sqft | DOM | Units | Dist |
|---|---|---|---|---|---|---|---|---|
| 859 Duke Ln West Richland, WA | 3.0 | 2.5 | 1472 | $2,095 | $1.42 | 13d | 1 | 1.05mi |
| 977 Creer Way Unit D-112 West Richland, WA | 3.0 | 2.5 | 1233 | $2,095 | $1.70 | 13d | 1 | 1.12mi |
| 977 Creer Way Unit D-111 West Richland, WA | 3.0 | 2.5 | 1233 | $1,995 | $1.62 | 20d | 1 | 1.12mi |
| 870 Walton Pl West Richland, WA | 2.0 | 2.0 | 919 | $1,495 | $1.63 | 13d | 1 | 1.13mi |
| 8000 Paradise Way West Richland, WA | 2.0 | 2.0 | 924 | $1,575 | $1.70 | 13d | 2 | 1.22mi |
| 7850 Paradise Way West Richland, WA | 2.0 | 2.0 | 929 | $1,500 | $1.61 | 13d | 4 | 1.27mi |
| 8152 Paradise Way West Richland, WA | 2.0–3.0 | 2.0–2.5 | 1262 | $2,095 | $1.66 | 13d | 7 | 1.42mi |
Listing history 5 events
-
2026-04-26status Pending
-
2026-04-18price $125,000
-
2026-04-08$135,000 Active
-
2020-07-02soldstatus $92,000 590-char remark
Show marketing remark (590 chars)
Charming home that is almost brand new and well cared for. Home is a Valley which is a high end MFH. Rooms are very spacious throughout. Home has vaulted ceilings, some ceiling fans and solar tube for lighting. Living room has a wood burning fireplace to enjoy the cool nights. Kitchen is open and has upgraded cabinets with some pull outs, a knife drawer and stainless steel appliances. Master bathroom has a walk in shower. On the back of the home there is a large covered wood deck to enjoy the outdoors from. Back yard is fully fenced and has a 10 x 16 shed. This home is move in ready.
-
2020-05-04$94,900 590-char remark
Show marketing remark (590 chars)
Charming home that is almost brand new and well cared for. Home is a Valley which is a high end MFH. Rooms are very spacious throughout. Home has vaulted ceilings, some ceiling fans and solar tube for lighting. Living room has a wood burning fireplace to enjoy the cool nights. Kitchen is open and has upgraded cabinets with some pull outs, a knife drawer and stainless steel appliances. Master bathroom has a walk in shower. On the back of the home there is a large covered wood deck to enjoy the outdoors from. Back yard is fully fenced and has a 10 x 16 shed. This home is move in ready.
ⓘ Source: listings_history table (triggers on properties + properties_extension) + one-shot
backfill from property_details.listing_events for pre-trigger history.
Tax reassessment forecast WA · Resets to sale price
- Current annual tax
- $842 · $70/mo
- Projected year-2 tax
- $1,225 · $102/mo
- Expected delta
- +$383/yr (+$32/mo · 45.6%)
ⓘ Screening estimate from a state-policy table — verify with the county assessor before closing.
Climate risk First Street
- Flood 1/10 Low FEMA zone X · 0% chance over 30 yrs
- Wildfire 6/10 Major
- Heat 5/10 Major 7 d/yr ≥98°F today · 15 d/yr by 30 yrs out
- Wind 1/10 Low
- Air quality 8/10 Severe 14 unhealthy d/yr today · 14 by 30 yrs out
Nearby sold comps map
Loading sold comps map…
Walkable amenities ~0.75 mi
Loading nearby amenities…
Taxation est. · year 1
- Rental income
- $22,512
- − Mortgage interest
- −$7,002
- − Property taxes
- −$842
- − Insurance
- −$625
- − Repairs & maintenance
- −$1,801
- − Management
- −$1,801
- − Depreciation
- −$3,636
- Taxable income
- $6,806
- Est. tax owed @ 24.0%
- −$1,633
- After-tax cash flow
- $6,819/yr
For passive investors: Depreciation is non-cash, so a rental often shows a tax loss while cash-flowing — sheltering income. Rental losses are passive: they offset passive income freely, and up to $25,000/yr can offset ordinary (W-2) income if you actively participate and your MAGI is under $100k (phasing out to $0 by $150k); unused losses carry forward. On sale, claimed depreciation is recaptured at up to 25%, and gains may owe capital-gains tax (a 1031 exchange can defer both). Figures are a year-1 estimate at your 24.0% rate — not tax advice; consult a CPA.
Schools (NCES district)
- District
- Richland School District
- NCES district ID
- 5307320
- Math proficiency
- 52% ▬ 0.00%
- Reading proficiency
- 64% ▼ -1.00%
- Median HH income
- $70,475
- Composite
- 53.04/100
- National rank
- #3244
- State rank
- #61 of 291 in WA
Livability — West Richland
- Score
- 71/100
- State rank
- #236
- US rank
- #7220
Category grades
Schools grade is shown separately in the Schools card above.
Census & demographics
- Census place
- West Richland, WA
- County
- Benton County · 186,895 people
- City population
- 19,251
- Metro
- Kennewick-Richland, WA
- Population (ZIP)
- 19,251
- Household income
- $121,845
- Rent vs Own
- Severe rent burden
- 254.0
Population outlook (Benton County) Hauer SSP2
- Today (2025)
- 219,421 people
- By 2030
- 233,813 · +6.6%
- By 2040
- 262,134 · +19.5%
- By 2050
- 290,100 · +32.2%
- By 2075
- 363,525 · +65.7%
- By 2100
- 418,667 · +90.8%
Race, ethnicity, and origin ACS 2023
- Neighborhood character
- Predominantly White (74%)
- Race & ethnicity
- White 74% Hispanic / Latino 15% Two or more races 15% Asian 2%
- Hispanic origin (detail)
- Mexican 13%
- Common ancestry
- Portuguese 4% Italian 4% Lithuanian 4%
- Foreign-born
- 7% · Canada, Vietnam, China
- Languages at home
- 87% English-only · Spanish 10% Other Asian/Pacific 1% Arabic 1%
Political lean MEDSL · Benton
- 2024 margin
- Strong R (+21.9) · D 37.7% · R 59.6% · Other 2.7%
- 2008→2024 swing
- +4.2pp toward D · 2008: -26.1pp · 2024: -21.9pp
- All cycles
- 2024: R+21.9 2020: R+21.0 2016: R+26.6 2012: R+27.0 2008: R+26.1
Not yet ingested
- Civics
- —
Market trends
- HPI YoY
- ▼ -218.63%
- Current HPI
- 239.5096
- Rent YoY
- —
- Metro
- Kennewick-Richland, WA
- State GDP YoY
- ▲ 4.65%
- F500 in state
- 22
Industry mix (Fortune 500 HQ in WA)
| Industry | F500 HQs | Revenue |
|---|---|---|
| Retail | 2 | $269B |
|
||
| Technology / Retail | 1 | $638B |
|
||
| Technology | 1 | $245B |
|
||
| Telecommunications | 1 | $38B |
|
||
| Food / Beverage | 1 | $36B |
|
||
| Automotive / Trucks | 1 | $34B |
|
||
Price history
+31.7% since first listed5 events — show timeline
- 2026-04-26 Pending — PACMLS
- 2026-04-18 Price Changed $125,000 PACMLS
- 2026-04-08 Listed $135,000 PACMLS
- 2020-07-02 Sold (MLS) $92,000 PACMLS
- 2020-05-04 Listed $94,900 PACMLS
Property tax history
+0.8%/yrLatest (2026): $842 · -6.9% YoY. Source: county tax records.
Cash-flow waterfall
monthlySold comps — $/sqft
last 12 mo · ≤1 miLoading sold comps…