 Multi-family
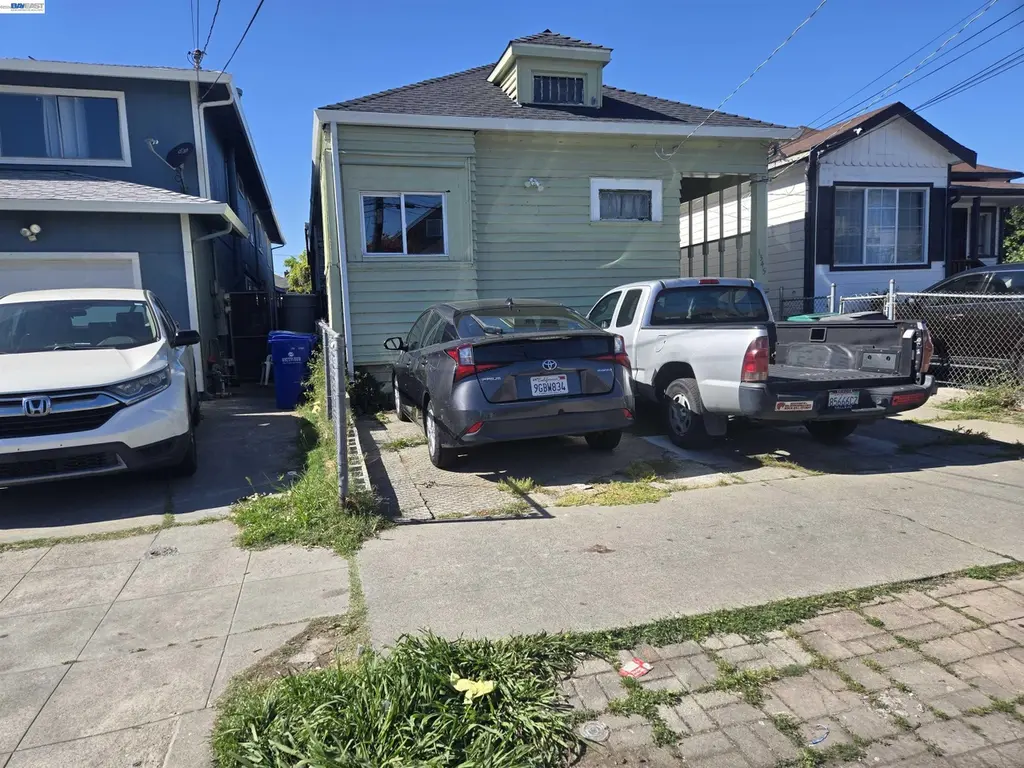
1345 53rd Ave · Oakland, CA
Flood risk 1/10 · Minimal
- FEMA flood zone
- X (unshaded)
- Chance of flooding over 30 yrs
- 0.0%
- Est. flood insurance / yr
- $507 – $1,088
Fire risk 1/10 · Minimal
- Est. fire insurance / yr
- $659 – $1,223
Heat risk 4/10 · Minor
- Hot days now (above 83°F)
- 7 days/yr
- Hot days in 30 yrs
- 15 days/yr
Wind risk 1/10 · Minimal
- Chance of severe wind over 30 yrs
- —
Air-quality risk 8/10 · Major
- Unhealthy air days now
- 14 days/yr
- Unhealthy air days in 30 yrs
- 14 days/yr
Risk factors via First Street. Map © Google.
Why this score? — see what drove the B- grade
The composite is a weighted blend of 9 inputs, each scored 0–100. Each bar is that input's sub-score; the figure is the points it added to the 100-point composite (weight × sub-score).
- Cash flow +24.3/30.0
- ARV discount +15.0/15.0
- DSCR +7.8/10.0
- 1% rule +5.9/10.0
- Livability +3.6/5.0
- Rent growth +3.5/5.0
- Schools +3.0/10.0
- Condition / age +2.5/5.0
- Appreciation +0.0/10.0
$349,000
🖨 Deal sheet 📄 Offer letter ✓ Due diligence
Multi-family units
County records classify this as Multi-Family (2-4 Unit). Listing-text estimate: 1 unit. estimate disagrees with records
Listing remarks MLS
Come and look at these property's potential. Seller tried to convert it to a single family dwelling. Bring your contractor. These property is supposed to be two units. It needs a lot of work. Come convert it to the beautiful duplex is supposed to be. Close to stores, public transportation and schools.
Key facts
- 3,000 sq ft lot
- Built 1906
- Listed 46 days
Property features AI
Finance
- Other: Approximately 1,232 square feet living area; Lot about 0.07 acres (approx. 3,000 sq ft)
Exterior
- Parking: Parking spaces available
- Utilities: Public water; Public sewer
- Home design: Single family residence; Residential property; Built in 1906
- Construction: Wood construction; Shingle roof
- Exterior features: Back yard; Rectangular lot
Interior
- Kitchen: Kitchen with other/unspecified features
- Bedrooms: 2 bedrooms
- Flooring: Wood flooring; Linoleum flooring
- Bathrooms: 2 full bathrooms
- Heating & cooling: Heating present
- Interior features: Gas water heater; One fireplace in the living room; 7 total rooms
- Laundry & utility: Washer/dryer hookups only
Neighborhood map
What this means for you Summary
Snapshot
- This is a 2-bed/2.0-bath multifamily listed at $349k.
Deal economics
- At list price, monthly cash flow is $703 ($8k/yr) — positive.
- The deal already cash-flows at list — no discount required.
- Meets the 1% rule at list price ($4k rent vs $349k).
- Recommended offer: $339k (3.0% below list) — sets the bar for market timing.
- Cap rate 8.7% vs local median 2.4% in Oakland — top-decile yield for the area; either an underpriced asset or a hidden risk that comps aren't pricing in. Stress-test before assuming the spread holds.
Location & tenants
- Location reads 71/100 on livability (#224 in CA) — a middle-class / working-renter tenant base. Strengths: amenities A+, commute A+, employment A+; Watch: schools C-, crime F, cost of living F.
- Oakland Unified (urban): math 27% / reading 33% proficiency, ranked #1,007 of 1,400 in CA (top 72%) — families likely to look elsewhere, expect single-tenant / working-renter base with shorter leases; 68% free/reduced lunch — lower-income household profile, screen leases tightly.
- Market conditions: Rents rising (+3.9%/yr); 116 active listings in the ZIP; 40 comparable units currently listed for rent nearby; rentals lingering (median 44d on market — plan ~5-8 weeks vacancy on turnover, expect pricing pressure); 62% of comp listings sitting > 30 days — soft ceiling on asking rent; 1,742 units permitted in Alameda County in 2024 (856 in 5+ unit buildings).
- At $3,792/mo this rent would consume 63% of the median local household income ($72k/yr) (locally 3603% of renters already pay >50% of income on rent) — very limited rent-growth headroom before tenants either downsize or default.
Forward outlook
- Local home prices are declining (-3.0%/yr); year-one equity from $2k of loan paydown is wiped out by about $10k of value loss. Plan a longer hold.
- Alameda County population projected at +34% by 2050 — long-run rental-demand tailwind backs the buy-and-hold thesis.
Negotiation context
- It's been on market 46 days — a 3% lower offer ($339k) is reasonable based on typical stale-listing flexibility.
- 2 sale attempts with the ask held roughly flat each time — persistent listings suggest the price (not the market) is what's stuck; bring a comps-based counter.
Risks & watch-outs
- Watch-outs: built in 1906 — expect roof / HVAC / electrical / plumbing capex.
Questions for the listing agent
- It's been on market 46 days. Have you received any prior offers? Is the seller open to a 3% concession, seller financing, or rate buy-down credit?
- Built in 1906 — when were the roof, HVAC, electrical panel, plumbing, and water heater last replaced?
- Is there a deadline driving the sale (1031 exchange, divorce, estate, relocation)? That informs how much negotiation room exists.
- Crime grade is F in this area — have there been break-ins, vandalism, or insurance claims at this property in the last 3 years? What carrier currently insures it and at what premium?
- What's the average days-on-market for RENTAL listings here right now (not sales)? A rising rental-DOM trend means longer vacancies and softer asking-rent achievability than the comps imply.
- What's the recent tenant-quality profile in this submarket — average credit score on applications, eviction rate, late-payment / NSF rate, and stable-employment percentage? A property-management company in the area should have these aggregated.
- How much new apartment / multifamily construction is in the pipeline within 1–3 miles? Heavy new supply (>2% of stock underway) typically softens rents 12–24 months out; light construction supports rent growth.
Investment metrics
- 1% rule
- 1.09% ✓
- Cap rate
- 8.71%
- Cash-on-cash
- 8.63%
- DSCR
- 1.38
- GRM
- 7.7
CMA / ARV
- ARV (on-the-fly)
- $428,736
- Comps found
- 1
Show comp detail 1 sale within ~0.75 mi
| Address | Dist | Beds/Ba | Sqft | Sold | Price | $/sf | Match |
|---|---|---|---|---|---|---|---|
| 5330 Bancroft | 0.38mi | 3/2.0 (+1) | 1,407 (+14%) | 19mo | $490,000 | $348 | 38 |
Match score weights: distance 35% · size 25% · config 20% · recency 20%. Top-matched comps best support the ARV.
Projected returns pro-forma
-3.0% appreciation · 3.89% rent growth · sell at horizon
- IRR
- -2.3%
- Equity multiple
- 0.91×
- Total profit
- $-8,385
- Equity at exit
- $52,037
- IRR
- 8.3%
- Equity multiple
- 1.66×
- Total profit
- $64,582
- Equity at exit
- $30,175
Cash invested: $97,720 (down + closing). Projections, not guarantees.
Landlord ↔ Tenant lean methodology
- Overall (CITY)
- 0 Strongly Tenant-Friendly
- State California
- 18 Strongly Tenant-Friendly · D+13
- County
- — inherits STATE
- City Oakland
- 0 Strongly Tenant-Friendly · D+62
ZIP-level market 94601
- Rents YoY
- 3.9%
- Active inventory
- 116
- Price-to-rent
- 15.3×
Monthly cashflow live
- Estimated rent
- $3,792 high interval (Pro) →
- Mortgage (P&I)
- −$1,830
- Tax from tax record
- −$317 /mo · $3,808/yr
- Insurance
- −$145
- HOA
- −$0
- Vacancy / Maint / Mgmt
- −$796
- Net cashflow
- $703
Break-even live
2-unit breakdown (identical units grouped — click to expand)
| Units | Beds | Baths | Est. rent |
|---|---|---|---|
| 2× units | 2 | 1 | $3,792 |
| #1 | 2 | 1 | $1,896 |
| #2 | 2 | 1 | $1,896 |
| Total (2 units) | $3,792 | ||
UW: 25.0% down · 7.5% · 30yr · 1.5% tax · 5.0% vac · 8.0% maint · 8.0% mgmt
Financing live
Cash to close
- Down payment
- $87,250
- Closing costs
- $10,470
- Reserves months
- —
- Total cash needed
- —
Loan-product check · same deal, 3 products live
Conventional
25% down · 7.5% · 30yr
- Down + closing
- —
- Monthly P&I
- —
- Monthly cashflow
- —
- DSCR
- —
- Eligible?
- —
Personal DTI + credit; lowest rate.
DSCR
20% down · 8.5% · 30yr
- Down + closing
- —
- Monthly P&I
- —
- Monthly cashflow
- —
- DSCR
- —
- Eligible?
- —
No personal income docs; deal must DSCR.
Hard money
10% down · 12.0% · 12mo
- Down + closing
- —
- Monthly P&I
- —
- Monthly cashflow
- —
- DSCR
- —
- Eligible?
- —
Short-term bridge; refi at stabilization.
Rent comps 40 comps
| Address | Beds | Baths | Sqft | Rent | $/sqft | DOM | Units | Dist |
|---|---|---|---|---|---|---|---|---|
| 1212 53rd Ave Oakland, CA | 2.0 | 2.0 | 894 | $2,700 | $3.02 | 44d | 1 | 0.13mi |
| 1234 47th Ave Oakland, CA | 2.0 | 1.0 | 1000 | $2,195 | $2.19 | 44d | 1 | 0.28mi |
| 5701 International Blvd Oakland, CA | 1.0 | 1.0 | 1115 | $2,300 | $2.06 | 3d | 2 | 0.35mi |
| 1341 58th Ave Oakland, CA | 1.0 | 1.0 | 1100 | $2,095 | $1.90 | 22d | 1 | 0.36mi |
| 1341 58th Ave Ste 12 Oakland, CA | 1.0 | 1.0 | 1100 | $2,095 | $1.90 | 20d | 1 | 0.36mi |
| 1924 51st Ave Unit 3 Oakland, CA | 3.0 | 2.0 | 1100 | $6,800 | $6.18 | 44d | 1 | 0.38mi |
| 2169 48th Ave Unit A Oakland, CA | 3.0 | 1.0 | 1145 | $2,995 | $2.62 | 44d | 1 | 0.55mi |
| 2169 48th Ave Apt B Oakland, CA | 2.0 | 1.0 | 720 | $2,095 | $2.91 | 44d | 1 | 0.55mi |
| 2169 48th Ave Unit C Oakland, CA | 2.0 | 1.0 | 825 | $2,145 | $2.60 | 44d | 1 | 0.55mi |
| 4500 Ellen St Oakland, CA | 3.0 | 2.0 | 1016 | $2,995 | $2.95 | 24d | 1 | 0.59mi |
| 1701 41st Ave Unit C Oakland, CA | 1.0 | 1.0 | 700 | $1,695 | $2.42 | 44d | 1 | 0.69mi |
| 4500 San Carlos Ave Unit 4502 Oakland, CA | 2.0 | 1.0 | 850 | $2,295 | $2.70 | 44d | 1 | 0.69mi |
| 5834 Elizabeth St Oakland, CA | 3.0 | 1.0 | 1050 | $3,724 | $3.55 | 44d | 1 | 0.72mi |
| 4692 Congress Ave Oakland, CA | 2.0 | 1.0 | 1080 | $2,950 | $2.73 | 20d | 1 | 0.76mi |
| 2049 41st Ave Oakland, CA | 2.0 | 1.0 | 1200 | $2,850 | $2.38 | 44d | 1 | 0.77mi |
| 3907 Wattling St Oakland, CA | 3.0 | 3.0 | 1278 | $3,300 | $2.58 | 44d | 1 | 0.81mi |
| 919 39th Ave Unit 302 Oakland, CA | 3.0 | 3.0 | 1361 | $3,850 | $2.83 | 44d | 1 | 0.82mi |
| 2444 Frances St #4 Oakland, CA | 2.0 | 1.5 | 960 | $3,000 | $3.12 | 44d | 1 | 0.85mi |
| 2444 Frances St Oakland, CA | 2.0 | 1.5 | 960 | $2,700 | $2.81 | 24d | 1 | 0.85mi |
| 3700 International Blvd Oakland, CA | 2.0–3.0 | 1.0–1.5 | 932 | $2,041 | $2.19 | 2d | 2 | 0.90mi |
| 4124 Lyon Ave Unit 6 Oakland, CA | 3.0 | 1.5 | 1055 | $2,895 | $2.74 | 44d | 1 | 0.96mi |
| 1501 37th Ave Unit B1 Oakland, CA | 1.0 | 2.0 | 940 | $2,707 | $2.88 | 16d | 1 | 0.96mi |
| 908 36th Ave Unit 2 Oakland, CA | 2.0 | 1.0 | 883 | $2,200 | $2.49 | 44d | 1 | 0.97mi |
| 840 36th Ave Oakland, CA | 2.0 | 1.0 | 800 | $2,300 | $2.88 | 5d | 1 | 0.98mi |
| 3532 San Leandro St Unit B Oakland, CA | 1.0 | 1.0 | 818 | $2,000 | $2.44 | 5d | 1 | 0.98mi |
| 2837 55th Ave #4 Oakland, CA | 2.0 | 2.0 | 1075 | $2,825 | $2.63 | 44d | 1 | 1.00mi |
| 1711 Bridge Ave Unit Lo Oakland, CA | 3.0 | 2.0 | 1007 | $3,295 | $3.27 | 44d | 1 | 1.01mi |
| 1132 69th Ave Oakland, CA | 2.0 | 1.0 | 750 | $2,500 | $3.33 | 44d | 1 | 1.01mi |
| 5633 Picardy Dr S Oakland, CA | 2.0 | 1.0 | 1130 | $3,700 | $3.27 | 44d | 1 | 1.02mi |
| 4515 Penniman Ave Unit 4511 Oakland, CA | 1.0 | 1.0 | 787 | $1,995 | $2.53 | 24d | 1 | 1.06mi |
| 4511 Penniman Ave Oakland, CA | 1.0 | 1.0 | 787 | $1,995 | $2.53 | 44d | 1 | 1.06mi |
| 3411 E 12th St Oakland, CA | 1.0 | 1.5 | 855 | $2,385 | $2.79 | 4d | 3 | 1.07mi |
| 2701 High St Oakland, CA | 2.0 | 1.0 | 1024 | $2,223 | $2.17 | 5d | 3 | 1.08mi |
| 4350 Fleming Ave Oakland, CA | 2.0 | 1.0 | 875 | $2,000 | $2.29 | 18d | 1 | 1.09mi |
| 1920 Crosby Ave Unit 1918 Oakland, CA | 2.0 | 1.0 | 1000 | $2,100 | $2.10 | 44d | 1 | 1.13mi |
| 2442 Havenscourt Blvd Oakland, CA | 2.0 | 1.0 | 1182 | $4,000 | $3.38 | 44d | 1 | 1.14mi |
| 844 33rd Ave Oakland, CA | 2.0 | 1.0 | 875 | $2,650 | $3.03 | 3d | 1 | 1.14mi |
| 3524 Foothill Blvd Unit 12 Oakland, CA | 2.0 | 1.0 | 800 | $2,000 | $2.50 | 44d | 1 | 1.15mi |
| 3567 Davis St Oakland, CA | 2.0 | 1.0 | 800 | $2,800 | $3.50 | 44d | 1 | 1.21mi |
| 3625 Lyon Ave Oakland, CA | 2.0 | 1.0 | 1200 | $2,400 | $2.00 | 44d | 1 | 1.21mi |
Listing history 7 events
-
2026-05-23status Pending 302-char remark
Show marketing remark (302 chars)
Come and look at these property's potential. Seller tried to convert it to a single family dwelling. Bring your contractor. These property is supposed to be two units. It needs a lot of work. Come convert it to the beautiful duplex is supposed to be. Close to stores, public transportation and schools.
-
2026-05-23status Pending
Show marketing remark (302 chars)
Come and look at these property's potential. Seller tried to convert it to a single family dwelling. Bring your contractor. These property is supposed to be two units. It needs a lot of work. Come convert it to the beautiful duplex is supposed to be. Close to stores, public transportation and schools.
-
2026-04-22historical Active Under Contract 302-char remark
Show marketing remark (302 chars)
Come and look at these property's potential. Seller tried to convert it to a single family dwelling. Bring your contractor. These property is supposed to be two units. It needs a lot of work. Come convert it to the beautiful duplex is supposed to be. Close to stores, public transportation and schools.
-
2026-04-22historical Active Under Contract
Show marketing remark (302 chars)
Come and look at these property's potential. Seller tried to convert it to a single family dwelling. Bring your contractor. These property is supposed to be two units. It needs a lot of work. Come convert it to the beautiful duplex is supposed to be. Close to stores, public transportation and schools.
-
2026-04-07price $349,000 302-char remark
Show marketing remark (302 chars)
Come and look at these property's potential. Seller tried to convert it to a single family dwelling. Bring your contractor. These property is supposed to be two units. It needs a lot of work. Come convert it to the beautiful duplex is supposed to be. Close to stores, public transportation and schools.
-
2026-04-06$345,000 Active 302-char remark
Show marketing remark (302 chars)
Come and look at these property's potential. Seller tried to convert it to a single family dwelling. Bring your contractor. These property is supposed to be two units. It needs a lot of work. Come convert it to the beautiful duplex is supposed to be. Close to stores, public transportation and schools.
-
2026-04-06$349,000 Active
Show marketing remark (302 chars)
Come and look at these property's potential. Seller tried to convert it to a single family dwelling. Bring your contractor. These property is supposed to be two units. It needs a lot of work. Come convert it to the beautiful duplex is supposed to be. Close to stores, public transportation and schools.
ⓘ Source: listings_history table (triggers on properties + properties_extension) + one-shot
backfill from property_details.listing_events for pre-trigger history.
Tax reassessment forecast CA · Resets to sale price
- Current annual tax
- $3,808 · $317/mo
- Projected year-2 tax
- $3,808 · $317/mo
- Expected delta
- $0/yr ($0/mo · -0.0%)
ⓘ Screening estimate from a state-policy table — verify with the county assessor before closing.
Climate risk First Street
- Flood 1/10 Low FEMA zone X (unshaded) · 0% chance over 30 yrs
- Wildfire 1/10 Low
- Heat 4/10 Moderate 7 d/yr ≥83°F today · 15 d/yr by 30 yrs out
- Wind 1/10 Low
- Air quality 8/10 Severe 14 unhealthy d/yr today · 14 by 30 yrs out
Nearby sold comps map
Loading sold comps map…
Walkable amenities ~0.75 mi
Loading nearby amenities…
Taxation est. · year 1
- Rental income
- $45,504
- − Mortgage interest
- −$19,549
- − Property taxes
- −$3,808
- − Insurance
- −$1,745
- − Repairs & maintenance
- −$3,640
- − Management
- −$3,640
- − Depreciation
- −$10,153
- Taxable income
- $2,968
- Est. tax owed @ 24.0%
- −$712
- After-tax cash flow
- $7,721/yr
For passive investors: Depreciation is non-cash, so a rental often shows a tax loss while cash-flowing — sheltering income. Rental losses are passive: they offset passive income freely, and up to $25,000/yr can offset ordinary (W-2) income if you actively participate and your MAGI is under $100k (phasing out to $0 by $150k); unused losses carry forward. On sale, claimed depreciation is recaptured at up to 25%, and gains may owe capital-gains tax (a 1031 exchange can defer both). Figures are a year-1 estimate at your 24.0% rate — not tax advice; consult a CPA.
Schools (NCES district)
- District
- Oakland Unified
- NCES district ID
- 0628050
- Math proficiency
- 27% ▬ 0.00%
- Reading proficiency
- 33% ▬ 0.00%
- Median HH income
- $55,194
- Composite
- 29.52/100
- National rank
- #11769
- State rank
- #1007 of 1400 in CA
Livability — Oakland
- Score
- 71/100
- State rank
- #224
- US rank
- #7245
Category grades
Schools grade is shown separately in the Schools card above.
Census & demographics
- Census place
- Oakland, CA
- County
- Alameda County · 1,614,355 people
- City population
- 385,993
- Metro
- San Francisco-Oakland-Berkeley, CA
- Population (ZIP)
- 53,259
- Household income
- $72,359
- Rent vs Own
- Severe rent burden
- 3603.0
Population outlook (Alameda County) Hauer SSP2
- Today (2025)
- 1,928,884 people
- By 2030
- 2,069,146 · +7.3%
- By 2040
- 2,338,405 · +21.2%
- By 2050
- 2,586,608 · +34.1%
- By 2075
- 3,061,911 · +58.7%
- By 2100
- 3,234,133 · +67.7%
Race, ethnicity, and origin ACS 2023
- Neighborhood character
- Diverse neighborhood (Simpson 0.66)
- Race & ethnicity
- Hispanic / Latino 53% Asian 18% Black 13% White 11% Two or more races 10% Native American 3%
- Hispanic origin (detail)
- Mexican 35%
- Common ancestry
- Italian 1% Scotch-Irish 1%
- Foreign-born
- 40% · Canada, Vietnam, China
- Languages at home
- 35% English-only · Spanish 46% Chinese 5% Vietnamese 4%
Political lean MEDSL · Alameda
- 2024 margin
- Solid D (+53.6) · D 74.6% · R 21.0% · Other 4.4%
- 2008→2024 swing
- -5.9pp toward R · 2008: 59.5pp · 2024: 53.6pp
- All cycles
- 2024: D+53.6 2020: D+62.5 2016: D+64.4 2012: D+59.8 2008: D+59.5
Not yet ingested
- Civics
- —
Market trends
- HPI YoY
- ▼ -1045.52%
- Current HPI
- 347.3256
- Rent YoY
- ▲ 3.89%
- Metro
- San Francisco-Oakland-Berkeley, CA
- State GDP YoY
- ▲ 3.21%
- F500 in state
- 116
Industry mix (Fortune 500 HQ in CA)
| Industry | F500 HQs | Revenue |
|---|---|---|
| Technology | 27 | $1,492B |
|
||
| Financial Services | 3 | $174B |
|
||
| Retail | 3 | $44B |
|
||
| Insurance | 3 | $26B |
|
||
| Media / Entertainment | 2 | $115B |
|
||
| Pharmaceuticals / Biotech | 2 | $62B |
|
||
Price history
+1.2% since first listed7 events — show timeline
- 2026-05-23 Pending — bridgeMLS, Bay East AOR, or Contra Costa AOR
- 2026-05-23 Pending — bridgeMLS, Bay East AOR, or Contra Costa AOR
- 2026-04-22 Contingent — bridgeMLS, Bay East AOR, or Contra Costa AOR
- 2026-04-22 Contingent — bridgeMLS, Bay East AOR, or Contra Costa AOR
- 2026-04-07 Price Changed $349,000 bridgeMLS, Bay East AOR, or Contra Costa AOR
- 2026-04-06 Listed $349,000 bridgeMLS, Bay East AOR, or Contra Costa AOR
- 2026-04-06 Listed $345,000 bridgeMLS, Bay East AOR, or Contra Costa AOR
Property tax history
+3.9%/yrLatest (2025): $3,808 · +5.2% YoY. Source: county tax records.
Cash-flow waterfall
monthlySold comps — $/sqft
last 12 mo · ≤1 miLoading sold comps…