10531 Curving Creek Loop · Ruskin, FL
Flood risk No data
- FEMA flood zone
- —
- Chance of flooding over 30 yrs
- —
- Est. flood insurance / yr
- —
Fire risk No data
- Est. fire insurance / yr
- —
Heat risk No data
- Hot days now (above threshold)
- —
- Hot days in 30 yrs
- —
Wind risk No data
- Chance of severe wind over 30 yrs
- —
Air-quality risk No data
- Unhealthy air days now
- —
- Unhealthy air days in 30 yrs
- —
Risk factors via First Street. Map © Google.
Why this score? — see what drove the D+ grade
The composite is a weighted blend of 9 inputs, each scored 0–100. Each bar is that input's sub-score; the figure is the points it added to the 100-point composite (weight × sub-score).
- Cash flow +16.6/30.0
- ARV discount +9.6/15.0
- DSCR +5.1/10.0
- 1% rule +4.8/10.0
- Schools +4.4/10.0
- Livability +3.6/5.0
- Rent growth +2.3/5.0
- Condition / age +1.0/5.0
- Appreciation +0.0/10.0
$279,990
🖨 Deal sheet 📄 Offer letter ✓ Due diligence
Listing remarks
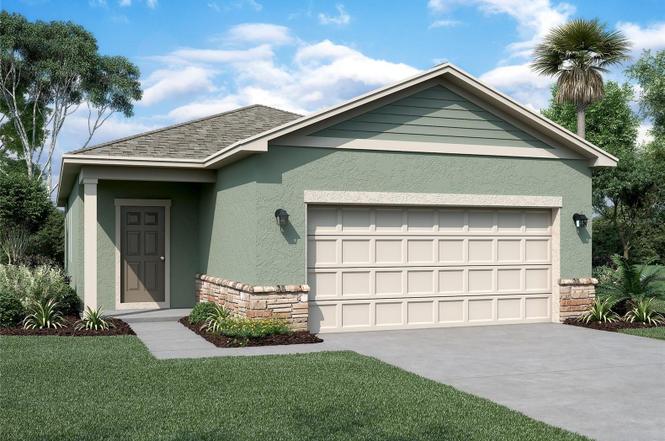
Under Construction. The Odyssey floor plan in our Oakfield Lakes community features 3 bedrooms, 2 baths, with a modern layout, and 2 car garage. The open-concept kitchen, dining, and living area include granite countertops, high ceilings, and brand-new stainless steel appliances. Enjoy the outdoors with a private backyard, covered rear patio, and visit the resort style pool located within the community. This home is perfect for modern living and entertaining! Schedule an appointment today to visit Starlight Homes in Oakfield Lakes!
Key facts
- Open-concept kitchen
- Private backyard
- Covered rear patio
Tags
Property features AI
Finance
- Other: Located at 10531 Curving Creek Loop, Parrish FL 34219; Active listing
Exterior
- Parking: 2 parking spaces
- Utilities: Electric service; Central air
- Home design: Spec inventory — Odyssey plan
- Exterior features: Living area of 1366
Interior
- Bedrooms: 3 bedrooms
- Bathrooms: 2 full bathrooms
- Heating & cooling: Electric heating with heat pump; Central air conditioning
- Interior features: Dishwasher; Disposal; Microwave
Neighborhood map
What this means for you Summary
Snapshot
- This is a 3-bed/2.0-bath single-family listed at $280k. Condition is rated poor.
Deal economics
- At list price, monthly cash flow is $168 ($2k/yr) — positive.
- The deal already cash-flows at list — no discount required.
- To meet the 1% rule (rent ≥ 1% of price), the offer needs to be $275k (1.7% below list).
- Recommended offer: $275k (1.7% below list) — sets the bar for 1% rule.
- Cap rate 7.0% vs local median 4.7% in Ruskin — top-decile yield for the area; either an underpriced asset or a hidden risk that comps aren't pricing in. Stress-test before assuming the spread holds.
Location & tenants
- Location reads 71/100 on livability (#392 in FL) — a middle-class / working-renter tenant base. Strengths: cost of living A+, housing A+, commute B+; Watch: schools F, amenities F, health & safety F.
- Manatee (suburban): math 54% / reading 50% proficiency, ranked #26 of 73 in FL (top 36%) — acceptable for families but not a draw, mixed tenant base, ~2y average lease.
- Market conditions: Rents soft (-0.9%/yr); 2170 active listings in the ZIP; 3 comparable units currently listed for rent nearby; rentals at typical pace (median 15d on market — plan ~3-4 weeks tenant-placement turnaround); high-income renter base; 7,472 units permitted in Manatee County in 2024 (1,782 in 5+ unit buildings).
Forward outlook
- Local home prices are declining (-3.0%/yr); year-one equity from $2k of loan paydown is wiped out by about $8k of value loss. Plan a longer hold.
- Manatee County population projected at +43% by 2050 — long-run rental-demand tailwind backs the buy-and-hold thesis.
Negotiation context
- Only 5 days on market — expect competitive offers; lowballing is unlikely to land.
Questions for the listing agent
- Have any recent inspections been done? Can we get a copy of the seller's disclosures and any deferred-maintenance estimates?
- What does the HOA fee cover, when was the last increase, and are there any pending special assessments or reserve-fund shortfalls?
- Is there a deadline driving the sale (1031 exchange, divorce, estate, relocation)? That informs how much negotiation room exists.
- Schools are F-rated, which usually means shorter tenancies and higher turnover. Who's the typical renter profile here, and what's been the actual vacancy rate?
- The area grade is low — what's the realistic commute time and amenity access for the typical tenant pool here? Any planned neighborhood developments (good or bad) we should know about?
- What's the average days-on-market for RENTAL listings here right now (not sales)? A rising rental-DOM trend means longer vacancies and softer asking-rent achievability than the comps imply.
- What's the recent tenant-quality profile in this submarket — average credit score on applications, eviction rate, late-payment / NSF rate, and stable-employment percentage? A property-management company in the area should have these aggregated.
- How much new for-sale + rental construction is in the pipeline within 1–3 miles? Heavy new supply typically softens prices + rents 12–24 months out; constrained supply supports both.
Investment metrics
- 1% rule
- 0.98% ✗
- Cap rate
- 7.01%
- Cash-on-cash
- 2.57%
- DSCR
- 1.11
- GRM
- 8.5
CMA / ARV
- ARV (on-the-fly)
- $293,690
- Comps found
- 12
Show comp detail 12 sales within ~0.75 mi
| Address | Dist | Beds/Ba | Sqft | Sold | Price | $/sf | Match |
|---|---|---|---|---|---|---|---|
| 10515 Curving Creek Loop | 0.03mi | 3/2.0 | 1,366 (0%) | 1mo | $306,990 | $225 | 98 |
| 10473 Curving Creek Loop | 0.08mi | 3/2.0 | 1,366 (0%) | 2mo | $279,990 | $205 | 95 |
| 10464 Curving Creek Loop | 0.10mi | 3/2.0 | 1,366 (0%) | 3mo | $309,959 | $227 | 93 |
| 10468 Curving Creek Loop | 0.09mi | 3/2.0 | 1,522 (+11%) | 1mo | $319,990 | $210 | 76 |
| 10412 Curving Creek Loop | 0.20mi | 3/2.0 | 1,223 (-10%) | 0mo | $302,626 | $247 | 73 |
| 13125 Old Canoe Way | 0.19mi | 3/2.0 | 1,223 (-10%) | 1mo | $294,000 | $240 | 73 |
| 9332 Chiswell Trl | 0.70mi | 3/2.0 | 1,455 (+6%) | 3mo | $280,250 | $193 | 54 |
| 12431 Hopscotch Ave | 0.55mi | 4/2.0 (+1) | 1,498 (+10%) | 2mo | $312,000 | $208 | 52 |
| 10724 Gentle Current Way | 0.58mi | 4/2.0 (+1) | 1,498 (+10%) | 1mo | $322,000 | $215 | 51 |
| 12420 Hopscotch Ave | 0.59mi | 4/2.0 (+1) | 1,498 (+10%) | 1mo | $330,000 | $220 | 51 |
| 10628 Hidden Banks Gln | 0.73mi | 3/2.0 | 1,504 (+10%) | 3mo | $323,750 | $215 | 47 |
| 10631 Hidden Banks Gln | 0.75mi | 3/2.0 | 1,504 (+10%) | 2mo | $306,000 | $203 | 46 |
Match score weights: distance 35% · size 25% · config 20% · recency 20%. Top-matched comps best support the ARV.
Projected returns pro-forma
-3.0% appreciation · 0.0% rent growth · sell at horizon
- IRR
- -15.8%
- Equity multiple
- 0.46×
- Total profit
- $-42,674
- Equity at exit
- $41,747
- IRR
- -13.9%
- Equity multiple
- 0.31×
- Total profit
- $-54,229
- Equity at exit
- $24,208
Cash invested: $78,397 (down + closing). Projections, not guarantees.
Landlord ↔ Tenant lean methodology
- Overall (STATE)
- 87 Strongly Landlord-Friendly
- State Florida
- 87 Strongly Landlord-Friendly · R+3
- County
- — inherits STATE
- City
- — inherits STATE
ZIP-level market 34219
- Home prices YoY
- -23.7%
- Rents YoY
- -0.9%
- Active inventory
- 2170
- Price-to-rent
- 8.5×
Monthly cashflow live
- Estimated rent
- $2,751 medium interval (Pro) →
- Mortgage (P&I)
- −$1,468
- Tax est. 1.5%
- −$350 /mo · $4,200/yr
- Insurance
- −$117
- HOA
- −$71
- Vacancy / Maint / Mgmt
- −$578
- Net cashflow
- $168
Break-even live
UW: 25.0% down · 7.5% · 30yr · 1.5% tax · 5.0% vac · 8.0% maint · 8.0% mgmt
Financing live
Cash to close
- Down payment
- $69,998
- Closing costs
- $8,400
- Reserves months
- —
- Total cash needed
- —
Loan-product check · same deal, 3 products live
Conventional
25% down · 7.5% · 30yr
- Down + closing
- —
- Monthly P&I
- —
- Monthly cashflow
- —
- DSCR
- —
- Eligible?
- —
Personal DTI + credit; lowest rate.
DSCR
20% down · 8.5% · 30yr
- Down + closing
- —
- Monthly P&I
- —
- Monthly cashflow
- —
- DSCR
- —
- Eligible?
- —
No personal income docs; deal must DSCR.
Hard money
10% down · 12.0% · 12mo
- Down + closing
- —
- Monthly P&I
- —
- Monthly cashflow
- —
- DSCR
- —
- Eligible?
- —
Short-term bridge; refi at stabilization.
Rent comps 3 comps
| Address | Beds | Baths | Sqft | Rent | $/sqft | DOM | Units | Dist |
|---|---|---|---|---|---|---|---|---|
| 10473 Curving Creek Loop Parrish, FL | 3.0 | 2.0 | 1366 | $2,500 | $1.83 | 14d | 1 | 0.10mi |
| 10826 Sapphire Breeze Cv Palmetto, FL | 4.0 | 2.0 | 1850 | $2,500 | $1.35 | 3d | 1 | 0.48mi |
| 10646 Hidden Banks Gln Parrish, FL | 3.0 | 2.0 | 1504 | $2,350 | $1.56 | 16d | 1 | 0.78mi |
HOA detail
- Monthly dues
- $71 · $852/yr
- Likely covers
- pool
Listing history 8 events
-
2026-06-18days on market $279,990 Active 5 DOM
-
2026-06-17days on market $279,990 Active 4 DOM
-
2026-06-16days on market $279,990 Active 3 DOM
-
2026-06-15remarks 537-char remark
-
2026-06-15pricedays on market $279,990 Active 2 DOM
-
2026-06-13days on market $311,895 Active 3 DOM
-
2026-06-13remarks 457-char remark
-
2026-06-13$311,895 Active 2 DOM
ⓘ Source: listings_history table (triggers on properties + properties_extension) + one-shot
backfill from property_details.listing_events for pre-trigger history.
Nearby sold comps map
Loading sold comps map…
Walkable amenities ~0.75 mi
Loading nearby amenities…
Taxation est. · year 1
- Rental income
- $33,016
- − Mortgage interest
- −$15,684
- − Property taxes
- −$4,200
- − Insurance
- −$1,400
- − Repairs & maintenance
- −$2,641
- − Management
- −$2,641
- − HOA
- −$852
- − Depreciation
- −$8,145
- Taxable loss
- −$2,547
- Est. tax savings @ 24.0%
- +$611
- After-tax cash flow
- $2,623/yr
For passive investors: Depreciation is non-cash, so a rental often shows a tax loss while cash-flowing — sheltering income. Rental losses are passive: they offset passive income freely, and up to $25,000/yr can offset ordinary (W-2) income if you actively participate and your MAGI is under $100k (phasing out to $0 by $150k); unused losses carry forward. On sale, claimed depreciation is recaptured at up to 25%, and gains may owe capital-gains tax (a 1031 exchange can defer both). Figures are a year-1 estimate at your 24.0% rate — not tax advice; consult a CPA.
Condition & rehab AI · 1 photo
This property is under construction and requires extensive renovation to bring it up to a livable condition. Significant structural and aesthetic improvements are needed to increase its resale and rental value.
Repairs flagged
- Major roof — No visible roof structure
- Major exterior — No visible exterior structure
- Major flooring — No visible flooring
- Major interior walls/paint — No visible interior walls or paint
- Major bathrooms — No visible bathrooms
- Major kitchen — No visible kitchen
- Major systems — No visible HVAC or mechanical systems
Value-add opportunities
- Both Complete renovation of the entire home — A complete renovation would significantly improve the home's condition and appeal to both buyers and renters.
- Both Modernize the kitchen and bathrooms with updated fixtures and finishes — Upgrading the kitchen and bathrooms would enhance the home's functionality and aesthetic appeal, making it more attractive to potential buyers and renters.
- Both Install new flooring throughout the home — New flooring would improve the home's appearance and increase its value by making it more appealing to both buyers and renters.
- Both Paint interior walls and trim to freshen the home's appearance — Fresh paint would improve the home's appearance and make it more attractive to potential buyers and renters.
- Both Replace or repair any visible structural issues — Addressing any structural issues would ensure the home's safety and increase its value by making it more attractive to potential buyers and renters.
- Both Install new HVAC and mechanical systems — Upgrading the HVAC and mechanical systems would improve the home's comfort and energy efficiency, making it more attractive to potential buyers and renters.
- Both Landscaping and curb appeal improvements — Enhancing the landscaping and curb appeal would improve the home's exterior and make it more attractive to potential buyers and renters.
- Both Install a new roof and siding — A new roof and siding would significantly improve the home's exterior and increase its value by making it more attractive to potential buyers and renters.
Renovation cost estimate screening
| Repair item | Severity | Est. cost |
|---|---|---|
| roof · No visible roof structure | Major | $15,000–50,000 |
| exterior · No visible exterior structure | Major | $15,000–50,000 |
| flooring · No visible flooring | Major | $15,000–50,000 |
| interior walls/paint · No visible interior walls or paint | Major | $15,000–50,000 |
| bathrooms · No visible bathrooms | Major | $15,000–50,000 |
| kitchen · No visible kitchen | Major | $15,000–50,000 |
| systems · No visible HVAC or mechanical systems | Major | $15,000–50,000 |
| Total estimated repair cost · 7 items | $105,000–350,000 |
Value-add ROI direction
- Both Complete renovation of the entire home — A complete renovation would significantly improve the home's condition and appeal to both buyers and renters. ↑
- Both Modernize the kitchen and bathrooms with updated fixtures and finishes — Upgrading the kitchen and bathrooms would enhance the home's functionality and aesthetic appeal, making it more attractive to potential buyers and renters. ↑
- Both Install new flooring throughout the home — New flooring would improve the home's appearance and increase its value by making it more appealing to both buyers and renters. ↑
- Both Paint interior walls and trim to freshen the home's appearance — Fresh paint would improve the home's appearance and make it more attractive to potential buyers and renters. ↑
- Both Replace or repair any visible structural issues — Addressing any structural issues would ensure the home's safety and increase its value by making it more attractive to potential buyers and renters. ↑
- Both Install new HVAC and mechanical systems — Upgrading the HVAC and mechanical systems would improve the home's comfort and energy efficiency, making it more attractive to potential buyers and renters. ↑
- Both Landscaping and curb appeal improvements — Enhancing the landscaping and curb appeal would improve the home's exterior and make it more attractive to potential buyers and renters. ↑
- Both Install a new roof and siding — A new roof and siding would significantly improve the home's exterior and increase its value by making it more attractive to potential buyers and renters. ↑
ⓘ Cost ranges are severity-bucket heuristics (US national rule-of-thumb). Get contractor quotes + a written scope before underwriting a rehab budget.
Schools (NCES district)
- District
- Manatee
- NCES district ID
- 1201230
- Math proficiency
- 54% ▼ -6.00%
- Reading proficiency
- 50% ▼ -2.00%
- Median HH income
- $49,607
- Composite
- 44.43/100
- National rank
- #2806
- State rank
- #26 of 73 in FL
Livability — Ruskin
- Score
- 71/100
- State rank
- #392
- US rank
- #6879
Category grades
Schools grade is shown separately in the Schools card above.
Census & demographics
- County
- Manatee County · 416,364 people
- City population
- 33,319
- Metro
- North Port-Sarasota-Bradenton, FL
- Population (ZIP)
- 33,296
- Household income
- $113,773
- Rent vs Own
- Severe rent burden
- 219.0
Population outlook (Manatee County) Hauer SSP2
- Today (2025)
- 447,342 people
- By 2030
- 488,911 · +9.3%
- By 2040
- 567,934 · +27.0%
- By 2050
- 637,995 · +42.6%
- By 2075
- 781,970 · +74.8%
- By 2100
- 848,272 · +89.6%
Race, ethnicity, and origin ACS 2023
- Neighborhood character
- Predominantly White (75%)
- Race & ethnicity
- White 75% Hispanic / Latino 11% Two or more races 8% Black 8% Asian 2%
- Hispanic origin (detail)
- Mexican 2% Puerto Rican 3%
- Common ancestry
- Romanian 4% Hispanic 2% Russian 2%
- Foreign-born
- 10% · Canada, Dominican Republic, Jamaica
- Languages at home
- 88% English-only · Spanish 7% French/Haitian/Cajun 2% Other Asian/Pacific 1%
Political lean MEDSL · Manatee
- 2024 margin
- Strong R (+23.5) · D 37.9% · R 61.4%
- 2008→2024 swing
- -16.5pp toward R · 2008: -7.0pp · 2024: -23.5pp
- All cycles
- 2024: R+23.5 2020: R+16.1 2016: R+17.1 2012: R+12.5 2008: R+7.0
Not yet ingested
- Civics
- —
Market trends
- HPI YoY
- ▼ -84.45%
- Current HPI
- 271.7131
- Rent YoY
- ▼ -0.95%
- Metro
- North Port-Sarasota-Bradenton, FL
- State GDP YoY
- ▲ 3.28%
- F500 in state
- 36
Industry mix (Fortune 500 HQ in FL)
| Industry | F500 HQs | Revenue |
|---|---|---|
| Industrial Technology | 2 | $29B |
|
||
| Insurance | 2 | $17B |
|
||
| Retail | 1 | $60B |
|
||
| Technology Distribution | 1 | $58B |
|
||
| Homebuilding | 1 | $35B |
|
||
| Technology Manufacturing | 1 | $35B |
|
||
Cash-flow waterfall
monthlySold comps — $/sqft
last 12 mo · ≤1 miLoading sold comps…