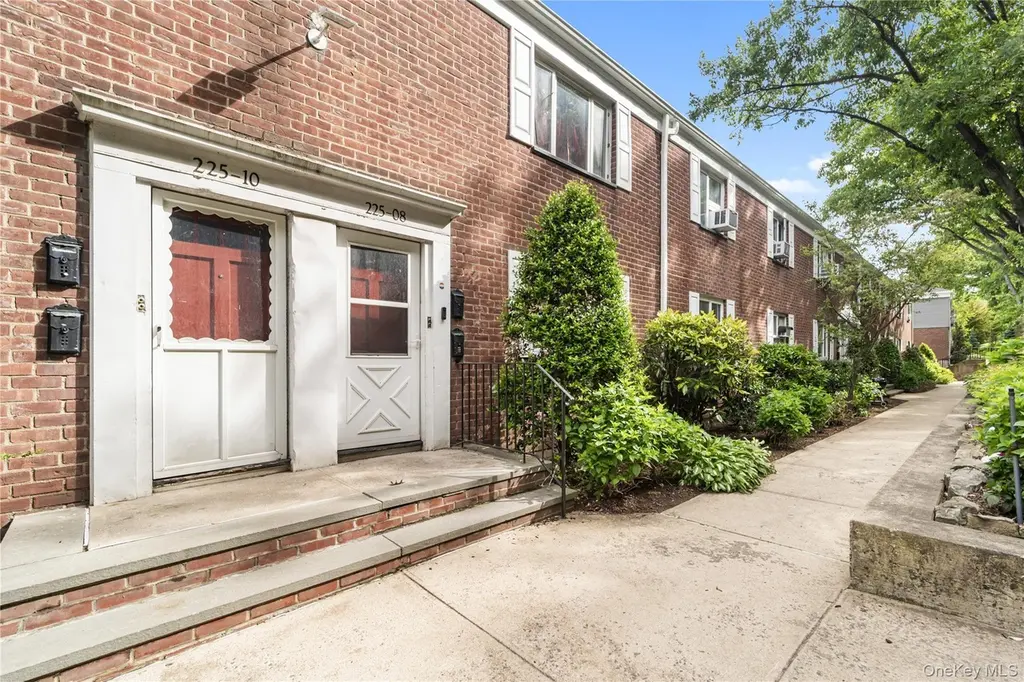
225-08 Stronghurst Ave · New York, NY
Flood risk No data
- FEMA flood zone
- —
- Chance of flooding over 30 yrs
- —
- Est. flood insurance / yr
- —
Fire risk No data
- Est. fire insurance / yr
- —
Heat risk No data
- Hot days now (above threshold)
- —
- Hot days in 30 yrs
- —
Wind risk No data
- Chance of severe wind over 30 yrs
- —
Air-quality risk No data
- Unhealthy air days now
- —
- Unhealthy air days in 30 yrs
- —
Risk factors via First Street. Map © Google.
Why this score? — see what drove the D grade
The composite is a weighted blend of 9 inputs, each scored 0–100. Each bar is that input's sub-score; the figure is the points it added to the 100-point composite (weight × sub-score).
- Cash flow +12.4/30.0
- ARV discount +7.5/15.0
- Schools +5.0/10.0
- Livability +3.8/5.0
- DSCR +3.7/10.0
- 1% rule +3.6/10.0
- Rent growth +2.5/5.0
- Condition / age +2.2/5.0
- Appreciation +0.0/10.0
$270,000
🖨 Deal sheet 📄 Offer letter ✓ Due diligence
Listing remarks MLS
Beautiful Large 2 Bedrooms With Large Dining Area, Upper Unit. Desirable Location. School District# 26. Close To Shops & Transportation., Additional information: Interior Features:Efficiency Kitchen,Lr/Dr
Key facts
- Garage
- Built 1955
- Listed 27 days
Property features AI
Finance
- HOA & community: Onsite association; Association amenities include a park; Association fee includes heat
Exterior
- Parking: Garage
- Utilities: Public sewer; Public trash collection
- Home design: Stock cooperative property
- Construction: Brick construction
- Exterior features: Brick construction; Near public transit; Near shops; Not waterfront
Interior
- Kitchen: Tankless water heater
- Bathrooms: One full bathroom
- Heating & cooling: Oil heating; Steam heating; Other heating; No central cooling
- Interior features: Other interior features; Full attic; Five total rooms; Two-story building with entry on second level; No pets allowed
Neighborhood map
What this means for you Summary
Snapshot
- This is a 2-bed/1.0-bath condo listed at $270k. Condition is rated fair.
Deal economics
- At list price, monthly cash flow is $-42 ($-506/yr) — negative.
- To cash-flow at today's rent, offer at most $264k (2.3% below list).
- To meet the 1% rule (rent ≥ 1% of price), the offer needs to be $231k (14.5% below list).
- Recommended offer: $231k (14.5% below list) — sets the bar for 1% rule.
- Cap rate 6.1% vs local median 2.6% in New York — top-decile yield for the area; either an underpriced asset or a hidden risk that comps aren't pricing in. Stress-test before assuming the spread holds.
Location & tenants
- Location reads 75/100 on livability (#268 in NY, #4,188 nationally) — a middle-class / working-renter tenant base. Strengths: amenities A+, commute A+, health & safety A; Watch: crime F, cost of living F.
- Market conditions: 113 active listings in the ZIP; 7 comparable units currently listed for rent nearby; rentals at typical pace (median 25d on market — plan ~3-4 weeks tenant-placement turnaround); solid renter incomes; 5,302 units permitted in Queens County in 2024 (4,918 in 5+ unit buildings).
- This rent runs 31% of the median local income ($89k/yr) — at the standard rent-burdened threshold; future hikes will face affordability resistance.
Forward outlook
- Local home prices are declining (-3.0%/yr); year-one equity from $2k of loan paydown is wiped out by about $8k of value loss. Plan a longer hold.
- Queens County population projected at +16% by 2050 — long-run rental-demand tailwind backs the buy-and-hold thesis.
Negotiation context
- It's been on market 28 days — a 2% lower offer ($266k) is reasonable based on typical stale-listing flexibility.
- 3 sale attempts since 8y ago with the ask held roughly flat each time — persistent listings suggest the price (not the market) is what's stuck; bring a comps-based counter.
- Current owner paid $210k; 29% above their basis — modest negotiation headroom, anchor on the comps not their cost.
Risks & watch-outs
- Watch-outs: built in 1955 — expect roof / HVAC / electrical / plumbing capex.
Questions for the listing agent
- What do current leases actually rent for vs. the listed asking? Can we see a recent rent roll and the last 12 months of T-12 income?
- Have any recent inspections been done? Can we get a copy of the seller's disclosures and any deferred-maintenance estimates?
- Built in 1955 — when were the roof, HVAC, electrical panel, plumbing, and water heater last replaced?
- Any open or pending special assessments — roof, HVAC, plumbing, elevator, façade? What's the per-unit balance and payoff schedule, and is the seller paying it off at close or rolling it to the buyer?
- Is there a deadline driving the sale (1031 exchange, divorce, estate, relocation)? That informs how much negotiation room exists.
- Schools are B-rated — typically a magnet for longer-tenancy family renters. What's the average tenant stay here, and is there a school-zone premium baked into asking?
- Crime grade is F in this area — have there been break-ins, vandalism, or insurance claims at this property in the last 3 years? What carrier currently insures it and at what premium?
- The area grade is low — what's the realistic commute time and amenity access for the typical tenant pool here? Any planned neighborhood developments (good or bad) we should know about?
- What's the average days-on-market for RENTAL listings here right now (not sales)? A rising rental-DOM trend means longer vacancies and softer asking-rent achievability than the comps imply.
- What's the recent tenant-quality profile in this submarket — average credit score on applications, eviction rate, late-payment / NSF rate, and stable-employment percentage? A property-management company in the area should have these aggregated.
- How much new apartment / multifamily construction is in the pipeline within 1–3 miles? Heavy new supply (>2% of stock underway) typically softens rents 12–24 months out; light construction supports rent growth.
Investment metrics
- 1% rule
- 0.86% ✗
- Cap rate
- 6.11%
- Cash-on-cash
- -0.67%
- DSCR
- 0.97
- GRM
- 9.7
CMA / ARV
No comps found within radius.
Projected returns pro-forma
-3.0% appreciation · 3.0% rent growth · sell at horizon
- IRR
- -17.4%
- Equity multiple
- 0.39×
- Total profit
- $-46,402
- Equity at exit
- $40,258
- IRR
- -9.4%
- Equity multiple
- 0.42×
- Total profit
- $-43,722
- Equity at exit
- $23,345
Cash invested: $75,600 (down + closing). Projections, not guarantees.
Landlord ↔ Tenant lean methodology
- Overall (CITY)
- 0 Strongly Tenant-Friendly
- State New York
- 15 Strongly Tenant-Friendly · D+10
- County
- — inherits STATE
- City New York
- 0 Strongly Tenant-Friendly · D+34
ZIP-level market 11427
- Active inventory
- 113
- Price-to-rent
- 9.7×
Monthly cashflow live
- Estimated rent
- $2,309 high interval (Pro) →
- Mortgage (P&I)
- −$1,416
- Tax est. 1.5%
- −$338 /mo · $4,050/yr
- Insurance
- −$112
- HOA
- −$0
- Vacancy / Maint / Mgmt
- −$485
- Net cashflow
- $-42
Break-even live
UW: 25.0% down · 7.5% · 30yr · 1.5% tax · 5.0% vac · 8.0% maint · 8.0% mgmt
Financing live
Cash to close
- Down payment
- $67,500
- Closing costs
- $8,100
- Reserves months
- —
- Total cash needed
- —
Loan-product check · same deal, 3 products live
Conventional
25% down · 7.5% · 30yr
- Down + closing
- —
- Monthly P&I
- —
- Monthly cashflow
- —
- DSCR
- —
- Eligible?
- —
Personal DTI + credit; lowest rate.
DSCR
20% down · 8.5% · 30yr
- Down + closing
- —
- Monthly P&I
- —
- Monthly cashflow
- —
- DSCR
- —
- Eligible?
- —
No personal income docs; deal must DSCR.
Hard money
10% down · 12.0% · 12mo
- Down + closing
- —
- Monthly P&I
- —
- Monthly cashflow
- —
- DSCR
- —
- Eligible?
- —
Short-term bridge; refi at stabilization.
Rent comps 7 comps
| Address | Beds | Baths | Sqft | Rent | $/sqft | DOM | Units | Dist |
|---|---|---|---|---|---|---|---|---|
| 8827 208th St Queens Village, NY | 1.0 | 1.0 | 640 | $1,900 | $2.97 | 24d | 1 | 1.11mi |
| 76-37 Commonwealth Blvd Unit 2 Jamaica, NY | 1.0 | 1.0 | 641 | $2,200 | $3.43 | 24d | 1 | 1.15mi |
| 214-83 Jamaica Ave Unit 2R Queens Village, NY | 1.0 | 1.0 | 650 | $2,100 | $3.23 | 24d | 1 | 1.17mi |
| 246-04 Jericho Tpke Unit 2 Bellerose, NY | 1.0 | 1.0 | 520 | $2,200 | $4.23 | 1d | 1 | 1.31mi |
| 248-15 89th Ave Unit 2nd Queens, NY | 1.0 | 1.0 | 700 | $2,200 | $3.14 | 1d | 1 | 1.44mi |
| 206-03 Jamaica Ave Unit 2ND Queens Village, NY | 1.0 | 1.0 | 630 | $2,696 | $4.28 | 24d | 1 | 1.47mi |
| 8737 Marengo St #1 Hollis, NY | 1.0 | 1.0 | 720 | $1,950 | $2.71 | 10d | 1 | 1.48mi |
HOA detail condo
- Monthly dues
- $0 · $0/yr
- Assessments
- None detected in remarks — confirm with the listing agent.
Listing history 22 events
-
2026-06-18days on market $270,000 Active 28 DOM
-
2026-06-17days on market $270,000 Active 27 DOM
-
2026-06-16days on market $270,000 Active 26 DOM
-
2026-06-15days on market $270,000 Active 25 DOM
-
2026-06-13days on market $270,000 Active 23 DOM
-
2026-06-10days on market $270,000 Active 19 DOM
-
2026-06-08days on market $270,000 Active 18 DOM
-
2026-06-08days on market $270,000 Active 17 DOM
-
2026-06-04days on market $270,000 Active 14 DOM
-
2026-06-03days on market $270,000 Active 13 DOM
-
2026-06-02days on market $270,000 Active 12 DOM
-
2026-06-01days on market $270,000 Active 11 DOM
-
2026-05-31days on market $270,000 Active 10 DOM
-
2026-05-22$270,000 Active
-
2026-05-18historical $270,000
-
2019-06-03soldstatus $210,000 Closed 208-char remark
Show marketing remark (208 chars)
Beautiful Large 2 Bedrooms With Large Dining Area, Upper Unit. Desirable Location. School District# 26. Close To Shops & Transportation., Additional information: Interior Features:Efficiency Kitchen,Lr/Dr
-
2019-01-18status Under Contract 208-char remark
Show marketing remark (208 chars)
Beautiful Large 2 Bedrooms With Large Dining Area, Upper Unit. Desirable Location. School District# 26. Close To Shops & Transportation., Additional information: Interior Features:Efficiency Kitchen,Lr/Dr
-
2018-12-06status Back On Market 208-char remark
Show marketing remark (208 chars)
Beautiful Large 2 Bedrooms With Large Dining Area, Upper Unit. Desirable Location. School District# 26. Close To Shops & Transportation., Additional information: Interior Features:Efficiency Kitchen,Lr/Dr
-
2018-09-07status Under Contract 208-char remark
Show marketing remark (208 chars)
Beautiful Large 2 Bedrooms With Large Dining Area, Upper Unit. Desirable Location. School District# 26. Close To Shops & Transportation., Additional information: Interior Features:Efficiency Kitchen,Lr/Dr
-
2018-09-05price $208,000 208-char remark
Show marketing remark (208 chars)
Beautiful Large 2 Bedrooms With Large Dining Area, Upper Unit. Desirable Location. School District# 26. Close To Shops & Transportation., Additional information: Interior Features:Efficiency Kitchen,Lr/Dr
-
2018-06-27price $200,000 208-char remark
Show marketing remark (208 chars)
Beautiful Large 2 Bedrooms With Large Dining Area, Upper Unit. Desirable Location. School District# 26. Close To Shops & Transportation., Additional information: Interior Features:Efficiency Kitchen,Lr/Dr
-
2018-06-27$20,000 New 208-char remark
Show marketing remark (208 chars)
Beautiful Large 2 Bedrooms With Large Dining Area, Upper Unit. Desirable Location. School District# 26. Close To Shops & Transportation., Additional information: Interior Features:Efficiency Kitchen,Lr/Dr
ⓘ Source: listings_history table (triggers on properties + properties_extension) + one-shot
backfill from property_details.listing_events for pre-trigger history.
Nearby sold comps map
Loading sold comps map…
Walkable amenities ~0.75 mi
Loading nearby amenities…
Taxation est. · year 1
- Rental income
- $27,702
- − Mortgage interest
- −$15,124
- − Property taxes
- −$4,050
- − Insurance
- −$1,350
- − Repairs & maintenance
- −$2,216
- − Management
- −$2,216
- − Depreciation
- −$7,855
- Taxable loss
- −$5,109
- Est. tax savings @ 24.0%
- +$1,226
- After-tax cash flow
- $720/yr
For passive investors: Depreciation is non-cash, so a rental often shows a tax loss while cash-flowing — sheltering income. Rental losses are passive: they offset passive income freely, and up to $25,000/yr can offset ordinary (W-2) income if you actively participate and your MAGI is under $100k (phasing out to $0 by $150k); unused losses carry forward. On sale, claimed depreciation is recaptured at up to 25%, and gains may owe capital-gains tax (a 1031 exchange can defer both). Figures are a year-1 estimate at your 24.0% rate — not tax advice; consult a CPA.
Condition & rehab AI · 6 photos
This 2-bedroom condo requires moderate repairs and maintenance, particularly in the kitchen and interior walls. Painting and updating the kitchen appliances would significantly enhance its value.
Repairs flagged
- Major kitchen appliances — No major appliances
- Minor paint — Some wear on walls
Value-add opportunities
- Both paint interior walls — Fresh paint enhances curb appeal and interior aesthetics
- Both install modern kitchen appliances — Modern appliances improve functionality and appeal
- Both repair/replace air conditioning unit — A functional AC is essential for comfort and energy efficiency
Renovation cost estimate screening
| Repair item | Severity | Est. cost |
|---|---|---|
| kitchen appliances · No major appliances | Major | $15,000–50,000 |
| paint · Some wear on walls | Minor | $500–3,000 |
| Total estimated repair cost · 2 items | $15,500–53,000 |
Value-add ROI direction
- Both paint interior walls — Fresh paint enhances curb appeal and interior aesthetics ↑
- Both install modern kitchen appliances — Modern appliances improve functionality and appeal ↑
- Both repair/replace air conditioning unit — A functional AC is essential for comfort and energy efficiency ↑
ⓘ Cost ranges are severity-bucket heuristics (US national rule-of-thumb). Get contractor quotes + a written scope before underwriting a rehab budget.
Schools (NCES district)
No district data.
Livability — New York
- Score
- 75/100
- State rank
- #268
- US rank
- #4188
Category grades
Schools grade is shown separately in the Schools card above.
Census & demographics
- Census place
- New York, NY
- County
- Queens County · 1,914,869 people
- City population
- 7,731,280
- Metro
- New York-Newark-Jersey City, NY-NJ-PA
- Population (ZIP)
- 24,607
- Household income
- $88,980
- Rent vs Own
- Severe rent burden
- 811.0
Population outlook (Queens County) Hauer SSP2
- Today (2025)
- 2,546,320 people
- By 2030
- 2,643,059 · +3.8%
- By 2040
- 2,815,563 · +10.6%
- By 2050
- 2,944,423 · +15.6%
- By 2075
- 3,123,338 · +22.7%
- By 2100
- 3,098,688 · +21.7%
Race, ethnicity, and origin ACS 2023
- Neighborhood character
- Highly diverse neighborhood (Simpson 0.77)
- Race & ethnicity
- Asian 37% Black 22% Hispanic / Latino 17% White 14% Two or more races 11%
- Hispanic origin (detail)
- Puerto Rican 3% Dominican 2%
- Common ancestry
- Hispanic 5% Scotch-Irish 2% Romanian 1%
- Foreign-born
- 51% · Canada, China, Jamaica
- Languages at home
- 49% English-only · Other Indo-European 16% Spanish 14% Tagalog/Filipino 5%
Political lean MEDSL · Queens
- 2024 margin
- Strong D (+24.6) · D 62.3% · R 37.7%
- 2008→2024 swing
- -26.2pp toward R · 2008: 50.8pp · 2024: 24.6pp
- All cycles
- 2024: D+24.6 2020: D+45.2 2016: D+53.4 2012: D+58.5 2008: D+50.8
Not yet ingested
- Civics
- —
Market trends
- HPI YoY
- ▼ -436.66%
- Current HPI
- 297.7969
- Rent YoY
- —
- Metro
- New York-Newark-Jersey City, NY-NJ-PA
- State GDP YoY
- ▲ 2.60%
- F500 in state
- 92
Industry mix (Fortune 500 HQ in NY)
| Industry | F500 HQs | Revenue |
|---|---|---|
| Financial Services | 10 | $950B |
|
||
| Consumer Goods | 9 | $162B |
|
||
| Insurance | 4 | $225B |
|
||
| Telecommunications | 2 | $144B |
|
||
| Pharmaceuticals | 2 | $112B |
|
||
| Media / Entertainment | 2 | $69B |
|
||
Price history
+1250.0% since first listed9 events — show timeline
- 2026-05-22 Listed $270,000 OneKey® MLS as Distributed by MLS Grid
- 2026-05-18 Coming Soon $270,000 OneKey® MLS as Distributed by MLS Grid
- 2019-06-03 Sold (MLS) $210,000 OneKey® MLS as Distributed by MLS Grid
- 2019-01-18 Pending — OneKey® MLS as Distributed by MLS Grid
- 2018-12-06 Relisted — OneKey® MLS as Distributed by MLS Grid
- 2018-09-07 Pending — OneKey® MLS as Distributed by MLS Grid
- 2018-09-05 Price Changed $208,000 OneKey® MLS as Distributed by MLS Grid
- 2018-06-27 Price Changed $200,000 OneKey® MLS as Distributed by MLS Grid
- 2018-06-27 Listed $20,000 OneKey® MLS as Distributed by MLS Grid
Cash-flow waterfall
monthlySold comps — $/sqft
last 12 mo · ≤1 miLoading sold comps…