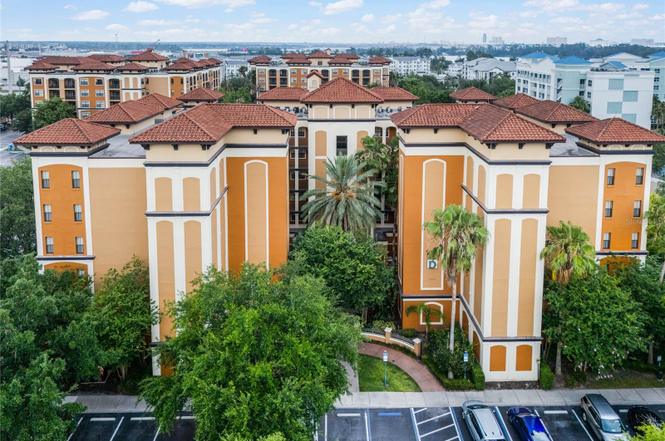
12539 Floridays Resort Dr Unit 305-D · Williamsburg, FL
Flood risk No data
- FEMA flood zone
- —
- Chance of flooding over 30 yrs
- —
- Est. flood insurance / yr
- —
Fire risk No data
- Est. fire insurance / yr
- —
Heat risk No data
- Hot days now (above threshold)
- —
- Hot days in 30 yrs
- —
Wind risk No data
- Chance of severe wind over 30 yrs
- —
Air-quality risk No data
- Unhealthy air days now
- —
- Unhealthy air days in 30 yrs
- —
Risk factors via First Street. Map © Google.
Why this score? — see what drove the D grade
The composite is a weighted blend of 9 inputs, each scored 0–100. Each bar is that input's sub-score; the figure is the points it added to the 100-point composite (weight × sub-score).
- 1% rule +7.8/10.0
- ARV discount +7.5/15.0
- Cash flow +6.6/30.0
- Appreciation +5.1/10.0
- Livability +4.2/5.0
- Schools +4.1/10.0
- Condition / age +2.5/5.0
- Rent growth +1.7/5.0
- DSCR +0.9/10.0
$170,000
🖨 Deal sheet 📄 Offer letter ✓ Due diligence
Listing remarks
Discover this incredible opportunity at Floridays Orlando Resort with this exquisite 2-bedroom, 2-bathroom unit in building D on the third floor, offering breathtaking water and pool views. This fully furnished property is perfect for short-term rentals or as a second home. With its prime location just minutes from Walt Disney World, Universal Orlando Resort, and other top attractions, this turnkey investment with on-site property management is a dream come true. Don't miss out on this fantastic unit - act fast!
Key facts
- Water and pool views
- Turnkey investment
- $821 HOA
Tags
Property features AI
Finance
- Financial info: Total annual fees: $9,863.04; Lease restrictions apply
- HOA & community: HOA managed by Paramont Hospitality Management; Monthly association fee of $821.92 (includes cable TV, electricity, internet, and grounds maintenance); Fitness center and community pool; Sidewalks throughout community; Pets allowed with restrictions (breed, number, size; max 25 lb)
Exterior
- Parking: Open parking
- Utilities: Public water; Public sewer; Cable available; High-speed internet available; Electricity available; Phone available
- Home design: Condo - Hotel; Residential property; West-facing; Single-level unit on 3rd floor (building has 6 stories)
- Construction: Block and stucco construction; Other roof; Slab foundation; Building D
- Exterior features: Sidewalk; Pond view
Interior
- Kitchen: Dishwasher; Range; Microwave; Refrigerator
- Bedrooms: 2 bedrooms
- Flooring: Carpet; Tile; Vinyl
- Bathrooms: 2 full bathrooms
- Heating & cooling: Central heating (electric); Central air conditioning
- Interior features: Ceiling fans
- Laundry & utility: Washer; Dryer; Laundry closet
Neighborhood map
What this means for you Summary
Snapshot
- This is a 2-bed/2.0-bath condo listed at $170k.
Deal economics
- At list price, monthly cash flow is $-277 ($-3k/yr) — negative.
- To cash-flow at today's rent, offer at most $130k (23.6% below list).
- Meets the 1% rule at list price ($2k rent vs $170k).
- Recommended offer: $130k (23.6% below list) — sets the bar for cash-flow.
Location & tenants
- Location reads 85/100 on livability (#29 in FL, #608 nationally) — a professional / high-income tenant draw. Strengths: housing A+, health & safety A+, crime A; Watch: amenities D, schools F.
- Orange (suburban): math 46% / reading 51% proficiency, ranked #43 of 73 in FL (top 59%) — families likely to look elsewhere, expect single-tenant / working-renter base with shorter leases.
- Market conditions: Rents falling (-3.2%/yr); 275 active listings in the ZIP; 40 comparable units currently listed for rent nearby; rentals leasing fast (median 5d on market — plan ~1-2 weeks tenant-placement turnaround); 8,053 units permitted in Orange County in 2024 (3,133 in 5+ unit buildings).
- This rent runs 38% of the median local income ($69k/yr) — at the standard rent-burdened threshold; future hikes will face affordability resistance.
Forward outlook
- In year one you build about $2k of equity ($1k loan paydown + $505 appreciation (0.3% local appreciation)).
- Orange County population projected at +52% by 2050 — long-run rental-demand tailwind backs the buy-and-hold thesis.
Negotiation context
- It's been on market 757 days — a 12% lower offer ($150k) is reasonable based on typical stale-listing flexibility.
- 3 sale attempts since 19y ago; this cycle's ask has dropped $75k (31%) from the opening price — seller is motivated, your offer sets the floor, not the list.
Risks & watch-outs
- Watch-outs: HOA is 38% of rent.
Questions for the listing agent
- What do current leases actually rent for vs. the listed asking? Can we see a recent rent roll and the last 12 months of T-12 income?
- It's been on market 757 days. Have you received any prior offers? Is the seller open to a 24% concession, seller financing, or rate buy-down credit?
- What does the HOA fee cover, when was the last increase, and are there any pending special assessments or reserve-fund shortfalls?
- Any open or pending special assessments — roof, HVAC, plumbing, elevator, façade? What's the per-unit balance and payoff schedule, and is the seller paying it off at close or rolling it to the buyer?
- Why hasn't it sold? Are there any deal-killer items the seller is aware of (foundation, flood, title, zoning, code violations)?
- Is there a deadline driving the sale (1031 exchange, divorce, estate, relocation)? That informs how much negotiation room exists.
- Schools are F-rated, which usually means shorter tenancies and higher turnover. Who's the typical renter profile here, and what's been the actual vacancy rate?
- The area grade is low — what's the realistic commute time and amenity access for the typical tenant pool here? Any planned neighborhood developments (good or bad) we should know about?
- What's the average days-on-market for RENTAL listings here right now (not sales)? A rising rental-DOM trend means longer vacancies and softer asking-rent achievability than the comps imply.
- What's the recent tenant-quality profile in this submarket — average credit score on applications, eviction rate, late-payment / NSF rate, and stable-employment percentage? A property-management company in the area should have these aggregated.
- How much new apartment / multifamily construction is in the pipeline within 1–3 miles? Heavy new supply (>2% of stock underway) typically softens rents 12–24 months out; light construction supports rent growth.
Investment metrics
- 1% rule
- 1.28% ✓
- Cap rate
- 4.34%
- Cash-on-cash
- -6.99%
- DSCR
- 0.69
- GRM
- 6.5
CMA / ARV
No comps found within radius.
Projected returns pro-forma
0.3% appreciation · 0.0% rent growth · sell at horizon
- IRR
- -11.8%
- Equity multiple
- 0.45×
- Total profit
- $-26,077
- Equity at exit
- $51,901
- IRR
- -9.0%
- Equity multiple
- 0.10×
- Total profit
- $-42,861
- Equity at exit
- $64,450
Cash invested: $47,600 (down + closing). Projections, not guarantees.
Landlord ↔ Tenant lean methodology
- Overall (STATE)
- 87 Strongly Landlord-Friendly
- State Florida
- 87 Strongly Landlord-Friendly · R+3
- County
- — inherits STATE
- City
- — inherits STATE
ZIP-level market 32821
- Home prices YoY
- 0.1%
- Rents YoY
- -3.2%
- Active inventory
- 275
- Price-to-rent
- 6.5×
Monthly cashflow live
- Estimated rent
- $2,176 high interval (Pro) →
- Mortgage (P&I)
- −$891
- Tax est. 1.5%
- −$212 /mo · $2,550/yr
- Insurance
- −$71
- HOA
- −$821
- Vacancy / Maint / Mgmt
- −$457
- Net cashflow
- $-277
Break-even live
UW: 25.0% down · 7.5% · 30yr · 1.5% tax · 5.0% vac · 8.0% maint · 8.0% mgmt
Financing live
Cash to close
- Down payment
- $42,500
- Closing costs
- $5,100
- Reserves months
- —
- Total cash needed
- —
Loan-product check · same deal, 3 products live
Conventional
25% down · 7.5% · 30yr
- Down + closing
- —
- Monthly P&I
- —
- Monthly cashflow
- —
- DSCR
- —
- Eligible?
- —
Personal DTI + credit; lowest rate.
DSCR
20% down · 8.5% · 30yr
- Down + closing
- —
- Monthly P&I
- —
- Monthly cashflow
- —
- DSCR
- —
- Eligible?
- —
No personal income docs; deal must DSCR.
Hard money
10% down · 12.0% · 12mo
- Down + closing
- —
- Monthly P&I
- —
- Monthly cashflow
- —
- DSCR
- —
- Eligible?
- —
Short-term bridge; refi at stabilization.
Rent comps 40 comps
| Address | Beds | Baths | Sqft | Rent | $/sqft | DOM | Units | Dist |
|---|---|---|---|---|---|---|---|---|
| 7511 Solstice Cir Orlando, FL | 3.0 | 1.0–2.0 | 1168 | $2,527 | $2.16 | 3d | 36 | 0.21mi |
| 10535 Hamilton Dawn St Orlando, FL | 1.0–2.0 | 1.0–2.0 | 936 | $2,642 | $2.82 | 3d | 22 | 0.21mi |
| 6260 Juniper Pine Way Orlando, FL | 1.0–3.0 | 1.0–2.0 | 1094 | $2,492 | $2.28 | 3d | 32 | 0.25mi |
| 12515 Lake Square Cir Orlando, FL | 1.0–3.0 | 1.0–2.0 | 1087 | $3,022 | $2.78 | 2d | 21 | 0.35mi |
| 11115 S Beach Cir Orlando, FL | 1.0–3.0 | 1.0–2.0 | 1116 | $2,422 | $2.17 | 2d | 50 | 0.47mi |
| 11562 Westwood Blvd Orlando, FL | 1.0–2.0 | 1.0–2.0 | 933 | $2,400 | $2.57 | 8d | 2 | 0.54mi |
| 11562 Westwood Blvd #934 Orlando, FL | 1.0 | 1.0 | 800 | $2,400 | $3.00 | 24d | 1 | 0.54mi |
| 6800 Villa de Costa Dr Orlando, FL | 2.0 | 2.0 | 960 | $1,899 | $1.98 | 2d | 6 | 0.56mi |
| 11568 Westwood Blvd #1021 Orlando, FL | 2.0 | 2.0 | 1067 | $1,775 | $1.66 | 18d | 1 | 0.57mi |
| 11574 Westwood Blvd #1134 Orlando, FL | 1.0 | 1.0 | 754 | $1,200 | $1.59 | 24d | 1 | 0.62mi |
| 6739 Mission Club Blvd Orlando, FL | 1.0–3.0 | 1.0–2.0 | 947 | $1,652 | $1.74 | 2d | 24 | 0.63mi |
| 10000 Palma Linda Way Orlando, FL | 1.0–3.0 | 1.0–2.0 | 1130 | $2,464 | $2.18 | 2d | 1 | 0.63mi |
| 11532 Westwood Blvd #628 Orlando, FL | 2.0 | 2.0 | 1100 | $3,000 | $2.73 | 24d | 1 | 0.63mi |
| 12843 Madison Pointe Cir #107 Orlando, FL | 2.0 | 2.0 | 1107 | $2,100 | $1.90 | 24d | 1 | 0.65mi |
| 11582 Westwood Blvd Orlando, FL | 1.0 | 1.0 | 754 | $1,374 | $1.82 | 24d | 2 | 0.65mi |
| 11520 Westwood Blvd Orlando, FL | 2.0 | 2.0 | 1000 | $3,000 | $3.00 | 24d | 1 | 0.65mi |
| 11520 Westwood Blvd Orlando, FL | 2.0 | 2.0 | 985 | $2,450 | $2.49 | 8d | 2 | 0.65mi |
| 12024 Meadow Bend Loop Orlando, FL | 1.0–3.0 | 1.0–2.0 | 1058 | $1,962 | $1.85 | 24d | 31 | 0.66mi |
| 12806 Madison Pointe Cir Orlando, FL | 1.0–3.0 | 1.0–2.0 | 1027 | $1,859 | $1.81 | 2d | 16 | 0.66mi |
| 11508 Westwood Blvd #313 Orlando, FL | 1.0 | 1.0 | 715 | $2,800 | $3.92 | 24d | 1 | 0.68mi |
| 11588 Westwood Blvd #1514 Orlando, FL | 1.0 | 1.0 | 800 | $2,400 | $3.00 | 24d | 1 | 0.68mi |
| 6902 Villa De Costa Dr Orlando, FL | 2.0 | 2.0 | 738 | $1,600 | $2.17 | 14d | 1 | 0.69mi |
| 11538 Westwood Blvd #218 Orlando, FL | 2.0 | 2.0 | 1100 | $3,000 | $2.73 | 24d | 1 | 0.70mi |
| 11544 Westwood Blvd #1311 Orlando, FL | 2.0 | 2.0 | 971 | $1,750 | $1.80 | 24d | 1 | 0.70mi |
| 11128 Grande Pines Cir Orlando, FL | 1.0–3.0 | 1.0–2.0 | 1049 | $2,019 | $1.92 | 2d | 16 | 0.72mi |
| 11128 Grande Pines Cir Orlando, FL | 1.0–3.0 | 1.0–2.0 | 1049 | $2,053 | $1.96 | 15d | 19 | 0.72mi |
| 12861 Madison Pointe Cir #106 Orlando, FL | 1.0 | 1.0 | 696 | $1,399 | $2.01 | 3d | 1 | 0.74mi |
| 8024 Cumberland Park Dr Orlando, FL | 1.0–3.0 | 1.0–2.0 | 989 | $1,804 | $1.82 | 2d | 48 | 0.74mi |
| 12914 Penn Station Ct #101 Orlando, FL | 2.0 | 2.0 | 1090 | $1,995 | $1.83 | 24d | 1 | 0.77mi |
| 11833 Westwood Blvd Orlando, FL | 1.0–3.0 | 1.0–2.0 | 1085 | $2,229 | $2.05 | 2d | 11 | 0.85mi |
| 8150 Chatham Manor Blvd Orlando, FL | 1.0–4.0 | 1.0–3.0 | 1180 | $1,977 | $1.67 | 20d | 25 | 0.89mi |
| 8151 Patterson Woods Dr Orlando, FL | 1.0–3.0 | 1.0–3.0 | 1119 | $2,124 | $1.90 | 2d | 17 | 0.90mi |
| 6600 Banner Lake Cir Orlando, FL | 1.0–3.0 | 1.0–2.0 | 975 | $1,824 | $1.87 | 2d | 18 | 0.91mi |
| 9950 Elan Cir Orlando, FL | 1.0–3.0 | 1.0–2.0 | 1032 | $2,173 | $2.11 | 2d | 20 | 1.23mi |
| 10107 Ancora Cir Orlando, FL | 1.0–3.0 | 1.0–2.0 | 1091 | $2,102 | $1.93 | 3d | 23 | 1.25mi |
| 6820 Axis West Cir Orlando, FL | 1.0–3.0 | 1.0–2.0 | 1033 | $2,343 | $2.27 | 2d | 18 | 1.25mi |
| 12035 Cypress Run Dr Orlando, FL | 2.0 | 2.0 | 797 | $1,599 | $2.01 | 4d | 5 | 1.29mi |
| 7118 Altis Way Orlando, FL | 1.0–3.0 | 1.0–2.0 | 1119 | $2,112 | $1.89 | 2d | 20 | 1.35mi |
| 6801 Integra Cove Blvd Orlando, FL | 3.0 | 1.0–2.0 | 966 | $2,251 | $2.33 | 3d | 30 | 1.37mi |
| 6000 Paradiso Grande Blvd Orlando, FL | 1.0–3.0 | 1.0–2.0 | 1305 | $2,836 | $2.17 | 8d | 21 | 1.45mi |
HOA detail condo
- Monthly dues
- $821 · $9,852/yr
- Likely covers
- waterpool
- Assessments
- None detected in remarks — confirm with the listing agent.
Listing history 20 events
-
2026-06-18days on market $170,000 Active 757 DOM
-
2026-06-17days on market $170,000 Active 756 DOM
-
2026-06-16days on market $170,000 Active 755 DOM
-
2026-06-15days on market $170,000 Active 754 DOM
-
2026-06-13days on market $170,000 Active 752 DOM
-
2026-06-13pricedays on market $170,000 Active 751 DOM
-
2026-06-09days on market $200,000 Active 748 DOM
-
2026-06-08days on market $200,000 Active 747 DOM
-
2026-06-07days on market $200,000 Active 746 DOM
-
2026-06-04days on market $200,000 Active 743 DOM
-
2026-06-03days on market $200,000 Active 742 DOM
-
2026-06-02days on market $200,000 Active 741 DOM
-
2026-06-02days on market $200,000 Active 740 DOM
-
2026-05-31days on market $200,000 Active 739 DOM
-
2026-01-20price $200,000
-
2025-07-07price $215,000
-
2024-05-22$244,900 Active
-
2008-10-10historical
-
2008-04-30$274,900
-
2007-01-17$274,900
ⓘ Source: listings_history table (triggers on properties + properties_extension) + one-shot
backfill from property_details.listing_events for pre-trigger history.
Nearby sold comps map
Loading sold comps map…
Walkable amenities ~0.75 mi
Loading nearby amenities…
Taxation est. · year 1
- Rental income
- $26,107
- − Mortgage interest
- −$9,523
- − Property taxes
- −$2,550
- − Insurance
- −$850
- − Repairs & maintenance
- −$2,089
- − Management
- −$2,089
- − HOA
- −$9,852
- − Depreciation
- −$4,945
- Taxable loss
- −$5,790
- Est. tax savings @ 24.0%
- +$1,390
- After-tax cash flow
- $-1,936/yr
For passive investors: Depreciation is non-cash, so a rental often shows a tax loss while cash-flowing — sheltering income. Rental losses are passive: they offset passive income freely, and up to $25,000/yr can offset ordinary (W-2) income if you actively participate and your MAGI is under $100k (phasing out to $0 by $150k); unused losses carry forward. On sale, claimed depreciation is recaptured at up to 25%, and gains may owe capital-gains tax (a 1031 exchange can defer both). Figures are a year-1 estimate at your 24.0% rate — not tax advice; consult a CPA.
Schools (NCES district)
- District
- Orange
- NCES district ID
- 1201440
- Math proficiency
- 46% ▼ -9.00%
- Reading proficiency
- 51% ▼ -2.00%
- Median HH income
- $49,350
- Composite
- 41.47/100
- National rank
- #3461
- State rank
- #43 of 73 in FL
Livability — Williamsburg
- Score
- 85/100
- State rank
- #29
- US rank
- #608
Category grades
Schools grade is shown separately in the Schools card above.
Census & demographics
- County
- Orange County · 1,471,359 people
- Metro
- Orlando-Kissimmee-Sanford, FL
- Population (ZIP)
- 26,161
- Household income
- $69,348
- Rent vs Own
- Severe rent burden
- 1840.0
Population outlook (Orange County) Hauer SSP2
- Today (2025)
- 1,618,226 people
- By 2030
- 1,787,404 · +10.5%
- By 2040
- 2,125,621 · +31.4%
- By 2050
- 2,454,016 · +51.6%
- By 2075
- 3,173,711 · +96.1%
- By 2100
- 3,607,781 · +122.9%
Race, ethnicity, and origin ACS 2023
- Neighborhood character
- Diverse neighborhood (Simpson 0.65)
- Race & ethnicity
- White 43% Hispanic / Latino 41% Two or more races 19% Black 6% Asian 3% Pacific Islander 1% Native American 1%
- Hispanic origin (detail)
- Mexican 3% Puerto Rican 11% Cuban 1% Dominican 4%
- Common ancestry
- Romanian 3% Lithuanian 2% Estonian 2%
- Foreign-born
- 29% · Canada, Jamaica, China
- Languages at home
- 58% English-only · Spanish 32% Other Indo-European 4% Other Asian/Pacific 2%
Political lean MEDSL · Orange
- 2024 margin
- D (+13.6) · D 56.1% · R 42.5% · Other 1.3%
- 2008→2024 swing
- -5.0pp toward R · 2008: 18.6pp · 2024: 13.6pp
- All cycles
- 2024: D+13.6 2020: D+23.1 2016: D+24.6 2012: D+18.2 2008: D+18.6
Not yet ingested
- Civics
- —
Market trends
- HPI YoY
- ▲ 0.30%
- Current HPI
- 300.2268
- Rent YoY
- ▼ -3.20%
- Metro
- Orlando-Kissimmee-Sanford, FL
- State GDP YoY
- ▲ 3.28%
- F500 in state
- 36
Industry mix (Fortune 500 HQ in FL)
| Industry | F500 HQs | Revenue |
|---|---|---|
| Industrial Technology | 2 | $29B |
|
||
| Insurance | 2 | $17B |
|
||
| Retail | 1 | $60B |
|
||
| Technology Distribution | 1 | $58B |
|
||
| Homebuilding | 1 | $35B |
|
||
| Technology Manufacturing | 1 | $35B |
|
||
Price history
-27.2% since first listed6 events — show timeline
- 2026-01-20 Price Changed $200,000 Stellar MLS as Distributed by MLS Grid
- 2025-07-07 Price Changed $215,000 Stellar MLS as Distributed by MLS Grid
- 2024-05-22 Listed $244,900 Stellar MLS as Distributed by MLS Grid
- 2008-10-10 Listing Removed — Stellar MLS as Distributed by MLS Grid
- 2008-04-30 Listed $274,900 Stellar MLS as Distributed by MLS Grid
- 2007-01-17 Listed $274,900 Stellar MLS as Distributed by MLS Grid
Cash-flow waterfall
monthlySold comps — $/sqft
last 12 mo · ≤1 miLoading sold comps…