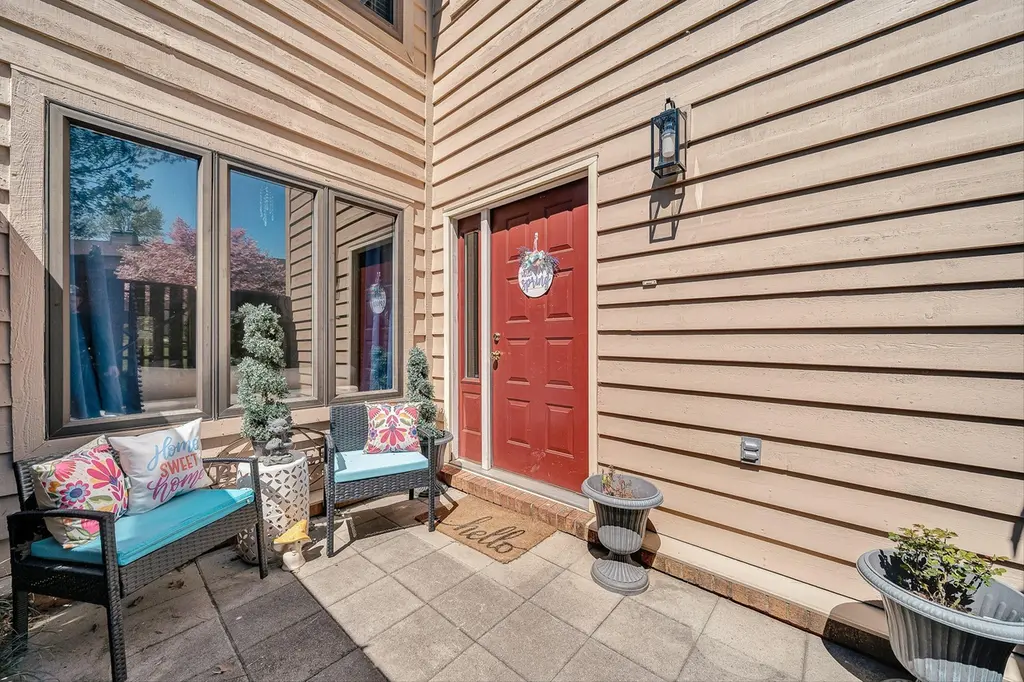
106 Windward Dr SW #106 · Roanoke, VA
Flood risk 1/10 · Minimal
- FEMA flood zone
- X (unshaded)
- Chance of flooding over 30 yrs
- 0.0%
- Est. flood insurance / yr
- $473 – $860
Fire risk 3/10 · Minor
- Est. fire insurance / yr
- $666 – $1,236
Heat risk 5/10 · Moderate
- Hot days now (above 99°F)
- 7 days/yr
- Hot days in 30 yrs
- 20 days/yr
Wind risk 2/10 · Minimal
- Chance of severe wind over 30 yrs
- 1.0%
Air-quality risk 2/10 · Minimal
- Unhealthy air days now
- 0 days/yr
- Unhealthy air days in 30 yrs
- 1 days/yr
Risk factors via First Street. Map © Google.
Why this score? — see what drove the F grade
The composite is a weighted blend of 9 inputs, each scored 0–100. Each bar is that input's sub-score; the figure is the points it added to the 100-point composite (weight × sub-score).
- ARV discount +9.4/15.0
- Schools +4.1/10.0
- Livability +3.7/5.0
- Rent growth +3.2/5.0
- Condition / age +2.5/5.0
- Cash flow +1.7/30.0
- 1% rule +0.2/10.0
- DSCR +0.0/10.0
- Appreciation +0.0/10.0
$297,500
🖨 Deal sheet 📄 Offer letter ✓ Due diligence
Listing remarks MLS
Updated end unit townhouse with 2192 Sq Ft of finished space, finished basement has a separate kitchen, fireplaced, bedroom and full bath. Covered deck that walks out to the side yard, new stainless appliances, Gas log fireplace and tons of storage. Private patio entrance. Currently tenant occupied and not available until June 1
Key facts
- $531 HOA
- Community pool
- Built 1983
Neighborhood map
What this means for you Summary
Snapshot
- This is a 3-bed/3.0-bath townhouse listed at $298k.
Deal economics
- At list price, monthly cash flow is $-1k ($-14k/yr) — negative.
- To cash-flow at today's rent, offer at most $97k (67.3% below list).
- To meet the 1% rule (rent ≥ 1% of price), the offer needs to be $155k (48.0% below list).
- Recommended offer: $97k (67.3% below list) — sets the bar for cash-flow.
- Cap rate 1.7% vs local median 4.2% in Roanoke — below-typical yield; the buyer is paying a premium for something (appreciation thesis, condition, location) that the cap rate doesn't capture.
Location & tenants
- Location reads 73/100 on livability (#163 in VA) — a middle-class / working-renter tenant base. Strengths: cost of living A+, health & safety A+, housing A; Watch: amenities C-, employment D, crime F.
- Roanoke City Public School District (urban): math 40% / reading 58% proficiency, ranked #102 of 131 in VA (top 78%) — families likely to look elsewhere, expect single-tenant / working-renter base with shorter leases; 67% free/reduced lunch — lower-income household profile, screen leases tightly.
- Market conditions: Rents rising (+2.9%/yr); 333 active listings in the ZIP; 26 comparable units currently listed for rent nearby; rentals at typical pace (median 21d on market — plan ~3-4 weeks tenant-placement turnaround); 42% of comp listings sitting > 30 days — soft ceiling on asking rent; solid renter incomes; 113 units permitted in Roanoke city in 2024 (0 in 5+ unit buildings).
Forward outlook
- Local home prices are declining (-3.0%/yr); year-one equity from $2k of loan paydown is wiped out by about $9k of value loss. Plan a longer hold.
- Roanoke County population projected at +11% by 2050 — modest demand growth; plan on rents tracking national, not racing it.
Negotiation context
- It's been on market 69 days — a 6% lower offer ($280k) is reasonable based on typical stale-listing flexibility.
- 9 sale attempts since 26y ago; this cycle's ask has dropped $38k (11%) from the opening price — seller is motivated, your offer sets the floor, not the list.
- Current owner paid $215k; 38% above their basis — modest negotiation headroom, anchor on the comps not their cost.
Risks & watch-outs
- Watch-outs: HOA is 34% of rent.
- Climate carrying-cost: extreme-heat days projected 7→20/yr by 2055 (HVAC capex compounding) — expect insurance premiums to compound above CPI over the hold.
Questions for the listing agent
- What do current leases actually rent for vs. the listed asking? Can we see a recent rent roll and the last 12 months of T-12 income?
- It's been on market 69 days. Have you received any prior offers? Is the seller open to a 67% concession, seller financing, or rate buy-down credit?
- What does the HOA fee cover, when was the last increase, and are there any pending special assessments or reserve-fund shortfalls?
- Why hasn't it sold? Are there any deal-killer items the seller is aware of (foundation, flood, title, zoning, code violations)?
- Is there a deadline driving the sale (1031 exchange, divorce, estate, relocation)? That informs how much negotiation room exists.
- Schools are A-rated — typically a magnet for longer-tenancy family renters. What's the average tenant stay here, and is there a school-zone premium baked into asking?
- Crime grade is F in this area — have there been break-ins, vandalism, or insurance claims at this property in the last 3 years? What carrier currently insures it and at what premium?
- The area grade is low — what's the realistic commute time and amenity access for the typical tenant pool here? Any planned neighborhood developments (good or bad) we should know about?
- What's the average days-on-market for RENTAL listings here right now (not sales)? A rising rental-DOM trend means longer vacancies and softer asking-rent achievability than the comps imply.
- What's the recent tenant-quality profile in this submarket — average credit score on applications, eviction rate, late-payment / NSF rate, and stable-employment percentage? A property-management company in the area should have these aggregated.
- How much new for-sale + rental construction is in the pipeline within 1–3 miles? Heavy new supply typically softens prices + rents 12–24 months out; constrained supply supports both.
Investment metrics
- 1% rule
- 0.52% ✗
- Cap rate
- 1.72%
- Cash-on-cash
- -16.33%
- DSCR
- 0.27
- GRM
- 16.0
CMA / ARV
- ARV (median comp)
- $310,483
- List price
- $297,500
- Delta
- -4.18%
- Verdict
- FAIR
- Comps
- 20 within 1.0 mi
Show comp detail 5 sales within ~0.75 mi
| Address | Dist | Beds/Ba | Sqft | Sold | Price | $/sf | Match |
|---|---|---|---|---|---|---|---|
| 409 Windward Dr SW #409 | 0.08mi | 2/2.0 (-1) | 1,131 (+3%) | 16mo | $240,000 | $212 | 69 |
| 127 Windward Dr SW #127 | 0.02mi | 2/2.0 (-1) | 1,188 (+8%) | 10mo | $155,000 | $130 | 68 |
| 203 Windward Dr SW | 0.06mi | 2/2.0 (-1) | 1,125 (+3%) | 23mo | $258,500 | $230 | 64 |
| 408 Windward Dr SW | 0.08mi | 2/2.0 (-1) | 1,131 (+3%) | 24mo | $240,000 | $212 | 62 |
| 3621 Timberline Trl | 0.49mi | 2/2.0 (-1) | 1,000 (-9%) | 6mo | $175,000 | $175 | 49 |
Match score weights: distance 35% · size 25% · config 20% · recency 20%. Top-matched comps best support the ARV.
Projected returns pro-forma
-3.0% appreciation · 2.88% rent growth · sell at horizon
- IRR
- -48.3%
- Equity multiple
- -0.45×
- Total profit
- $-120,394
- Equity at exit
- $44,358
- IRR
- -93.4%
- Equity multiple
- -1.37×
- Total profit
- $-197,737
- Equity at exit
- $25,722
Cash invested: $83,300 (down + closing). Projections, not guarantees.
Landlord ↔ Tenant lean methodology
- Overall (STATE)
- 55 Moderately Landlord-Leaning
- State Virginia
- 55 Moderately Landlord-Leaning · D+2
- County
- — inherits STATE
- City
- — inherits STATE
ZIP-level market 24018
- Rents YoY
- 2.9%
- Active inventory
- 333
- Price-to-rent
- 16.0×
Monthly cashflow live
- Estimated rent
- $1,546 high interval (Pro) →
- Mortgage (P&I)
- −$1,560
- Tax from tax record
- −$140 /mo · $1,677/yr
- Insurance
- −$124
- HOA
- −$531
- Vacancy / Maint / Mgmt
- −$325
- Net cashflow
- $-1,134
Break-even live
UW: 25.0% down · 7.5% · 30yr · 1.5% tax · 5.0% vac · 8.0% maint · 8.0% mgmt
Financing live
Cash to close
- Down payment
- $74,375
- Closing costs
- $8,925
- Reserves months
- —
- Total cash needed
- —
Loan-product check · same deal, 3 products live
Conventional
25% down · 7.5% · 30yr
- Down + closing
- —
- Monthly P&I
- —
- Monthly cashflow
- —
- DSCR
- —
- Eligible?
- —
Personal DTI + credit; lowest rate.
DSCR
20% down · 8.5% · 30yr
- Down + closing
- —
- Monthly P&I
- —
- Monthly cashflow
- —
- DSCR
- —
- Eligible?
- —
No personal income docs; deal must DSCR.
Hard money
10% down · 12.0% · 12mo
- Down + closing
- —
- Monthly P&I
- —
- Monthly cashflow
- —
- DSCR
- —
- Eligible?
- —
Short-term bridge; refi at stabilization.
Rent comps 26 comps
| Address | Beds | Baths | Sqft | Rent | $/sqft | DOM | Units | Dist |
|---|---|---|---|---|---|---|---|---|
| 3101 Honeywood Ln Roanoke, VA | 1.0–2.0 | 1.0–1.5 | 919 | $1,690 | $1.84 | 13d | 7 | 0.09mi |
| 3345 Circle Brook Dr Cave Spring, VA | 1.0–3.0 | 1.0–2.0 | 997 | $1,920 | $1.92 | 13d | 11 | 0.21mi |
| 3464 Colonial Ave Roanoke, VA | 2.0 | 1.0 | 1100 | $1,495 | $1.36 | 13d | 5 | 0.45mi |
| 726 Townside Rd SW Unit 2 Roanoke, VA | 2.0 | 1.0 | 760 | $900 | $1.18 | 43d | 1 | 0.59mi |
| 726 Townside Rd SW Roanoke, VA | 2.0 | 1.0 | 760 | $900 | $1.18 | 21d | 1 | 0.59mi |
| 708 Townside Rd SW Roanoke, VA | 3.0 | 1.0 | 881 | $1,100 | $1.25 | 43d | 1 | 0.59mi |
| 708 Townside Rd SW Unit 9 Roanoke, VA | 2.0 | 1.0 | 760 | $1,000 | $1.32 | 43d | 1 | 0.59mi |
| 708 Townside Rd SW Unit 2 Roanoke, VA | 2.0 | 1.0 | 760 | $900 | $1.18 | 43d | 1 | 0.59mi |
| 716 Townside Rd SW Unit 7 Roanoke, VA | 2.0 | 1.0 | 760 | $900 | $1.18 | 21d | 1 | 0.60mi |
| 702 Townside Rd SW Roanoke, VA | 2.0 | 1.0 | 760 | $1,000 | $1.32 | 43d | 1 | 0.61mi |
| 737 Townside Rd SW Unit 39 Roanoke, VA | 2.0 | 1.0 | 900 | $900 | $1.00 | 43d | 1 | 0.62mi |
| 729 Townside Rd SW Roanoke, VA | 2.0 | 1.0 | 760 | $900 | $1.18 | 21d | 1 | 0.62mi |
| 729 Townside Rd SW Apt 34 Roanoke, VA | 2.0 | 1.0 | 760 | $900 | $1.18 | 43d | 1 | 0.62mi |
| 729 Townside Rd SW Apt 26 Roanoke, VA | 2.0 | 1.0 | 760 | $975 | $1.28 | 43d | 1 | 0.62mi |
| 711 Townside Rd SW Unit 9 Roanoke, VA | 2.0 | 1.0 | 760 | $900 | $1.18 | 21d | 1 | 0.63mi |
| 711 Townside Rd SW Unit 7 Roanoke, VA | 3.0 | 1.0 | 881 | $1,100 | $1.25 | 44d | 1 | 0.63mi |
| 5260 Crossbow Cir Unit 8A Roanoke, VA | 2.0 | 2.0 | 1178 | $1,450 | $1.23 | 21d | 1 | 0.88mi |
| 3215 Chaparral Dr Unit H Cave Spring, VA | 2.0 | 2.0 | 750 | $1,023 | $1.36 | 43d | 1 | 0.93mi |
| 3363 View Ave Roanoke, VA | 3.0 | 1.0 | 1014 | $1,895 | $1.87 | 21d | 1 | 0.96mi |
| 3620 Manassas Dr Roanoke, VA | 3.0 | 1.5 | 1200 | $2,300 | $1.92 | 43d | 1 | 1.06mi |
| 3709 Antietam Dr Roanoke, VA | 2.0 | 1.0 | 1016 | $1,899 | $1.87 | 13d | 1 | 1.16mi |
| 3420 Chaparral Dr Roanoke, VA | 1.0–2.0 | 1.0–2.0 | 895 | $1,549 | $1.73 | 13d | 5 | 1.33mi |
| 3273 Forest Ridge Rd Roanoke, VA | 2.0 | 2.0 | 1252 | $1,850 | $1.48 | 21d | 1 | 1.39mi |
| 2679 Beverly Blvd SW Roanoke, VA | 3.0 | 1.0 | 1000 | $1,623 | $1.62 | 13d | 1 | 1.40mi |
| 3366 Forest Ct Roanoke, VA | 2.0 | 2.0 | 1027 | $1,650 | $1.61 | 21d | 1 | 1.46mi |
| 3368 Forest Ct Roanoke, VA | 2.0 | 2.0 | 1027 | $2,350 | $2.29 | 13d | 1 | 1.46mi |
HOA detail
- Monthly dues
- $531 · $6,372/yr
- Likely covers
- gas
Listing history 34 events
-
2026-06-18days on market $297,500 Active 69 DOM
-
2026-06-17days on market $297,500 Active 68 DOM
-
2026-06-16days on market $297,500 Active 67 DOM
-
2026-06-15days on market $297,500 Active 66 DOM
-
2026-06-14days on market $297,500 Active 64 DOM
-
2026-06-13days on market $297,500 Active 63 DOM
-
2026-06-10days on market $297,500 Active 61 DOM
-
2026-06-09days on market $297,500 Active 60 DOM
-
2026-06-08days on market $297,500 Active 59 DOM
-
2026-06-05days on market $297,500 Active 55 DOM
-
2026-06-03days on market $297,500 Active 54 DOM
-
2026-06-02days on market $297,500 Active 53 DOM
-
2026-06-01days on market $297,500 Active 52 DOM
-
2026-05-31days on market $297,500 Active 51 DOM
-
2026-05-30days on market $297,500 Active 50 DOM
-
2026-05-19price $297,500 330-char remark
Show marketing remark (330 chars)
Updated end unit townhouse with 2192 Sq Ft of finished space, finished basement has a separate kitchen, fireplaced, bedroom and full bath. Covered deck that walks out to the side yard, new stainless appliances, Gas log fireplace and tons of storage. Private patio entrance. Currently tenant occupied and not available until June 1
-
2026-04-10$335,000 Active 330-char remark
Show marketing remark (330 chars)
Updated end unit townhouse with 2192 Sq Ft of finished space, finished basement has a separate kitchen, fireplaced, bedroom and full bath. Covered deck that walks out to the side yard, new stainless appliances, Gas log fireplace and tons of storage. Private patio entrance. Currently tenant occupied and not available until June 1
-
2022-10-28soldstatus $215,000 Closed 600-char remark
Show marketing remark (600 chars)
Very well maintained condo in windward with 3 bedrooms and 3 full baths. This condo features large eat-in kitchen with a new refrigerator and new oven. All 3 bathrooms have been remodeled with tasteful and quality finishes. New carpets were just installed in the 2 bedrooms on main level. Lower level has huge family room with kitchenette, bedroom, full bath, and laundry room. On the exterior there is a private fenced in front patio area with pavers. Off the rear of the condo there is a large deck. Ownership of condo grants access to the common pool. HOA includes water, sewer, and trash removal.
-
2022-10-03status Pending 600-char remark
Show marketing remark (600 chars)
Very well maintained condo in windward with 3 bedrooms and 3 full baths. This condo features large eat-in kitchen with a new refrigerator and new oven. All 3 bathrooms have been remodeled with tasteful and quality finishes. New carpets were just installed in the 2 bedrooms on main level. Lower level has huge family room with kitchenette, bedroom, full bath, and laundry room. On the exterior there is a private fenced in front patio area with pavers. Off the rear of the condo there is a large deck. Ownership of condo grants access to the common pool. HOA includes water, sewer, and trash removal.
-
2022-09-16$225,000 Active 600-char remark
Show marketing remark (600 chars)
Very well maintained condo in windward with 3 bedrooms and 3 full baths. This condo features large eat-in kitchen with a new refrigerator and new oven. All 3 bathrooms have been remodeled with tasteful and quality finishes. New carpets were just installed in the 2 bedrooms on main level. Lower level has huge family room with kitchenette, bedroom, full bath, and laundry room. On the exterior there is a private fenced in front patio area with pavers. Off the rear of the condo there is a large deck. Ownership of condo grants access to the common pool. HOA includes water, sewer, and trash removal.
-
2020-08-18soldstatus $164,820
-
2020-06-19$162,500
-
2019-11-15soldstatus $139,900
-
2019-09-19$139,900
-
2007-11-01historical
-
2007-08-21$154,950
-
2007-06-16historical
-
2007-04-16$159,950
-
2005-12-31historical
-
2005-11-20$168,000
-
2005-10-12historical
-
2005-04-08$168,000
-
2001-12-27soldstatus $103,000
-
2000-10-18$99,950
ⓘ Source: listings_history table (triggers on properties + properties_extension) + one-shot
backfill from property_details.listing_events for pre-trigger history.
Tax reassessment forecast VA · Resets to sale price
- Current annual tax
- $1,677 · $140/mo
- Projected year-2 tax
- $2,440 · $203/mo
- Expected delta
- +$762/yr (+$64/mo · 45.5%)
ⓘ Screening estimate from a state-policy table — verify with the county assessor before closing.
Climate risk First Street
- Flood 1/10 Low FEMA zone X (unshaded) · 0% chance over 30 yrs
- Wildfire 3/10 Moderate
- Heat 5/10 Major 7 d/yr ≥99°F today · 20 d/yr by 30 yrs out
- Wind 2/10 Low 100% chance of damaging wind over 30 yrs
- Air quality 2/10 Low 0 unhealthy d/yr today · 1 by 30 yrs out
Nearby sold comps map
Loading sold comps map…
Walkable amenities ~0.75 mi
Loading nearby amenities…
Taxation est. · year 1
- Rental income
- $18,549
- − Mortgage interest
- −$16,665
- − Property taxes
- −$1,677
- − Insurance
- −$1,488
- − Repairs & maintenance
- −$1,484
- − Management
- −$1,484
- − HOA
- −$6,372
- − Depreciation
- −$8,655
- Taxable loss
- −$19,275
- Est. tax savings @ 24.0%
- +$4,626
- After-tax cash flow
- $-8,979/yr
For passive investors: Depreciation is non-cash, so a rental often shows a tax loss while cash-flowing — sheltering income. Rental losses are passive: they offset passive income freely, and up to $25,000/yr can offset ordinary (W-2) income if you actively participate and your MAGI is under $100k (phasing out to $0 by $150k); unused losses carry forward. On sale, claimed depreciation is recaptured at up to 25%, and gains may owe capital-gains tax (a 1031 exchange can defer both). Figures are a year-1 estimate at your 24.0% rate — not tax advice; consult a CPA.
Schools (NCES district)
- District
- Roanoke City Public School District
- NCES district ID
- 5103300
- Math proficiency
- 40% ▼ -38.00%
- Reading proficiency
- 58% ▼ -12.00%
- Median HH income
- $38,592
- Composite
- 40.8/100
- National rank
- #3639
- State rank
- #102 of 131 in VA
Livability — Roanoke
- Score
- 73/100
- State rank
- #163
- US rank
- #5055
Category grades
Schools grade is shown separately in the Schools card above.
Census & demographics
- Census place
- Roanoke, VA
- County
- Roanoke County · 67,305 people
- City population
- 168,930
- Metro
- Roanoke, VA
- Population (ZIP)
- 38,720
- Household income
- $90,885
- Rent vs Own
- Severe rent burden
- 495.0
Population outlook (Roanoke County) Hauer SSP2
- Today (2025)
- 106,094 people
- By 2030
- 108,927 · +2.7%
- By 2040
- 114,104 · +7.5%
- By 2050
- 118,032 · +11.3%
- By 2075
- 123,363 · +16.3%
- By 2100
- 116,827 · +10.1%
Race, ethnicity, and origin ACS 2023
- Neighborhood character
- Predominantly White (83%)
- Race & ethnicity
- White 83% Asian 6% Hispanic / Latino 4% Two or more races 4% Black 4%
- Common ancestry
- Italian 4% Slovak 3% Serbian 3%
- Foreign-born
- 10% · Canada, China, Vietnam
- Languages at home
- 86% English-only · Spanish 5% Other Indo-European 3% Other Asian/Pacific 1%
Political lean MEDSL · Roanoke
- 2024 margin
- Strong D (+23.6) · D 61.1% · R 37.5% · Other 1.4%
- 2008→2024 swing
- +0.2pp no change · 2008: 23.4pp · 2024: 23.6pp
- All cycles
- 2024: D+23.6 2020: D+25.8 2016: D+17.6 2012: D+21.5 2008: D+23.4
Not yet ingested
- Civics
- —
Market trends
- HPI YoY
- ▼ -266.18%
- Current HPI
- 176.0558
- Rent YoY
- ▲ 2.88%
- Metro
- Roanoke, VA
- State GDP YoY
- ▲ 2.40%
- F500 in state
- 50
Industry mix (Fortune 500 HQ in VA)
| Industry | F500 HQs | Revenue |
|---|---|---|
| Aerospace / Defense | 4 | $236B |
|
||
| Technology / Defense | 3 | $32B |
|
||
| Financial Services | 2 | $176B |
|
||
| Utilities | 2 | $27B |
|
||
| Insurance | 2 | $25B |
|
||
| Technology | 2 | $15B |
|
||
Price history
+197.6% since first listed19 events — show timeline
- 2026-05-19 Price Changed $297,500 MLSRV
- 2026-04-10 Listed $335,000 MLSRV
- 2022-10-28 Sold (MLS) $215,000 MLSRV
- 2022-10-03 Pending — MLSRV
- 2022-09-16 Listed $225,000 MLSRV
- 2020-08-18 Sold (MLS) $164,820 MLSRV
- 2020-06-19 Listed $162,500 MLSRV
- 2019-11-15 Sold (MLS) $139,900 MLSRV
- 2019-09-19 Listed $139,900 MLSRV
- 2007-11-01 Listing Removed — MLSRV
- 2007-08-21 Listed $154,950 MLSRV
- 2007-06-16 Listing Removed — MLSRV
- 2007-04-16 Listed $159,950 MLSRV
- 2005-12-31 Listing Removed — MLSRV
- 2005-11-20 Listed $168,000 MLSRV
- 2005-10-12 Listing Removed — MLSRV
- 2005-04-08 Listed $168,000 MLSRV
- 2001-12-27 Sold (MLS) $103,000 MLSRV
- 2000-10-18 Listed $99,950 MLSRV
Cash-flow waterfall
monthlySold comps — $/sqft
last 12 mo · ≤1 miLoading sold comps…