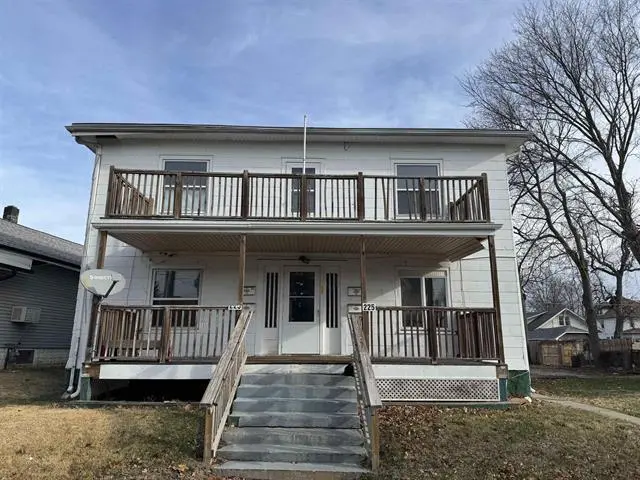
223 S Lincoln Ave · Davenport, IA
Flood risk 6/10 · Moderate
- FEMA flood zone
- X (unshaded)
- Chance of flooding over 30 yrs
- 0.67%
- Est. flood insurance / yr
- $473 – $860
Fire risk 3/10 · Minor
- Est. fire insurance / yr
- $902 – $1,676
Heat risk 3/10 · Minor
- Hot days now (above 104°F)
- 7 days/yr
- Hot days in 30 yrs
- 16 days/yr
Wind risk 2/10 · Minimal
- Chance of severe wind over 30 yrs
- —
Air-quality risk 3/10 · Minor
- Unhealthy air days now
- 2 days/yr
- Unhealthy air days in 30 yrs
- 3 days/yr
Risk factors via First Street. Map © Google.
Why this score? — see what drove the F grade
The composite is a weighted blend of 9 inputs, each scored 0–100. Each bar is that input's sub-score; the figure is the points it added to the 100-point composite (weight × sub-score).
- Cash flow +8.7/30.0
- 1% rule +5.7/10.0
- Livability +4.0/5.0
- Schools +3.9/10.0
- Rent growth +2.5/5.0
- Condition / age +2.5/5.0
- DSCR +2.4/10.0
- ARV discount +0.0/15.0
- Appreciation +0.0/10.0
$152,000
🖨 Deal sheet (PDF) 📄 Offer letter ✓ Due diligence
Listing remarks MLS
Great rental opportunity in Davenport. Each unit has a designated parking spot on the attached parcel included (J0024-48). All four units offer an eat in kitchen, full bath, bedroom, living room and an 8x14 storage unit in the basement. The basement has washer/dryer hook-ups. The roof and boiler were replaced around 2021.
Key facts
- Eat in kitchen
- Living room
- Full bath
Tags
Neighborhood map
What this means for you Summary
Snapshot
- This is a 16-bed/16.0-bath other listed at $152k.
Deal economics
- At list price, monthly cash flow is $-129 ($-2k/yr) — negative.
- To cash-flow at today's rent, offer at most $134k (12.1% below list).
- Meets the 1% rule at list price ($2k rent vs $152k).
- Recommended offer: $134k (12.1% below list) — sets the bar for cash-flow.
Location & tenants
- Location reads 79/100 on livability (#126 in IA, #2,312 nationally) — a middle-class / working-renter tenant base. Strengths: cost of living A+, housing A+, health & safety A+; Watch: employment C-, crime F.
- Davenport Community School District (urban): math 43% / reading 50% proficiency, ranked #288 of 289 in IA (top 100%) — families likely to look elsewhere, expect single-tenant / working-renter base with shorter leases.
- Zoned schools: Hayes Elementary School (math 41% / reading 46%, grade F, #560 of 616 statewide, top 91%, 339 students, 60% FRL); Frank L Smart Intermediate (math 27% / reading 30%, grade F, #246 of 246 statewide, top 100%, 313 students, 71% FRL); West High School (math 38% / reading 53%, grade D-, #323 of 336 statewide, top 96%, 1,469 students, 54% FRL).
- Market conditions: 67 active listings in the ZIP; 805 units permitted in Scott County in 2024 (479 in 5+ unit buildings).
- This rent runs 36% of the median local income ($54k/yr) — at the standard rent-burdened threshold; future hikes will face affordability resistance.
Forward outlook
- Local home prices are declining (-3.0%/yr); year-one equity from $1k of loan paydown is wiped out by about $5k of value loss. Plan a longer hold.
- Scott County population projected at +19% by 2050 — long-run rental-demand tailwind backs the buy-and-hold thesis.
Negotiation context
- It's been on market 116 days — a 9% lower offer ($138k) is reasonable based on typical stale-listing flexibility.
- 7 sale attempts since 12y ago with the ask held roughly flat each time — persistent listings suggest the price (not the market) is what's stuck; bring a comps-based counter.
- Current owner paid $93k; list at $152k implies a 63% gain — meaningful room to come down on a strong offer.
Risks & watch-outs
- Watch-outs: property tax is 4.4% of price; built in 1940 — expect roof / HVAC / electrical / plumbing capex.
- Climate carrying-cost: major flood risk — expect insurance premiums to compound above CPI over the hold.
Questions for the listing agent
- What do current leases actually rent for vs. the listed asking? Can we see a recent rent roll and the last 12 months of T-12 income?
- It's been on market 116 days. Have you received any prior offers? Is the seller open to a 12% concession, seller financing, or rate buy-down credit?
- Built in 1940 — when were the roof, HVAC, electrical panel, plumbing, and water heater last replaced?
- Property tax is high relative to price — has the assessment been appealed recently, and will the sale trigger a re-assessment?
- Why hasn't it sold? Are there any deal-killer items the seller is aware of (foundation, flood, title, zoning, code violations)?
- Is there a deadline driving the sale (1031 exchange, divorce, estate, relocation)? That informs how much negotiation room exists.
- Crime grade is F in this area — have there been break-ins, vandalism, or insurance claims at this property in the last 3 years? What carrier currently insures it and at what premium?
- The area grade is low — what's the realistic commute time and amenity access for the typical tenant pool here? Any planned neighborhood developments (good or bad) we should know about?
- What's the average days-on-market for RENTAL listings here right now (not sales)? A rising rental-DOM trend means longer vacancies and softer asking-rent achievability than the comps imply.
- What's the recent tenant-quality profile in this submarket — average credit score on applications, eviction rate, late-payment / NSF rate, and stable-employment percentage? A property-management company in the area should have these aggregated.
- How much new for-sale + rental construction is in the pipeline within 1–3 miles? Heavy new supply typically softens prices + rents 12–24 months out; constrained supply supports both.
Investment metrics
- 1% rule
- 1.07% ✓
- Cap rate
- 5.28%
- Cash-on-cash
- -3.63%
- DSCR
- 0.84
- GRM
- 7.8
CMA / ARV
- ARV (median comp)
- $123,538
- List price
- $152,000
- Delta
- 23.04%
- Verdict
- OVERPRICED
- Comps
- 20 within 1.0 mi
Projected returns pro-forma
-3.0% appreciation · 3.0% rent growth · sell at horizon
- IRR
- -22.2%
- Equity multiple
- 0.23×
- Total profit
- $-32,575
- Equity at exit
- $22,664
- IRR
- -15.7%
- Equity multiple
- 0.11×
- Total profit
- $-37,903
- Equity at exit
- $13,142
Cash invested: $42,560 (down + closing). Projections, not guarantees.
Landlord ↔ Tenant lean methodology
- Overall (STATE)
- 83 Strongly Landlord-Friendly
- State Iowa
- 83 Strongly Landlord-Friendly · R+6
- County
- — inherits STATE
- City
- — inherits STATE
ZIP-level market 52802
- Home prices YoY
- -28.3%
- Active inventory
- 67
- Price-to-rent
- 7.8×
Monthly cashflow live
- Estimated rent
- $1,631 medium interval (Pro) →
- Mortgage (P&I)
- −$797
- Tax from tax record
- −$556 /mo · $6,677/yr
- Insurance
- −$63
- HOA
- −$0
- Vacancy / Maint / Mgmt
- −$342
- Net cashflow
- $-129
Break-even live
Sensitivity live
| Price | -10% $-43 | -5% $-86 | +0% $-129 | +5% $-172 | +10% $-215 |
|---|---|---|---|---|---|
| Rent | -10% $-257 | -5% $-193 | +0% $-129 | +5% $-64 | +10% $0 |
| Rate | -1.0pp $-52 | -0.5pp $-90 | base $-129 | +0.5pp $-168 | +1.0pp $-208 |
UW: 25.0% down · 7.5% · 30yr · 1.5% tax · 5.0% vac · 8.0% maint · 8.0% mgmt
Financing live
Cash to close
- Down payment
- $38,000
- Closing costs
- $4,560
- Reserves months
- —
- Total cash needed
- —
Loan-product check · same deal, 3 products live
Conventional
25% down · 7.5% · 30yr
- Down + closing
- —
- Monthly P&I
- —
- Monthly cashflow
- —
- DSCR
- —
- Eligible?
- —
Personal DTI + credit; lowest rate.
DSCR
20% down · 8.5% · 30yr
- Down + closing
- —
- Monthly P&I
- —
- Monthly cashflow
- —
- DSCR
- —
- Eligible?
- —
No personal income docs; deal must DSCR.
Hard money
10% down · 12.0% · 12mo
- Down + closing
- —
- Monthly P&I
- —
- Monthly cashflow
- —
- DSCR
- —
- Eligible?
- —
Short-term bridge; refi at stabilization.
Listing history 32 events
-
2026-06-21days on market $152,000 Active 116 DOM
-
2026-06-18days on market $152,000 Active 113 DOM
-
2026-06-17days on market $152,000 Active 112 DOM
-
2026-06-16days on market $152,000 Active 111 DOM
-
2026-06-15days on market $152,000 Active 110 DOM
-
2026-06-14days on market $152,000 Active 108 DOM
-
2026-06-13days on market $152,000 Active 107 DOM
-
2026-06-10days on market $152,000 Active 105 DOM
-
2026-06-09days on market $152,000 Active 104 DOM
-
2026-06-08days on market $152,000 Active 103 DOM
-
2026-06-07days on market $152,000 Active 102 DOM
-
2026-06-03days on market $152,000 Active 98 DOM
-
2026-06-02days on market $152,000 Active 97 DOM
-
2026-06-01days on market $152,000 Active 96 DOM
-
2026-05-31days on market $152,000 Active 95 DOM
-
2026-05-30days on market $152,000 Active 94 DOM
-
2026-03-17status Active 327-char remark
Show marketing remark (327 chars)
Great rental opportunity in Davenport. Each unit has a designated parking spot on the attached parcel included (J0024-48). All four units offer an eat in kitchen, full bath, bedroom, living room and an 8x14 storage unit in the basement. The basement has washer/dryer hook-ups. The roof and boiler were replaced around 2021.
-
2026-01-28status Pending 327-char remark
Show marketing remark (327 chars)
Great rental opportunity in Davenport. Each unit has a designated parking spot on the attached parcel included (J0024-48). All four units offer an eat in kitchen, full bath, bedroom, living room and an 8x14 storage unit in the basement. The basement has washer/dryer hook-ups. The roof and boiler were replaced around 2021.
-
2026-01-28status Active 327-char remark
Show marketing remark (327 chars)
Great rental opportunity in Davenport. Each unit has a designated parking spot on the attached parcel included (J0024-48). All four units offer an eat in kitchen, full bath, bedroom, living room and an 8x14 storage unit in the basement. The basement has washer/dryer hook-ups. The roof and boiler were replaced around 2021.
-
2026-01-28status Pending 327-char remark
Show marketing remark (327 chars)
Great rental opportunity in Davenport. Each unit has a designated parking spot on the attached parcel included (J0024-48). All four units offer an eat in kitchen, full bath, bedroom, living room and an 8x14 storage unit in the basement. The basement has washer/dryer hook-ups. The roof and boiler were replaced around 2021.
-
2026-01-06historical
-
2026-01-05$152,000 Active 327-char remark
Show marketing remark (327 chars)
Great rental opportunity in Davenport. Each unit has a designated parking spot on the attached parcel included (J0024-48). All four units offer an eat in kitchen, full bath, bedroom, living room and an 8x14 storage unit in the basement. The basement has washer/dryer hook-ups. The roof and boiler were replaced around 2021.
-
2025-12-27historical
-
2025-10-22price
-
2024-12-27Active
-
2014-09-09soldstatus $93,000
-
2014-09-04soldstatus $93,000
-
2014-09-04soldstatus $93,000
-
2014-09-04soldstatus $93,000
-
2014-06-06$104,750
-
2014-06-06$104,750
-
2014-06-06$104,750
ⓘ Source: listings_history table (triggers on properties + properties_extension) + one-shot
backfill from property_details.listing_events for pre-trigger history.
Tax reassessment forecast IA · Partial reset (capped growth)
- Current annual tax
- $6,677 · $556/mo
- Projected year-2 tax
- $6,677 · $556/mo
- Expected delta
- $0/yr ($0/mo · 0.0%)
ⓘ Screening estimate from a state-policy table — verify with the county assessor before closing.
Climate risk First Street
- Flood 6/10 Major FEMA zone X (unshaded) · 67% chance over 30 yrs
- Wildfire 3/10 Moderate
- Heat 3/10 Moderate 7 d/yr ≥104°F today · 16 d/yr by 30 yrs out
- Wind 2/10 Low
- Air quality 3/10 Moderate 2 unhealthy d/yr today · 3 by 30 yrs out
Nearby sold comps map
Loading sold comps map…
Walkable amenities ~0.75 mi
Loading nearby amenities…
Taxation est. · year 1
- Rental income
- $19,567
- − Mortgage interest
- −$8,514
- − Property taxes
- −$6,677
- − Insurance
- −$760
- − Repairs & maintenance
- −$1,565
- − Management
- −$1,565
- − Depreciation
- −$4,422
- Taxable loss
- −$3,937
- Est. tax savings @ 24.0%
- +$945
- After-tax cash flow
- $-599/yr
For passive investors: Depreciation is non-cash, so a rental often shows a tax loss while cash-flowing — sheltering income. Rental losses are passive: they offset passive income freely, and up to $25,000/yr can offset ordinary (W-2) income if you actively participate and your MAGI is under $100k (phasing out to $0 by $150k); unused losses carry forward. On sale, claimed depreciation is recaptured at up to 25%, and gains may owe capital-gains tax (a 1031 exchange can defer both). Figures are a year-1 estimate at your 24.0% rate — not tax advice; consult a CPA.
Schools (NCES district)
- District
- Davenport Community School District
- NCES district ID
- 1908580
- Math proficiency
- 43% ▼ -11.00%
- Reading proficiency
- 50% ▼ -3.00%
- Median HH income
- $46,157
- Composite
- 39.49/100
- National rank
- #3951
- State rank
- #288 of 289 in IA
Livability — Davenport
- Score
- 79/100
- State rank
- #126
- US rank
- #2312
Category grades
Schools grade is shown separately in the Schools card above.
Census & demographics
- Census place
- Davenport, IA
- County
- Scott County · 144,583 people
- City population
- 103,319
- Metro
- Davenport-Moline-Rock Island, IA-IL
- Population (ZIP)
- 9,466
- Household income
- $54,380
- Rent vs Own
- Severe rent burden
- 244.0
Population outlook (Scott County) Hauer SSP2
- Today (2025)
- 188,878 people
- By 2030
- 196,648 · +4.1%
- By 2040
- 210,860 · +11.6%
- By 2050
- 224,359 · +18.8%
- By 2075
- 258,884 · +37.1%
- By 2100
- 286,447 · +51.7%
Race, ethnicity, and origin ACS 2023
- Neighborhood character
- Predominantly White (71%)
- Race & ethnicity
- White 71% Hispanic / Latino 14% Two or more races 10% Black 5% Asian 1%
- Hispanic origin (detail)
- Mexican 13%
- Common ancestry
- Romanian 2% Lithuanian 1% Italian 1%
- Foreign-born
- 4% · Canada, Vietnam
- Languages at home
- 92% English-only · Spanish 7%
Political lean MEDSL · Scott
- 2024 margin
- Toss-up / Even · D 47.3% · R 51.2% · Other 1.4%
- 2008→2024 swing
- -18.4pp toward R · 2008: 14.6pp · 2024: -3.9pp
- All cycles
- 2024: R+3.9 2020: D+3.5 2016: D+1.4 2012: D+13.8 2008: D+14.6
Not yet ingested
- Civics
- —
Market trends
- HPI YoY
- ▼ -59.59%
- Current HPI
- 151.2076
- Rent YoY
- —
- Metro
- Davenport-Moline-Rock Island, IA-IL
- State GDP YoY
- ▲ 2.48%
- F500 in state
- 4
Industry mix (Fortune 500 HQ in IA)
| Industry | F500 HQs | Revenue |
|---|---|---|
| Financial Services | 1 | $16B |
|
||
| Retail / Convenience | 1 | $15B |
|
||
Price history
+45.1% since first listed16 events — show timeline
- 2026-03-17 Relisted — MRED as Distributed by MLS Grid
- 2026-01-28 Pending — MRED as Distributed by MLS Grid
- 2026-01-28 Relisted — MRED as Distributed by MLS Grid
- 2026-01-28 Pending — MRED as Distributed by MLS Grid
- 2026-01-06 Listing Removed — RMLSA as Distributed by MLS Grid
- 2026-01-05 Listed $152,000 MRED as Distributed by MLS Grid
- 2025-12-27 Listing Removed — MRED as Distributed by MLS Grid
- 2025-10-22 Price Changed — RMLSA as Distributed by MLS Grid
- 2024-12-27 Listed — RMLSA as Distributed by MLS Grid
- 2014-09-09 Sold (Public Records) $93,000 Public Records
- 2014-09-04 Sold (MLS) $93,000 MRED as Distributed by MLS Grid
- 2014-09-04 Sold (MLS) $93,000 RMLSA as Distributed by MLS Grid
- 2014-09-04 Sold (MLS) $93,000 MRED as Distributed by MLS Grid
- 2014-06-06 Listed $104,750 MRED as Distributed by MLS Grid
- 2014-06-06 Listed $104,750 RMLSA as Distributed by MLS Grid
- 2014-06-06 Listed $104,750 MRED as Distributed by MLS Grid
Property tax history
+12.2%/yrLatest (2025): $6,677 · -1.2% YoY. Source: county tax records.
Cash-flow waterfall
monthlySold comps — $/sqft
last 12 mo · ≤1 miLoading sold comps…