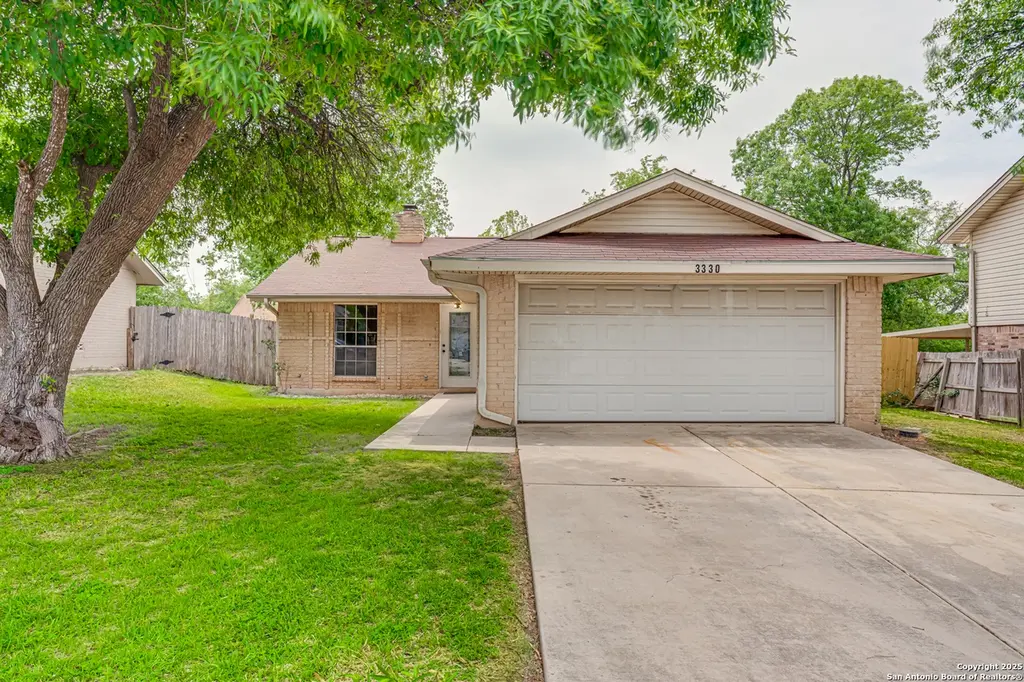
3330 Turnabout · Schertz, TX
Flood risk 1/10 · Minimal
- FEMA flood zone
- X (unshaded)
- Chance of flooding over 30 yrs
- 0.0%
- Est. flood insurance / yr
- $507 – $1,088
Fire risk 5/10 · Moderate
- Est. fire insurance / yr
- $1,222 – $2,270
Heat risk 8/10 · Major
- Hot days now (above 107°F)
- 7 days/yr
- Hot days in 30 yrs
- 22 days/yr
Wind risk 8/10 · Major
- Chance of severe wind over 30 yrs
- 80.0%
Air-quality risk 1/10 · Minimal
- Unhealthy air days now
- 0 days/yr
- Unhealthy air days in 30 yrs
- 0 days/yr
Risk factors via First Street. Map © Google.
Why this score? — see what drove the C+ grade
The composite is a weighted blend of 9 inputs, each scored 0–100. Each bar is that input's sub-score; the figure is the points it added to the 100-point composite (weight × sub-score).
- Cash flow +21.3/30.0
- ARV discount +11.7/15.0
- DSCR +6.8/10.0
- 1% rule +5.2/10.0
- Appreciation +5.2/10.0
- Schools +4.4/10.0
- Livability +3.7/5.0
- Rent growth +3.1/5.0
- Condition / age +2.5/5.0
$190,000
🖨 Deal sheet 📄 Offer letter ✓ Due diligence
Listing remarks
Welcome to your freshly upgraded dream house! With a custom modern interior and rustic charm, you'll love this property from the moment you walk in the door. It comes complete with premium features like a central wood-burning fireplace, custom glass wash basins and stained cedar accents. The back patio is fully bug netted so it'll be the perfect outdoor retreat for cooking or watching kid play. The location is tough to beat as well, with two HEB's within a 10 minute drive and easy access to San Antonio and
Key facts
- 7,187 sq ft lot
- 2 garage spots
- Built 1977
Tags
Property features AI
Finance
- Financial info: Down payment assistance resources available
- HOA & community: Voluntary HOA; Subdivision: NORTHCLIFFE
Exterior
- Parking: 2-car garage (detached/attached not specified)
- Utilities: City water and sewer
- Home design: Pre-owned single-family home; Approximately 49 years old
- Construction: Brick and vinyl exterior; Slab foundation; Composition roof
- Exterior features: Park/playground nearby; Jogging trails; Sports court; BBQ/grill area
Interior
- Kitchen: Kitchen (approx. 11 x 15); Includes dishwasher
- Bedrooms: Master bedroom on lower level (approx. 11 x 14); Bedroom 2 (approx. 11 x 12); Bedroom 3 (approx. 9 x 9)
- Flooring: Laminate flooring
- Bathrooms: 2 full bathrooms; Master bath with tub/shower combination (approx. 5 x 8); Second bathroom (main level, approx. 5 x 8)
- Heating & cooling: Central heating (electric); Central air conditioning
- Interior features: Dishwasher; Smoke alarm; All window coverings remain; 1 living area
- Laundry & utility: Utility room (main level)
Neighborhood map
What this means for you Summary
Snapshot
- This is a 3-bed/2.0-bath single-family listed at $190k.
Deal economics
- At list price, monthly cash flow is $277 ($3k/yr) — positive.
- The deal already cash-flows at list — no discount required.
- Meets the 1% rule at list price ($2k rent vs $190k).
- Recommended offer: $184k (3.0% below list) — sets the bar for market timing.
- Cap rate 8.0% vs local median 2.8% in Schertz — top-decile yield for the area; either an underpriced asset or a hidden risk that comps aren't pricing in. Stress-test before assuming the spread holds.
Location & tenants
- Location reads 73/100 on livability (#198 in TX) — a middle-class / working-renter tenant base. Strengths: employment A+, housing A+, crime A; Watch: health & safety D+, amenities F, commute F.
- Schertz-Cibolo-U City ISD (suburban): math 49% / reading 48% proficiency, ranked #152 of 826 in TX (top 18%) — families likely to look elsewhere, expect single-tenant / working-renter base with shorter leases.
- Zoned schools: John A Sippel El (math 40% / reading 41%, grade F, #1,490 of 4,322 statewide, top 35%, 743 students, 35% FRL); Byron P Steele Ii H S (math 68% / reading 66%, grade B, #163 of 1,632 statewide, top 11%, 2,716 students, 25% FRL) — zoned schools at 30% FRL track the district average.
- Market conditions: Rents rising (+2.4%/yr); 739 active listings in the ZIP; 2 comparable units currently listed for rent nearby; high-income renter base; 2,064 units permitted in Guadalupe County in 2024 (133 in 5+ unit buildings).
Forward outlook
- In year one you build about $2k of equity ($1k loan paydown + $894 appreciation (0.5% local appreciation)).
- Guadalupe County population projected at +61% by 2050 — long-run rental-demand tailwind backs the buy-and-hold thesis.
- At projected returns (0.5% appreciation + 2.4% rent growth), your $53k cash investment doubles in ~8 years — after that, you're playing with house money.
Negotiation context
- It's been on market 60 days — a 3% lower offer ($184k) is reasonable based on typical stale-listing flexibility.
- 5 sale attempts since 2y ago; this cycle's ask has dropped $10k (5%) from the opening price — seller is motivated, your offer sets the floor, not the list.
Risks & watch-outs
- Climate carrying-cost: severe wind risk, 80% chance of damaging wind over 30y; moderate wildfire risk; extreme-heat days projected 7→22/yr by 2055 (HVAC capex compounding) — expect insurance premiums to compound above CPI over the hold.
Questions for the listing agent
- It's been on market 60 days. Have you received any prior offers? Is the seller open to a 3% concession, seller financing, or rate buy-down credit?
- Built in 1977 — when were the roof, HVAC, electrical panel, plumbing, and water heater last replaced?
- Is there a deadline driving the sale (1031 exchange, divorce, estate, relocation)? That informs how much negotiation room exists.
- What's the average days-on-market for RENTAL listings here right now (not sales)? A rising rental-DOM trend means longer vacancies and softer asking-rent achievability than the comps imply.
- What's the recent tenant-quality profile in this submarket — average credit score on applications, eviction rate, late-payment / NSF rate, and stable-employment percentage? A property-management company in the area should have these aggregated.
- How much new for-sale + rental construction is in the pipeline within 1–3 miles? Heavy new supply typically softens prices + rents 12–24 months out; constrained supply supports both.
Investment metrics
- 1% rule
- 1.02% ✓
- Cap rate
- 8.04%
- Cash-on-cash
- 6.25%
- DSCR
- 1.28
- GRM
- 8.2
CMA / ARV
- ARV (on-the-fly)
- $209,568
- Comps found
- 12
Show comp detail 12 sales within ~0.75 mi
| Address | Dist | Beds/Ba | Sqft | Sold | Price | $/sf | Match |
|---|---|---|---|---|---|---|---|
| 3330 Turnabout | 0.00mi | 3/2.0 | 1,184 (0%) | 1mo | $190,000 | $160 | 99 |
| 3425 Country Vw | 0.08mi | 3/2.0 | 1,029 (-13%) | 2mo | $185,000 | $180 | 73 |
| 4004 Whisper Rdg | 0.28mi | 3/2.0 | 1,259 (+6%) | 6mo | $229,990 | $183 | 71 |
| 3325 Meadow Head Dr | 0.19mi | 2/2.0 (-1) | 1,073 (-9%) | 1mo | $174,500 | $163 | 70 |
| 3432 Whisper Blf | 0.18mi | 3/2.0 | 1,348 (+14%) | 1mo | $209,999 | $156 | 67 |
| 6041 Scenic Links | 0.42mi | 3/2.0 | 1,214 (+2%) | 12mo | $220,000 | $181 | 66 |
| 3921 Whisper Fld | 0.36mi | 4/2.0 (+1) | 1,261 (+6%) | 4mo | $225,000 | $178 | 64 |
| 3445 Morning | 0.22mi | 3/2.5 | 1,320 (+12%) | 7mo | $215,000 | $163 | 63 |
| 3429 Country Vw | 0.09mi | 3/2.5 | 1,326 (+12%) | 13mo | $235,000 | $177 | 63 |
| 4128 Wensledale | 0.24mi | 3/2.0 | 1,347 (+14%) | 7mo | $225,000 | $167 | 60 |
| 5564 Fm 1103 | 0.70mi | 3/2.0 | 1,247 (+5%) | 4mo | $250,000 | $200 | 56 |
| 4310 Wensledale Dr | 0.15mi | 3/2.0 | 1,351 (+14%) | 20mo | $215,000 | $159 | 53 |
Match score weights: distance 35% · size 25% · config 20% · recency 20%. Top-matched comps best support the ARV.
Projected returns pro-forma
0.47% appreciation · 2.42% rent growth · sell at horizon
- IRR
- 5.8%
- Equity multiple
- 1.29×
- Total profit
- $15,198
- Equity at exit
- $59,681
- IRR
- 10.2%
- Equity multiple
- 2.15×
- Total profit
- $61,183
- Equity at exit
- $75,446
Cash invested: $53,200 (down + closing). Projections, not guarantees.
Landlord ↔ Tenant lean methodology
- Overall (STATE)
- 87 Strongly Landlord-Friendly
- State Texas
- 87 Strongly Landlord-Friendly · R+5
- County
- — inherits STATE
- City
- — inherits STATE
ZIP-level market 78108
- Home prices YoY
- 0.3%
- Rents YoY
- 2.4%
- Active inventory
- 739
- Price-to-rent
- 8.2×
Monthly cashflow live
- Estimated rent
- $1,941 medium interval (Pro) →
- Mortgage (P&I)
- −$996
- Tax from tax record
- −$181 /mo · $2,168/yr
- Insurance
- −$79
- HOA
- −$0
- Vacancy / Maint / Mgmt
- −$408
- Net cashflow
- $277
Break-even live
UW: 25.0% down · 7.5% · 30yr · 1.5% tax · 5.0% vac · 8.0% maint · 8.0% mgmt
Financing live
Cash to close
- Down payment
- $47,500
- Closing costs
- $5,700
- Reserves months
- —
- Total cash needed
- —
Loan-product check · same deal, 3 products live
Conventional
25% down · 7.5% · 30yr
- Down + closing
- —
- Monthly P&I
- —
- Monthly cashflow
- —
- DSCR
- —
- Eligible?
- —
Personal DTI + credit; lowest rate.
DSCR
20% down · 8.5% · 30yr
- Down + closing
- —
- Monthly P&I
- —
- Monthly cashflow
- —
- DSCR
- —
- Eligible?
- —
No personal income docs; deal must DSCR.
Hard money
10% down · 12.0% · 12mo
- Down + closing
- —
- Monthly P&I
- —
- Monthly cashflow
- —
- DSCR
- —
- Eligible?
- —
Short-term bridge; refi at stabilization.
Rent comps 2 comps
| Address | Beds | Baths | Sqft | Rent | $/sqft | DOM | Units | Dist |
|---|---|---|---|---|---|---|---|---|
| 4909 Tiffany Ln Schertz, TX | 3.0 | 2.0 | 1434 | $1,629 | $1.14 | 24d | 1 | 0.30mi |
| 5745 Maxfli Dr Schertz, TX | 3.0 | 2.0 | 1214 | $1,600 | $1.32 | 18d | 1 | 0.40mi |
Listing history 17 events
-
2026-05-16status Pending
-
2026-04-29historical Active Option
-
2026-04-02price $190,000
-
2026-03-17$200,000 New
-
2025-11-30historical
-
2025-11-05status Back on Market
-
2025-11-03historical
-
2025-10-03status Back on Market
-
2025-09-30historical Active Option
-
2025-08-21price $200,000
-
2025-06-26price $205,000
-
2025-04-18$235,000 New
-
2024-07-03historical
-
2024-06-14price $195,000
-
2024-05-26$185,000 New
-
2023-10-18soldstatus
-
1990-07-13soldstatus
ⓘ Source: listings_history table (triggers on properties + properties_extension) + one-shot
backfill from property_details.listing_events for pre-trigger history.
Tax reassessment forecast TX · Resets to sale price
- Current annual tax
- $2,168 · $181/mo
- Projected year-2 tax
- $3,477 · $290/mo
- Expected delta
- +$1,309/yr (+$109/mo · 60.4%)
ⓘ Screening estimate from a state-policy table — verify with the county assessor before closing.
Climate risk First Street
- Flood 1/10 Low FEMA zone X (unshaded) · 0% chance over 30 yrs
- Wildfire 5/10 Major
- Heat 8/10 Severe 7 d/yr ≥107°F today · 22 d/yr by 30 yrs out
- Wind 8/10 Severe 80% chance of damaging wind over 30 yrs
- Air quality 1/10 Low 0 unhealthy d/yr today · 0 by 30 yrs out
Nearby sold comps map
Loading sold comps map…
Walkable amenities ~0.75 mi
Loading nearby amenities…
Taxation est. · year 1
- Rental income
- $23,290
- − Mortgage interest
- −$10,643
- − Property taxes
- −$2,168
- − Insurance
- −$950
- − Repairs & maintenance
- −$1,863
- − Management
- −$1,863
- − Depreciation
- −$5,527
- Taxable income
- $276
- Est. tax owed @ 24.0%
- −$66
- After-tax cash flow
- $3,259/yr
For passive investors: Depreciation is non-cash, so a rental often shows a tax loss while cash-flowing — sheltering income. Rental losses are passive: they offset passive income freely, and up to $25,000/yr can offset ordinary (W-2) income if you actively participate and your MAGI is under $100k (phasing out to $0 by $150k); unused losses carry forward. On sale, claimed depreciation is recaptured at up to 25%, and gains may owe capital-gains tax (a 1031 exchange can defer both). Figures are a year-1 estimate at your 24.0% rate — not tax advice; consult a CPA.
Schools (NCES district)
- District
- Schertz-Cibolo-U City ISD
- NCES district ID
- 4839480
- Math proficiency
- 49% ▼ -12.00%
- Reading proficiency
- 48% ▼ -4.00%
- Median HH income
- $75,790
- Composite
- 44.02/100
- National rank
- #2886
- State rank
- #152 of 826 in TX
Livability — Schertz
- Score
- 73/100
- State rank
- #198
- US rank
- #5013
Category grades
Schools grade is shown separately in the Schools card above.
Census & demographics
- Census place
- Schertz, TX
- County
- Guadalupe County · 147,291 people
- City population
- 41,907
- Metro
- San Antonio-New Braunfels, TX
- Population (ZIP)
- 49,784
- Household income
- $113,004
- Rent vs Own
- Severe rent burden
- 521.0
Population outlook (Guadalupe County) Hauer SSP2
- Today (2025)
- 196,854 people
- By 2030
- 220,210 · +11.9%
- By 2040
- 268,004 · +36.1%
- By 2050
- 316,333 · +60.7%
- By 2075
- 434,747 · +120.8%
- By 2100
- 520,447 · +164.4%
Race, ethnicity, and origin ACS 2023
- Neighborhood character
- Diverse neighborhood (Simpson 0.68)
- Race & ethnicity
- White 46% Hispanic / Latino 30% Two or more races 22% Black 13% Asian 3%
- Hispanic origin (detail)
- Mexican 22% Puerto Rican 4%
- Common ancestry
- Italian 2% Lithuanian 2% Slovak 2%
- Foreign-born
- 7% · Canada, Vietnam, China
- Languages at home
- 83% English-only · Spanish 13% Vietnamese 1% German/W. Germanic 1%
Political lean MEDSL · Guadalupe
- 2024 margin
- Strong R (+29.5) · D 34.8% · R 64.3%
- 2008→2024 swing
- +1.5pp toward D · 2008: -31.0pp · 2024: -29.5pp
- All cycles
- 2024: R+29.5 2020: R+24.2 2016: R+31.8 2012: R+35.1 2008: R+31.0
Not yet ingested
- Civics
- —
Market trends
- HPI YoY
- ▲ 0.47%
- Current HPI
- 182.7296
- Rent YoY
- ▲ 2.42%
- Metro
- San Antonio-New Braunfels, TX
- State GDP YoY
- ▲ 3.95%
- F500 in state
- 110
Industry mix (Fortune 500 HQ in TX)
| Industry | F500 HQs | Revenue |
|---|---|---|
| Energy | 16 | $1,198B |
|
||
| Technology | 5 | $198B |
|
||
| Engineering / Construction | 4 | $72B |
|
||
| Energy Services | 3 | $60B |
|
||
| Utilities | 3 | $41B |
|
||
| Healthcare | 2 | $330B |
|
||
Price history
+2.7% since first listed17 events — show timeline
- 2026-05-16 Pending — LERA
- 2026-04-29 Contingent — LERA
- 2026-04-02 Price Changed $190,000 LERA
- 2026-03-17 Listed $200,000 LERA
- 2025-11-30 Listing Removed — LERA
- 2025-11-05 Relisted — LERA
- 2025-11-03 Listing Removed — LERA
- 2025-10-03 Relisted — LERA
- 2025-09-30 Contingent — LERA
- 2025-08-21 Price Changed $200,000 LERA
- 2025-06-26 Price Changed $205,000 LERA
- 2025-04-18 Listed $235,000 LERA
- 2024-07-03 Listing Removed — LERA
- 2024-06-14 Price Changed $195,000 LERA
- 2024-05-26 Listed $185,000 LERA
- 2023-10-18 Sold (Public Records) — Public Records
- 1990-07-13 Sold (Public Records) — Public Records
Property tax history
-2.9%/yrLatest (2026): $2,168 · -22.6% YoY. Source: county tax records.
Cash-flow waterfall
monthlySold comps — $/sqft
last 12 mo · ≤1 miLoading sold comps…