17921 NE 136th Ave · Waldo, FL
Flood risk 1/10 · Minimal
- FEMA flood zone
- X (unshaded)
- Chance of flooding over 30 yrs
- 0.0%
- Est. flood insurance / yr
- $507 – $1,088
Fire risk 9/10 · Severe
- Est. fire insurance / yr
- $947 – $1,759
Heat risk 8/10 · Major
- Hot days now (above 107°F)
- 7 days/yr
- Hot days in 30 yrs
- 21 days/yr
Wind risk 9/10 · Severe
- Chance of severe wind over 30 yrs
- 99.0%
Air-quality risk 3/10 · Minor
- Unhealthy air days now
- 2 days/yr
- Unhealthy air days in 30 yrs
- 3 days/yr
Risk factors via First Street. Map © Google.
Why this score? — see what drove the B+ grade
The composite is a weighted blend of 9 inputs, each scored 0–100. Each bar is that input's sub-score; the figure is the points it added to the 100-point composite (weight × sub-score).
- Cash flow +30.0/30.0
- 1% rule +10.0/10.0
- DSCR +10.0/10.0
- Appreciation +9.0/10.0
- ARV discount +7.5/15.0
- Schools +4.3/10.0
- Livability +3.2/5.0
- Rent growth +2.5/5.0
- Condition / age +2.5/5.0
$57,001
🖨 Deal sheet (PDF) 📄 Offer letter ✓ Due diligence
Listing remarks
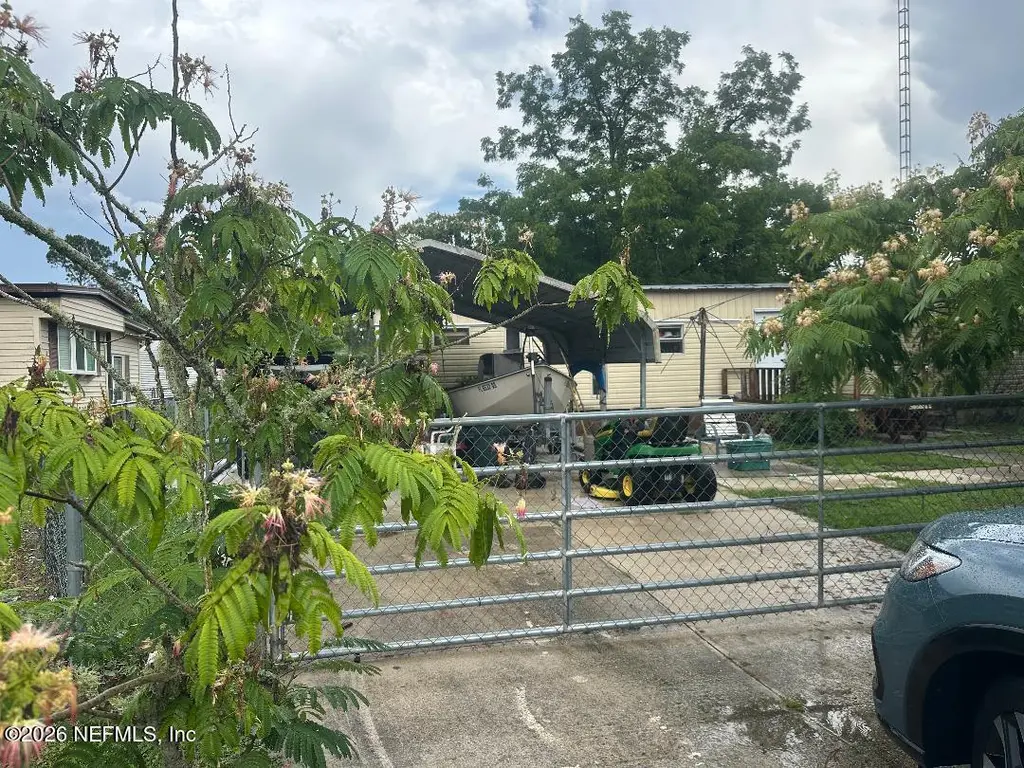
Investor opportunity in Alachua, FL priced to sell quickly. In good condition but needs TLC. Had central AC, but it is not operational currently. Property is being sold AS-IS and is in probate with an estimated closing timeframe of 60-90 days. Closing must occur within 15 days following completion of probate. Cash offers only. Buyer will be responsible for any personal property or debris remaining on the property after closing. Property includes several outbuildings. An addition was constructed; buyers are encouraged to conduct all due diligence regarding permits, square footage, zoning, condition, and any other matters affecting the property. Buyer to verify all information independently.
Key facts
- 0.24 acre lot
- 2 parking spots
- Built 1974
Property features AI
Finance
- HOA & community: Not a senior community
Exterior
- Parking: 2-space carport
- Utilities: Septic tank; Cable available; Electricity available
- Home design: Single wide manufactured home; One level
- Exterior features: Chain link fencing
Interior
- Kitchen: Electric cooktop; Electric oven; Refrigerator
- Bedrooms: 3 bedrooms
- Bathrooms: 2 full bathrooms
- Heating & cooling: Central heating; Central air; Wall/window air conditioning units
- Interior features: Electric dryer hookup
- Laundry & utility: Electric dryer hookup
Neighborhood map
What this means for you Summary
Snapshot
- This is a 2-bed/1.0-bath manufactured listed at $57k.
Deal economics
- At list price, monthly cash flow is $720 ($9k/yr) — positive.
- The deal already cash-flows at list — no discount required.
- Meets the 1% rule at list price ($1k rent vs $57k).
Location & tenants
- Location reads 63/100 on livability (#705 in FL) — a middle-class / working-renter tenant base. Strengths: cost of living A+, health & safety A+, housing B+; Watch: crime C-, schools F, amenities F.
- Alachua (urban): math 49% / reading 54% proficiency, ranked #30 of 73 in FL (top 41%) — acceptable for families but not a draw, mixed tenant base, ~2y average lease.
- Market conditions: 36 active listings in the ZIP; 1,774 units permitted in Alachua County in 2024 (984 in 5+ unit buildings).
Forward outlook
- In year one you build about $5k of equity ($394 loan paydown + $5k appreciation (8.0% local appreciation)).
- Alachua County population projected at +26% by 2050 — long-run rental-demand tailwind backs the buy-and-hold thesis.
- At projected returns (8.0% appreciation + 3.0% rent growth), your $16k cash investment doubles in ~2 years — after that, you're playing with house money.
- By year 7, paydown + projected appreciation supports a ~$34k cash-out refi (75% LTV) — recoverable capital for the next deal without selling this one.
Negotiation context
- Only 1 days on market — expect competitive offers; lowballing is unlikely to land.
Risks & watch-outs
- Watch-outs: property tax is 2.7% of price.
- Climate carrying-cost: severe wind risk, 99% chance of damaging wind over 30y; severe wildfire risk; extreme-heat days projected 7→21/yr by 2055 (HVAC capex compounding) — expect insurance premiums to compound above CPI over the hold.
Questions for the listing agent
- Built in 1974 — when were the roof, HVAC, electrical panel, plumbing, and water heater last replaced?
- Property tax is high relative to price — has the assessment been appealed recently, and will the sale trigger a re-assessment?
- Is there a deadline driving the sale (1031 exchange, divorce, estate, relocation)? That informs how much negotiation room exists.
- Schools are F-rated, which usually means shorter tenancies and higher turnover. Who's the typical renter profile here, and what's been the actual vacancy rate?
- What's the average days-on-market for RENTAL listings here right now (not sales)? A rising rental-DOM trend means longer vacancies and softer asking-rent achievability than the comps imply.
- What's the recent tenant-quality profile in this submarket — average credit score on applications, eviction rate, late-payment / NSF rate, and stable-employment percentage? A property-management company in the area should have these aggregated.
- How much new for-sale + rental construction is in the pipeline within 1–3 miles? Heavy new supply typically softens prices + rents 12–24 months out; constrained supply supports both.
Investment metrics
- 1% rule
- 2.60% ✓
- Cap rate
- 21.44%
- Cash-on-cash
- 54.11%
- DSCR
- 3.41
- GRM
- 3.2
CMA / ARV
No comps found within radius.
Projected returns pro-forma
8.01% appreciation · 3.0% rent growth · sell at horizon
- IRR
- 64.9%
- Equity multiple
- 5.35×
- Total profit
- $69,421
- Equity at exit
- $43,353
- IRR
- 60.1%
- Equity multiple
- 11.49×
- Total profit
- $167,477
- Equity at exit
- $86,100
Cash invested: $15,960 (down + closing). Projections, not guarantees.
Landlord ↔ Tenant lean methodology
- Overall (STATE)
- 87 Strongly Landlord-Friendly
- State Florida
- 87 Strongly Landlord-Friendly · R+3
- County
- — inherits STATE
- City
- — inherits STATE
ZIP-level market 32694
- Home prices YoY
- 3.7%
- Active inventory
- 36
- Price-to-rent
- 3.2×
Monthly cashflow live
- Estimated rent
- $1,480 medium interval (Pro) →
- Mortgage (P&I)
- −$299
- Tax from tax record
- −$127 /mo · $1,521/yr
- Insurance
- −$24
- HOA
- −$0
- Vacancy / Maint / Mgmt
- −$311
- Net cashflow
- $720
Break-even live
Sensitivity live
| Price | -10% $752 | -5% $736 | +0% $720 | +5% $704 | +10% $687 |
|---|---|---|---|---|---|
| Rent | -10% $603 | -5% $661 | +0% $720 | +5% $778 | +10% $837 |
| Rate | -1.0pp $748 | -0.5pp $734 | base $720 | +0.5pp $705 | +1.0pp $690 |
UW: 25.0% down · 7.5% · 30yr · 1.5% tax · 5.0% vac · 8.0% maint · 8.0% mgmt
Financing live
Cash to close
- Down payment
- $14,250
- Closing costs
- $1,710
- Reserves months
- —
- Total cash needed
- —
Loan-product check · same deal, 3 products live
Conventional
25% down · 7.5% · 30yr
- Down + closing
- —
- Monthly P&I
- —
- Monthly cashflow
- —
- DSCR
- —
- Eligible?
- —
Personal DTI + credit; lowest rate.
DSCR
20% down · 8.5% · 30yr
- Down + closing
- —
- Monthly P&I
- —
- Monthly cashflow
- —
- DSCR
- —
- Eligible?
- —
No personal income docs; deal must DSCR.
Hard money
10% down · 12.0% · 12mo
- Down + closing
- —
- Monthly P&I
- —
- Monthly cashflow
- —
- DSCR
- —
- Eligible?
- —
Short-term bridge; refi at stabilization.
Listing history 12 events
-
2026-06-18remarks 699-char remark
-
2026-06-18days on market $57,001 Active 1 DOM
-
2026-06-15days on market $57,001 Active 13 DOM
-
2026-06-14days on market $57,001 Active 11 DOM
-
2026-06-13days on market $57,001 Active 10 DOM
-
2026-06-10days on market $57,001 Active 8 DOM
-
2026-06-09days on market $57,001 Active 7 DOM
-
2026-06-08days on market $57,001 Active 6 DOM
-
2026-06-07days on market $57,001 Active 5 DOM
-
2026-06-05days on market $57,001 Active 2 DOM
-
2026-06-03remarks 578-char remark
-
2026-06-03$57,001 Active 1 DOM
ⓘ Source: listings_history table (triggers on properties + properties_extension) + one-shot
backfill from property_details.listing_events for pre-trigger history.
Tax reassessment forecast FL · Resets to sale price
- Current annual tax
- $1,521 · $127/mo
- Projected year-2 tax
- $1,521 · $127/mo
- Expected delta
- $0/yr ($0/mo · 0.0%)
ⓘ Screening estimate from a state-policy table — verify with the county assessor before closing.
Climate risk First Street
- Flood 1/10 Low FEMA zone X (unshaded) · 0% chance over 30 yrs
- Wildfire 9/10 Extreme
- Heat 8/10 Severe 7 d/yr ≥107°F today · 21 d/yr by 30 yrs out
- Wind 9/10 Extreme 99% chance of damaging wind over 30 yrs
- Air quality 3/10 Moderate 2 unhealthy d/yr today · 3 by 30 yrs out
Nearby sold comps map
Loading sold comps map…
Walkable amenities ~0.75 mi
Loading nearby amenities…
Taxation est. · year 1
- Rental income
- $17,759
- − Mortgage interest
- −$3,193
- − Property taxes
- −$1,521
- − Insurance
- −$285
- − Repairs & maintenance
- −$1,421
- − Management
- −$1,421
- − Depreciation
- −$1,658
- Taxable income
- $8,260
- Est. tax owed @ 24.0%
- −$1,982
- After-tax cash flow
- $6,654/yr
For passive investors: Depreciation is non-cash, so a rental often shows a tax loss while cash-flowing — sheltering income. Rental losses are passive: they offset passive income freely, and up to $25,000/yr can offset ordinary (W-2) income if you actively participate and your MAGI is under $100k (phasing out to $0 by $150k); unused losses carry forward. On sale, claimed depreciation is recaptured at up to 25%, and gains may owe capital-gains tax (a 1031 exchange can defer both). Figures are a year-1 estimate at your 24.0% rate — not tax advice; consult a CPA.
Schools (NCES district)
- District
- Alachua
- NCES district ID
- 1200030
- Math proficiency
- 49% ▼ -9.00%
- Reading proficiency
- 54% ▼ -3.00%
- Median HH income
- $42,683
- Composite
- 43.31/100
- National rank
- #3038
- State rank
- #30 of 73 in FL
Livability — Waldo
- Score
- 63/100
- State rank
- #705
- US rank
- #14963
Category grades
Schools grade is shown separately in the Schools card above.
Census & demographics
- Population (ZIP)
- 1,870
Population outlook (Alachua County) Hauer SSP2
- Today (2025)
- 289,834 people
- By 2030
- 305,873 · +5.5%
- By 2040
- 335,246 · +15.7%
- By 2050
- 364,719 · +25.8%
- By 2075
- 436,665 · +50.7%
- By 2100
- 482,920 · +66.6%
Race, ethnicity, and origin ACS 2023
- Neighborhood character
- Predominantly White (77%)
- Race & ethnicity
- White 77% Black 11% Hispanic / Latino 8% Two or more races 5% Asian 1%
- Hispanic origin (detail)
- Mexican 2% Puerto Rican 3% Cuban 3%
- Common ancestry
- Slovak 4% Italian 3% Iranian 2%
- Foreign-born
- 4% · Canada, South Korea
- Languages at home
- 92% English-only · Spanish 5% Russian/Polish/Slavic 2% Korean 1%
Political lean MEDSL · Alachua
- 2024 margin
- Strong D (+21.0) · D 59.7% · R 38.8% · Other 1.5%
- 2008→2024 swing
- -0.6pp no change · 2008: 21.6pp · 2024: 21.0pp
- All cycles
- 2024: D+21.0 2020: D+27.2 2016: D+22.5 2012: D+17.3 2008: D+21.6
Not yet ingested
- Civics
- —
Market trends
- HPI YoY
- ▲ 8.01%
- Current HPI
- 224.7473
- Rent YoY
- —
- Metro
- —
- State GDP YoY
- ▲ 3.28%
- F500 in state
- 36
Industry mix (Fortune 500 HQ in FL)
| Industry | F500 HQs | Revenue |
|---|---|---|
| Industrial Technology | 2 | $29B |
|
||
| Insurance | 2 | $17B |
|
||
| Retail | 1 | $60B |
|
||
| Technology Distribution | 1 | $58B |
|
||
| Homebuilding | 1 | $35B |
|
||
| Technology Manufacturing | 1 | $35B |
|
||
Price history
1 event — show timeline
- 2026-06-02 Listed $57,001 realMLS
Property tax history
+29.0%/yrLatest (2025): $1,521 · +2.1% YoY. Source: county tax records.
Cash-flow waterfall
monthlySold comps — $/sqft
last 12 mo · ≤1 miLoading sold comps…