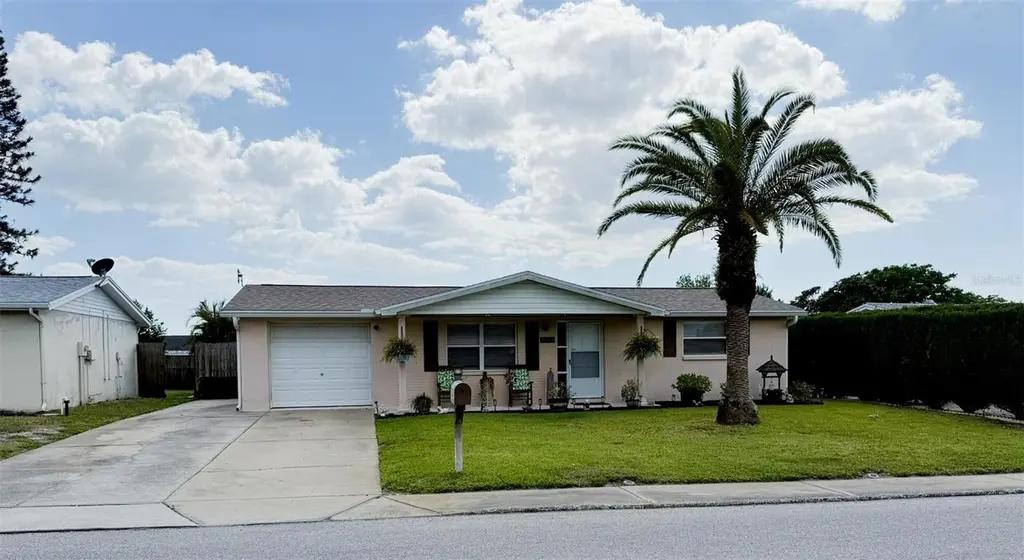
9721 Lake Chrise Ln · Jasmine Estates, FL
Flood risk 3/10 · Minor
- FEMA flood zone
- X (unshaded)
- Chance of flooding over 30 yrs
- 0.09%
- Est. flood insurance / yr
- $507 – $1,088
Fire risk 3/10 · Minor
- Est. fire insurance / yr
- $947 – $1,759
Heat risk 10/10 · Severe
- Hot days now (above 109°F)
- 7 days/yr
- Hot days in 30 yrs
- 26 days/yr
Wind risk 10/10 · Severe
- Chance of severe wind over 30 yrs
- 99.0%
Air-quality risk 2/10 · Minimal
- Unhealthy air days now
- 1 days/yr
- Unhealthy air days in 30 yrs
- 3 days/yr
Risk factors via First Street. Map © Google.
Why this score? — see what drove the D grade
The composite is a weighted blend of 9 inputs, each scored 0–100. Each bar is that input's sub-score; the figure is the points it added to the 100-point composite (weight × sub-score).
- Cash flow +12.9/30.0
- ARV discount +7.9/15.0
- Schools +4.3/10.0
- DSCR +3.9/10.0
- Livability +3.4/5.0
- Rent growth +2.8/5.0
- Condition / age +2.5/5.0
- 1% rule +2.4/10.0
- Appreciation +0.0/10.0
$229,000
🖨 Deal sheet 📄 Offer letter ✓ Due diligence
Listing remarks MLS
Short Sale - What a doll house! Inside has been completely renovated with tile throughout, except bedrooms. New kitchen, tile, paint, pool deck, sprinkler system in front, new sod. Beautiful screen enclosed pool with deck space for entertaining, double driveway. Room was replaced in 2007. This home has been loved!
Key facts
- Large deck space
- Sliding glass door
- Extra cabinets
Tags
Property features AI
Finance
- Other: Zoning: R4; Property type: Residential — Single Family Residence
- Financial info: No lease restrictions reported
- HOA & community: No HOA/association reported; Pets allowed (cats and dogs)
Exterior
- Parking: Attached garage (1 car)
- Security: Security lights
- Utilities: Public water; Public sewer; Cable connected; Electricity connected
- Home design: Single-family residence; One story; Faces east
- Construction: Block and stucco construction; Shingle roof; Built on slab foundation; Approximately 0.12 acre lot
- Exterior features: Private gunite pool; Irrigation equipment; Paved public road access
Interior
- Kitchen: Dishwasher; Microwave; Range; Refrigerator
- Bedrooms: 2 bedrooms
- Flooring: Laminate; Slab foundation
- Bathrooms: 2 full bathrooms
- Heating & cooling: Central heating; Central air conditioning
- Interior features: Ceiling fans; Open floorplan; Window treatments; Blinds
- Laundry & utility: Washer hookup; Laundry area in garage
Neighborhood map
What this means for you Summary
Snapshot
- This is a 2-bed/1.0-bath single-family listed at $229k.
Deal economics
- At list price, monthly cash flow is $-16 ($-196/yr) — negative.
- To cash-flow at today's rent, offer at most $226k (1.3% below list).
- To meet the 1% rule (rent ≥ 1% of price), the offer needs to be $170k (25.9% below list).
- Recommended offer: $170k (25.9% below list) — sets the bar for 1% rule.
- Cap rate 6.2% vs local median 4.7% in Jasmine Estates — top-decile yield for the area; either an underpriced asset or a hidden risk that comps aren't pricing in. Stress-test before assuming the spread holds.
Location & tenants
- Location reads 67/100 on livability (#555 in FL) — a middle-class / working-renter tenant base. Strengths: cost of living A+, housing A+, health & safety A+; Watch: crime D+, schools F, amenities F.
- Pasco (suburban): math 50% / reading 52% proficiency, ranked #32 of 73 in FL (top 44%) — acceptable for families but not a draw, mixed tenant base, ~2y average lease.
- Market conditions: Rents rising (+1.3%/yr); 577 active listings in the ZIP; 40 comparable units currently listed for rent nearby; rentals at typical pace (median 22d on market — plan ~3-4 weeks tenant-placement turnaround); 6,765 units permitted in Pasco County in 2024 (1,250 in 5+ unit buildings).
- This rent runs 43% of the median local income ($47k/yr) — at the standard rent-burdened threshold; future hikes will face affordability resistance.
Forward outlook
- Local home prices are declining (-3.0%/yr); year-one equity from $2k of loan paydown is wiped out by about $7k of value loss. Plan a longer hold.
- Pasco County population projected at +29% by 2050 — long-run rental-demand tailwind backs the buy-and-hold thesis.
Negotiation context
- It's been on market 17 days — a 2% lower offer ($226k) is reasonable based on typical stale-listing flexibility.
- 3 sale attempts since 18y ago with the ask held roughly flat each time — persistent listings suggest the price (not the market) is what's stuck; bring a comps-based counter.
- Current owner paid $72k; list at $229k implies a 218% gain — meaningful room to come down on a strong offer.
Risks & watch-outs
- Climate carrying-cost: severe wind risk, 99% chance of damaging wind over 30y; extreme-heat days projected 7→26/yr by 2055 (HVAC capex compounding) — expect insurance premiums to compound above CPI over the hold.
Questions for the listing agent
- What do current leases actually rent for vs. the listed asking? Can we see a recent rent roll and the last 12 months of T-12 income?
- Built in 1977 — when were the roof, HVAC, electrical panel, plumbing, and water heater last replaced?
- Is there a deadline driving the sale (1031 exchange, divorce, estate, relocation)? That informs how much negotiation room exists.
- Schools are F-rated, which usually means shorter tenancies and higher turnover. Who's the typical renter profile here, and what's been the actual vacancy rate?
- Crime grade is D in this area — have there been break-ins, vandalism, or insurance claims at this property in the last 3 years? What carrier currently insures it and at what premium?
- The area grade is low — what's the realistic commute time and amenity access for the typical tenant pool here? Any planned neighborhood developments (good or bad) we should know about?
- What's the average days-on-market for RENTAL listings here right now (not sales)? A rising rental-DOM trend means longer vacancies and softer asking-rent achievability than the comps imply.
- What's the recent tenant-quality profile in this submarket — average credit score on applications, eviction rate, late-payment / NSF rate, and stable-employment percentage? A property-management company in the area should have these aggregated.
- How much new for-sale + rental construction is in the pipeline within 1–3 miles? Heavy new supply typically softens prices + rents 12–24 months out; constrained supply supports both.
Investment metrics
- 1% rule
- 0.74% ✗
- Cap rate
- 6.21%
- Cash-on-cash
- -0.31%
- DSCR
- 0.99
- GRM
- 11.2
CMA / ARV
- ARV (on-the-fly)
- $231,168
- Comps found
- 12
Show comp detail 12 sales within ~0.75 mi
| Address | Dist | Beds/Ba | Sqft | Sold | Price | $/sf | Match |
|---|---|---|---|---|---|---|---|
| 9842 Richwood Ln | 0.33mi | 2/2.0 | 1,020 (-1%) | 2mo | $230,000 | $225 | 77 |
| 8018 Valmy Ln | 0.45mi | 2/2.0 | 1,106 (+7%) | 2mo | $237,500 | $215 | 62 |
| 9430 Gray Fox Ln | 0.38mi | 3/1.0 (+1) | 936 (-9%) | 2mo | $200,000 | $214 | 61 |
| 9637 Marlinton Ln | 0.33mi | 2/1.0 | 888 (-14%) | 2mo | $125,000 | $141 | 60 |
| 10126 Hoop Ct | 0.44mi | 2/2.0 | 1,135 (+10%) | 1mo | $274,000 | $241 | 58 |
| 9405 Gableton Ln | 0.46mi | 2/2.0 | 1,133 (+10%) | 1mo | $250,000 | $221 | 57 |
| 9426 Glen Moor Ln | 0.38mi | 2/2.0 | 898 (-13%) | 1mo | $200,000 | $223 | 56 |
| 9308 Wolcott Ln | 0.71mi | 2/2.0 | 990 (-4%) | 2mo | $222,000 | $224 | 55 |
| 8025 Durham Dr | 0.47mi | 2/1.0 | 888 (-14%) | 2mo | $200,000 | $225 | 53 |
| 7121 Rockwood Dr | 0.59mi | 2/1.0 | 920 (-11%) | 2mo | $219,000 | $238 | 53 |
| 7231 Oak Crest Dr | 0.68mi | 2/2.0 | 1,100 (+7%) | 2mo | $194,900 | $177 | 51 |
| 7835 Lotus Dr | 0.71mi | 3/2.0 (+1) | 1,087 (+5%) | 1mo | $269,900 | $248 | 48 |
Match score weights: distance 35% · size 25% · config 20% · recency 20%. Top-matched comps best support the ARV.
Projected returns pro-forma
-3.0% appreciation · 1.28% rent growth · sell at horizon
- IRR
- -18.5%
- Equity multiple
- 0.36×
- Total profit
- $-41,148
- Equity at exit
- $34,145
- IRR
- -14.3%
- Equity multiple
- 0.23×
- Total profit
- $-49,075
- Equity at exit
- $19,800
Cash invested: $64,120 (down + closing). Projections, not guarantees.
Landlord ↔ Tenant lean methodology
- Overall (STATE)
- 87 Strongly Landlord-Friendly
- State Florida
- 87 Strongly Landlord-Friendly · R+3
- County
- — inherits STATE
- City
- — inherits STATE
ZIP-level market 34668
- Home prices YoY
- -17.4%
- Rents YoY
- 1.3%
- Active inventory
- 577
- Price-to-rent
- 11.2×
Monthly cashflow live
- Estimated rent
- $1,697 high interval (Pro) →
- Mortgage (P&I)
- −$1,201
- Tax from tax record
- −$61 /mo · $729/yr
- Insurance
- −$95
- HOA
- −$0
- Vacancy / Maint / Mgmt
- −$356
- Net cashflow
- $-16
Break-even live
UW: 25.0% down · 7.5% · 30yr · 1.5% tax · 5.0% vac · 8.0% maint · 8.0% mgmt
Financing live
Cash to close
- Down payment
- $57,250
- Closing costs
- $6,870
- Reserves months
- —
- Total cash needed
- —
Loan-product check · same deal, 3 products live
Conventional
25% down · 7.5% · 30yr
- Down + closing
- —
- Monthly P&I
- —
- Monthly cashflow
- —
- DSCR
- —
- Eligible?
- —
Personal DTI + credit; lowest rate.
DSCR
20% down · 8.5% · 30yr
- Down + closing
- —
- Monthly P&I
- —
- Monthly cashflow
- —
- DSCR
- —
- Eligible?
- —
No personal income docs; deal must DSCR.
Hard money
10% down · 12.0% · 12mo
- Down + closing
- —
- Monthly P&I
- —
- Monthly cashflow
- —
- DSCR
- —
- Eligible?
- —
Short-term bridge; refi at stabilization.
Rent comps 40 comps
| Address | Beds | Baths | Sqft | Rent | $/sqft | DOM | Units | Dist |
|---|---|---|---|---|---|---|---|---|
| 9820 Rainbow Ln Port Richey, FL | 2.0 | 1.0 | 1300 | $1,325 | $1.02 | 15d | 1 | 0.22mi |
| 9615 Gray Fox Ln Port Richey, FL | 2.0 | 1.0 | 744 | $1,550 | $2.08 | 3d | 1 | 0.27mi |
| 7325 Ivanhoe Dr Port Richey, FL | 3.0 | 1.0 | 984 | $1,800 | $1.83 | 11d | 1 | 0.39mi |
| 8019 Portage Dr Port Richey, FL | 2.0 | 2.0 | 1078 | $2,000 | $1.86 | 16d | 1 | 0.40mi |
| 7224 Potomac Dr Port Richey, FL | 3.0 | 2.0 | 1208 | $1,595 | $1.32 | 24d | 1 | 0.48mi |
| 10225 Gardenia Ln Port Richey, FL | 3.0 | 1.0 | 1042 | $1,495 | $1.43 | 15d | 1 | 0.49mi |
| 8151 Hixton Dr Port Richey, FL | 3.0 | 1.0 | 1080 | $1,699 | $1.57 | 16d | 1 | 0.51mi |
| 7301 Moravian Dr Port Richey, FL | 3.0 | 2.0 | 1325 | $1,806 | $1.36 | 5d | 1 | 0.51mi |
| 10303 Gardenia Ln Port Richey, FL | 3.0 | 2.0 | 1054 | $1,950 | $1.85 | 24d | 1 | 0.54mi |
| 7605 Embassy Blvd Unit 1 Port Richey, FL | 3.0 | 2.0 | 1469 | $2,350 | $1.60 | 24d | 1 | 0.55mi |
| 7605 Embassy Blvd Port Richey, FL | 3.0 | 2.0 | 1278 | $2,350 | $1.84 | 12d | 1 | 0.55mi |
| 8026 Colrain Dr Port Richey, FL | 3.0 | 1.0 | 1080 | $1,545 | $1.43 | 24d | 1 | 0.57mi |
| 9202 Suffolk Ln Port Richey, FL | 2.0 | 2.0 | 1038 | $1,450 | $1.40 | 15d | 1 | 0.58mi |
| 9202 Suffolk Ln Port Richey, FL | 2.0 | 2.0 | 1038 | $1,450 | $1.40 | 24d | 1 | 0.58mi |
| 9211 Chatam Ln Port Richey, FL | 3.0 | 2.0 | 1176 | $2,215 | $1.88 | 20d | 1 | 0.59mi |
| 9310 Whitman Ln Port Richey, FL | 3.0 | 1.0 | 980 | $1,350 | $1.38 | 11d | 1 | 0.62mi |
| 8247 Saybrook Dr Port Richey, FL | 3.0 | 1.0 | 980 | $1,550 | $1.58 | 24d | 1 | 0.63mi |
| 9130 Chatam Ln Port Richey, FL | 2.0 | 2.0 | 1212 | $1,623 | $1.34 | 22d | 1 | 0.63mi |
| 9300 Whitman Ln Port Richey, FL | 3.0 | 1.0 | 920 | $1,695 | $1.84 | 24d | 1 | 0.63mi |
| 9105 Hermitage Ln Port Richey, FL | 3.0 | 2.0 | 1442 | $1,900 | $1.32 | 24d | 1 | 0.65mi |
| 7040 Brentwood Dr Unit NA Port Richey, FL | 2.0 | 1.0 | 880 | $1,600 | $1.82 | 20d | 1 | 0.66mi |
| 9100 Hunt Club Ln Port Richey, FL | 2.0 | 2.0 | 1365 | $1,850 | $1.36 | 22d | 1 | 0.67mi |
| 10401 Oleander Dr Port Richey, FL | 2.0 | 1.0 | 887 | $1,250 | $1.41 | 24d | 1 | 0.67mi |
| 7501 San Moritz Dr Port Richey, FL | 3.0 | 2.0 | 1412 | $1,600 | $1.13 | 24d | 1 | 0.72mi |
| 8422 Paxton Dr Port Richey, FL | 2.0 | 1.0 | 744 | $1,800 | $2.42 | 24d | 1 | 0.73mi |
| 8437 Luray Dr Port Richey, FL | 2.0 | 1.0 | 1038 | $1,595 | $1.54 | 4d | 1 | 0.75mi |
| 9103 Westby Ln Port Richey, FL | 2.0 | 1.0 | 840 | $1,995 | $2.38 | 24d | 1 | 0.76mi |
| 10502 Laburnum Dr Port Richey, FL | 2.0 | 2.0 | 1002 | $1,545 | $1.54 | 24d | 1 | 0.78mi |
| 10110 Cherry Creek Ln Port Richey, FL | 3.0 | 1.0 | 1260 | $1,600 | $1.27 | 5d | 1 | 0.78mi |
| 6920 Tierra Verde St Port Richey, FL | 3.0 | 2.0 | 1478 | $1,850 | $1.25 | 24d | 1 | 0.79mi |
| 7839 Canna Dr Port Richey, FL | 2.0 | 2.0 | 1095 | $1,450 | $1.32 | 11d | 1 | 0.79mi |
| 6935 Twilite Dr Port Richey, FL | 2.0 | 1.0 | 1032 | $1,450 | $1.41 | 16d | 1 | 0.80mi |
| 7435 San Miguel Dr Port Richey, FL | 2.0 | 2.0 | 1136 | $1,500 | $1.32 | 20d | 1 | 0.80mi |
| 7034 Coral Reef Dr Port Richey, FL | 3.0 | 2.0 | 1325 | $1,795 | $1.35 | 24d | 1 | 0.80mi |
| 7808 Talisman Dr Port Richey, FL | 3.0 | 2.0 | 1063 | $2,100 | $1.98 | 24d | 1 | 0.85mi |
| 8910 Elm Leaf Ct Port Richey, FL | 2.0 | 2.0 | 1248 | $1,650 | $1.32 | 5d | 1 | 0.85mi |
| 7416 Star Dust Dr Port Richey, FL | 3.0 | 2.0 | 1300 | $1,650 | $1.27 | 22d | 1 | 0.89mi |
| 6831 Tierra Linda St Port Richey, FL | 3.0 | 2.0 | 1478 | $1,595 | $1.08 | 24d | 1 | 0.89mi |
| 10629 Cymbid Dr Port Richey, FL | 3.0 | 2.0 | 1400 | $1,700 | $1.21 | 24d | 1 | 0.90mi |
| 9425 Saint Regis Ln Port Richey, FL | 2.0 | 2.0 | 1380 | $1,700 | $1.23 | 24d | 1 | 0.91mi |
Listing history 12 events
-
2026-05-02status Pending
-
2026-04-25price $229,000
-
2026-04-15$239,000 Active
-
2014-11-10soldstatus $72,000
-
2014-10-31soldstatus $72,000 Sold 317-char remark
Show marketing remark (317 chars)
Short Sale - What a doll house! Inside has been completely renovated with tile throughout, except bedrooms. New kitchen, tile, paint, pool deck, sprinkler system in front, new sod. Beautiful screen enclosed pool with deck space for entertaining, double driveway. Room was replaced in 2007. This home has been loved!
-
2014-08-16status Pending 317-char remark
Show marketing remark (317 chars)
Short Sale - What a doll house! Inside has been completely renovated with tile throughout, except bedrooms. New kitchen, tile, paint, pool deck, sprinkler system in front, new sod. Beautiful screen enclosed pool with deck space for entertaining, double driveway. Room was replaced in 2007. This home has been loved!
-
2014-08-13$59,900 Active 317-char remark
Show marketing remark (317 chars)
Short Sale - What a doll house! Inside has been completely renovated with tile throughout, except bedrooms. New kitchen, tile, paint, pool deck, sprinkler system in front, new sod. Beautiful screen enclosed pool with deck space for entertaining, double driveway. Room was replaced in 2007. This home has been loved!
-
2008-04-10soldstatus $115,000 256-char remark
Show marketing remark (256 chars)
New roof, Windows and doors and storm shutters for all the windows. New kitchen cabinets and counter tops with new appliances. New ceramic tile everywhere but the bedrooms which have new carpet. In ground pool with new gunite finish that isscreen enclosed.
-
2008-01-02$115,000 256-char remark
Show marketing remark (256 chars)
New roof, Windows and doors and storm shutters for all the windows. New kitchen cabinets and counter tops with new appliances. New ceramic tile everywhere but the bedrooms which have new carpet. In ground pool with new gunite finish that isscreen enclosed.
-
2005-09-19soldstatus $110,000
-
2005-06-07soldstatus $60,000
-
1999-12-28soldstatus $59,300
ⓘ Source: listings_history table (triggers on properties + properties_extension) + one-shot
backfill from property_details.listing_events for pre-trigger history.
Tax reassessment forecast FL · Resets to sale price
- Current annual tax
- $729 · $61/mo
- Projected year-2 tax
- $1,901 · $158/mo
- Expected delta
- +$1,172/yr (+$98/mo · 160.8%)
ⓘ Screening estimate from a state-policy table — verify with the county assessor before closing.
Climate risk First Street
- Flood 3/10 Moderate FEMA zone X (unshaded) · 9% chance over 30 yrs
- Wildfire 3/10 Moderate
- Heat 10/10 Extreme 7 d/yr ≥109°F today · 26 d/yr by 30 yrs out
- Wind 10/10 Extreme 99% chance of damaging wind over 30 yrs
- Air quality 2/10 Low 1 unhealthy d/yr today · 3 by 30 yrs out
Nearby sold comps map
Loading sold comps map…
Walkable amenities ~0.75 mi
Loading nearby amenities…
Taxation est. · year 1
- Rental income
- $20,366
- − Mortgage interest
- −$12,828
- − Property taxes
- −$729
- − Insurance
- −$1,145
- − Repairs & maintenance
- −$1,629
- − Management
- −$1,629
- − Depreciation
- −$6,662
- Taxable loss
- −$4,256
- Est. tax savings @ 24.0%
- +$1,021
- After-tax cash flow
- $826/yr
For passive investors: Depreciation is non-cash, so a rental often shows a tax loss while cash-flowing — sheltering income. Rental losses are passive: they offset passive income freely, and up to $25,000/yr can offset ordinary (W-2) income if you actively participate and your MAGI is under $100k (phasing out to $0 by $150k); unused losses carry forward. On sale, claimed depreciation is recaptured at up to 25%, and gains may owe capital-gains tax (a 1031 exchange can defer both). Figures are a year-1 estimate at your 24.0% rate — not tax advice; consult a CPA.
Schools (NCES district)
- District
- Pasco
- NCES district ID
- 1201530
- Math proficiency
- 50% ▼ -10.00%
- Reading proficiency
- 52% ▼ -5.00%
- Median HH income
- $45,039
- Composite
- 43.14/100
- National rank
- #3074
- State rank
- #32 of 73 in FL
Livability — Jasmine Estates
- Score
- 67/100
- State rank
- #555
- US rank
- #10561
Category grades
Schools grade is shown separately in the Schools card above.
Census & demographics
- Census place
- Jasmine Estates, FL
- County
- Pasco County · 524,098 people
- Metro
- Tampa-St. Petersburg-Clearwater, FL
- Population (ZIP)
- 49,442
- Household income
- $47,401
- Rent vs Own
- Severe rent burden
- 2699.0
Population outlook (Pasco County) Hauer SSP2
- Today (2025)
- 570,045 people
- By 2030
- 605,844 · +6.3%
- By 2040
- 674,806 · +18.4%
- By 2050
- 736,022 · +29.1%
- By 2075
- 862,900 · +51.4%
- By 2100
- 906,364 · +59.0%
Race, ethnicity, and origin ACS 2023
- Neighborhood character
- Predominantly White (70%)
- Race & ethnicity
- White 70% Hispanic / Latino 23% Two or more races 14% Black 4%
- Hispanic origin (detail)
- Mexican 3% Puerto Rican 10% Cuban 5% Dominican 1%
- Common ancestry
- Romanian 3% Lithuanian 3% Slovak 2%
- Foreign-born
- 11% · Canada, Jamaica
- Languages at home
- 82% English-only · Spanish 14% Other Indo-European 1% French/Haitian/Cajun 1%
Political lean MEDSL · Pasco
- 2024 margin
- Strong R (+25.2) · D 36.9% · R 62.1% · Other 1.0%
- 2008→2024 swing
- -21.6pp toward R · 2008: -3.6pp · 2024: -25.2pp
- All cycles
- 2024: R+25.2 2020: R+20.1 2016: R+21.6 2012: R+6.7 2008: R+3.6
Not yet ingested
- Civics
- —
Market trends
- HPI YoY
- ▼ -75.64%
- Current HPI
- 359.7163
- Rent YoY
- ▲ 1.28%
- Metro
- Tampa-St. Petersburg-Clearwater, FL
- State GDP YoY
- ▲ 3.28%
- F500 in state
- 36
Industry mix (Fortune 500 HQ in FL)
| Industry | F500 HQs | Revenue |
|---|---|---|
| Industrial Technology | 2 | $29B |
|
||
| Insurance | 2 | $17B |
|
||
| Retail | 1 | $60B |
|
||
| Technology Distribution | 1 | $58B |
|
||
| Homebuilding | 1 | $35B |
|
||
| Technology Manufacturing | 1 | $35B |
|
||
Price history
+286.2% since first listed12 events — show timeline
- 2026-05-02 Pending — Stellar MLS as Distributed by MLS Grid
- 2026-04-25 Price Changed $229,000 Stellar MLS as Distributed by MLS Grid
- 2026-04-15 Listed $239,000 Stellar MLS as Distributed by MLS Grid
- 2014-11-10 Sold (Public Records) $72,000 Public Records
- 2014-10-31 Sold (MLS) $72,000 Stellar MLS as Distributed by MLS Grid
- 2014-08-16 Pending — Stellar MLS as Distributed by MLS Grid
- 2014-08-13 Listed $59,900 Stellar MLS as Distributed by MLS Grid
- 2008-04-10 Sold (MLS) $115,000 Stellar MLS as Distributed by MLS Grid
- 2008-01-02 Listed $115,000 Stellar MLS as Distributed by MLS Grid
- 2005-09-19 Sold (Public Records) $110,000 Public Records
- 2005-06-07 Sold (Public Records) $60,000 Public Records
- 1999-12-28 Sold (Public Records) $59,300 Public Records
Property tax history
+5.4%/yrLatest (2025): $729 · +2.0% YoY. Source: county tax records.
Cash-flow waterfall
monthlySold comps — $/sqft
last 12 mo · ≤1 miLoading sold comps…