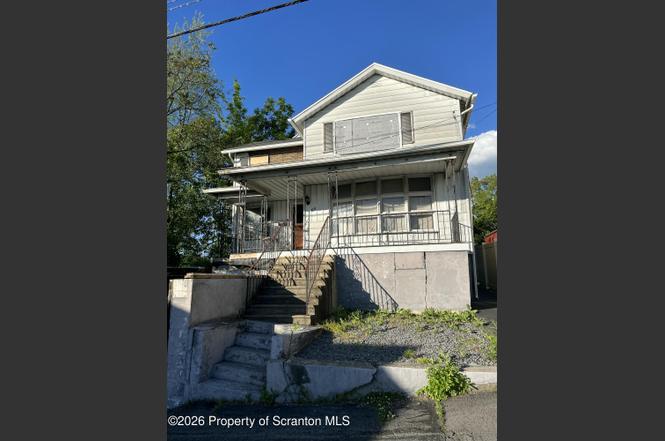
65 Reynolds St · Hughestown, PA
Flood risk 1/10 · Minimal
- FEMA flood zone
- X (unshaded)
- Chance of flooding over 30 yrs
- 0.0%
- Est. flood insurance / yr
- $507 – $1,088
Fire risk 2/10 · Minimal
- Est. fire insurance / yr
- $511 – $949
Heat risk 3/10 · Minor
- Hot days now (above 96°F)
- 7 days/yr
- Hot days in 30 yrs
- 16 days/yr
Wind risk 3/10 · Minor
- Chance of severe wind over 30 yrs
- 4.0%
Air-quality risk 2/10 · Minimal
- Unhealthy air days now
- 1 days/yr
- Unhealthy air days in 30 yrs
- 2 days/yr
Risk factors via First Street. Map © Google.
Why this score? — see what drove the B- grade
The composite is a weighted blend of 9 inputs, each scored 0–100. Each bar is that input's sub-score; the figure is the points it added to the 100-point composite (weight × sub-score).
- Cash flow +30.0/30.0
- 1% rule +10.0/10.0
- DSCR +10.0/10.0
- ARV discount +7.5/15.0
- Livability +3.9/5.0
- Schools +3.0/10.0
- Rent growth +2.5/5.0
- Condition / age +2.5/5.0
- Appreciation +0.0/10.0
$49,000
🖨 Deal sheet 📄 Offer letter ✓ Due diligence
Listing remarks
Builder / Investor Special in Hughestown! Excellent opportunity for builders, contractors, flippers, or experienced rehabbers seeking a project with significant upside potential. The property features an existing front home and attached two-car garage space, while the rear addition presents an exciting opportunity to redesign, renovate, or reconfigure the space to maximize functionality and value. Preliminary excavation and foundation work have already been completed, providing a head start for the next owner to bring their vision to life. Preliminary floor plans prepared by the seller are available for review. Plans have not been submitted to the municipality. Buyers are responsible for co
Key facts
- Rear addition
- Foundation work
- 6,098 sq ft lot
Tags
Property features AI
Finance
- Other: Living area reported as 1,860 (above grade finished area same)
Exterior
- Parking: Off-street parking; 1-car garage
- Utilities: Public water; Public sewer; Sewer and water available; 100 amp electric service
- Home design: Single family residence; Residential property; Fixer condition; Estimated 1920 construction
- Construction: Vinyl siding; Composition roof; Permanent foundation
- Exterior features: Private yard; Back yard; Paved city street frontage
Interior
- Kitchen: No appliances listed
- Bedrooms: 4 bedrooms (includes primary bedroom)
- Flooring: Hardwood
- Bathrooms: 1 full bathroom
- Heating & cooling: Natural gas heating; No cooling
- Interior features: Drywall; Hardwood flooring; Unfinished basement
- Laundry & utility: No laundry appliances listed
Neighborhood map
What this means for you Summary
Snapshot
- This is a 4-bed/1.0-bath single-family listed at $49k.
Deal economics
- At list price, monthly cash flow is $771 ($9k/yr) — positive.
- The deal already cash-flows at list — no discount required.
- Meets the 1% rule at list price ($2k rent vs $49k).
Location & tenants
- Location reads 77/100 on livability (#314 in PA, #2,810 nationally) — a middle-class / working-renter tenant base. Strengths: crime A+, cost of living A+, housing A+; Watch: amenities F, commute F.
- Pittston Area SD (suburban): math 30% / reading 40% proficiency, ranked #418 of 539 in PA (top 78%) — families likely to look elsewhere, expect single-tenant / working-renter base with shorter leases.
- Market conditions: 103 active listings in the ZIP; 6 comparable units currently listed for rent nearby; rentals lingering (median 44d on market — plan ~5-8 weeks vacancy on turnover, expect pricing pressure); 50% of comp listings sitting > 30 days — soft ceiling on asking rent; 349 units permitted in Luzerne County in 2024 (16 in 5+ unit buildings).
Forward outlook
- Local home prices are declining (-3.0%/yr); year-one equity from $339 of loan paydown is wiped out by about $1k of value loss. Plan a longer hold.
- Luzerne County population projected at +4% by 2050 — modest demand growth; plan on rents tracking national, not racing it.
- At projected returns (-3.0% appreciation + 3.0% rent growth), your $14k cash investment doubles in ~2 years — after that, you're playing with house money.
Negotiation context
- Only 3 days on market — expect competitive offers; lowballing is unlikely to land.
- Current owner paid $33k; 48% above their basis — modest negotiation headroom, anchor on the comps not their cost.
Risks & watch-outs
- Watch-outs: property tax is 3.9% of price; built in 1920 — expect roof / HVAC / electrical / plumbing capex.
Questions for the listing agent
- Built in 1920 — when were the roof, HVAC, electrical panel, plumbing, and water heater last replaced?
- Property tax is high relative to price — has the assessment been appealed recently, and will the sale trigger a re-assessment?
- Is there a deadline driving the sale (1031 exchange, divorce, estate, relocation)? That informs how much negotiation room exists.
- What's the average days-on-market for RENTAL listings here right now (not sales)? A rising rental-DOM trend means longer vacancies and softer asking-rent achievability than the comps imply.
- What's the recent tenant-quality profile in this submarket — average credit score on applications, eviction rate, late-payment / NSF rate, and stable-employment percentage? A property-management company in the area should have these aggregated.
- How much new for-sale + rental construction is in the pipeline within 1–3 miles? Heavy new supply typically softens prices + rents 12–24 months out; constrained supply supports both.
Investment metrics
- 1% rule
- 3.12% ✓
- Cap rate
- 25.17%
- Cash-on-cash
- 67.41%
- DSCR
- 4.00
- GRM
- 2.7
CMA / ARV
- ARV (on-the-fly)
- $214,248
- Comps found
- 12
Show comp detail 12 sales within ~0.75 mi
| Address | Dist | Beds/Ba | Sqft | Sold | Price | $/sf | Match |
|---|---|---|---|---|---|---|---|
| 140 Center St | 0.55mi | 4/2.0 | 1,804 (-5%) | 4mo | $144,000 | $80 | 59 |
| 129 Parsonage St | 0.37mi | 3/1.5 (-1) | 1,782 (-6%) | 10mo | $185,000 | $104 | 57 |
| 208 Parsonage St | 0.23mi | 3/1.5 (-1) | 1,680 (-11%) | 9mo | $190,000 | $113 | 56 |
| 87 Maple Ln | 0.43mi | 3/1.5 (-1) | 1,790 (-6%) | 10mo | $240,500 | $134 | 55 |
| 155 Parsonage St | 0.34mi | 3/1.5 (-1) | 1,671 (-12%) | 3mo | $126,500 | $76 | 55 |
| 86 1/2 Lambert St | 0.48mi | 4/2.0 | 1,728 (-9%) | 7mo | $149,900 | $87 | 53 |
| 117 Laurie Ln | 0.32mi | 4/1.5 | 1,680 (-11%) | 15mo | $300,000 | $179 | 52 |
| 105 Center St | 0.44mi | 3/1.0 (-1) | 1,702 (-10%) | 9mo | $185,000 | $109 | 50 |
| 195 Mill St | 0.64mi | 3/1.0 (-1) | 1,624 (-14%) | 2mo | $185,000 | $114 | 39 |
| 9 Parsonage St | 0.62mi | 4/1.0 | 1,650 (-13%) | 16mo | $75,000 | $45 | 36 |
| Lot 31 Cremard Blvd | 0.65mi | 3/2.5 (-1) | 1,676 (-12%) | 6mo | $397,900 | $237 | 34 |
| Lot 36 Cremard Blvd | 0.62mi | 3/2.5 (-1) | 1,676 (-12%) | 10mo | $389,900 | $233 | 32 |
Match score weights: distance 35% · size 25% · config 20% · recency 20%. Top-matched comps best support the ARV.
Projected returns pro-forma
-3.0% appreciation · 3.0% rent growth · sell at horizon
- IRR
- 66.8%
- Equity multiple
- 4.00×
- Total profit
- $41,228
- Equity at exit
- $7,306
- IRR
- 71.0%
- Equity multiple
- 8.25×
- Total profit
- $99,442
- Equity at exit
- $4,237
Cash invested: $13,720 (down + closing). Projections, not guarantees.
Landlord ↔ Tenant lean methodology
- Overall (STATE)
- 62 Landlord-Friendly
- State Pennsylvania
- 62 Landlord-Friendly · EVEN
- County
- — inherits STATE
- City
- — inherits STATE
ZIP-level market 18640
- Home prices YoY
- -34.9%
- Active inventory
- 103
- Price-to-rent
- 2.7×
Monthly cashflow live
- Estimated rent
- $1,527 high interval (Pro) →
- Mortgage (P&I)
- −$257
- Tax from tax record
- −$158 /mo · $1,902/yr
- Insurance
- −$20
- HOA
- −$0
- Vacancy / Maint / Mgmt
- −$321
- Net cashflow
- $771
Break-even live
UW: 25.0% down · 7.5% · 30yr · 1.5% tax · 5.0% vac · 8.0% maint · 8.0% mgmt
Financing live
Cash to close
- Down payment
- $12,250
- Closing costs
- $1,470
- Reserves months
- —
- Total cash needed
- —
Loan-product check · same deal, 3 products live
Conventional
25% down · 7.5% · 30yr
- Down + closing
- —
- Monthly P&I
- —
- Monthly cashflow
- —
- DSCR
- —
- Eligible?
- —
Personal DTI + credit; lowest rate.
DSCR
20% down · 8.5% · 30yr
- Down + closing
- —
- Monthly P&I
- —
- Monthly cashflow
- —
- DSCR
- —
- Eligible?
- —
No personal income docs; deal must DSCR.
Hard money
10% down · 12.0% · 12mo
- Down + closing
- —
- Monthly P&I
- —
- Monthly cashflow
- —
- DSCR
- —
- Eligible?
- —
Short-term bridge; refi at stabilization.
Rent comps 6 comps
| Address | Beds | Baths | Sqft | Rent | $/sqft | DOM | Units | Dist |
|---|---|---|---|---|---|---|---|---|
| 178 Parsonage St Pittston, PA | 3.0 | 1.0 | 1500 | $1,500 | $1.00 | 13d | 1 | 0.29mi |
| 340 Race St West Pittston, PA | 3.0 | 1.5 | 1889 | $1,550 | $0.82 | 21d | 1 | 1.17mi |
| 211 Montgomery Ave Unit 211 West Pittston, PA | 3.0 | 2.0 | 1916 | $1,600 | $0.84 | 13d | 1 | 1.34mi |
| 327 Fremont St Unit 329 West Pittston, PA | 3.0 | 1.0 | 1250 | $1,400 | $1.12 | 43d | 1 | 1.41mi |
| 329 Fremont St West Pittston, PA | 3.0 | 1.0 | 1250 | $1,400 | $1.12 | 43d | 1 | 1.41mi |
| 252 S Main St Pittston, PA | 4.0 | 2.5 | 1548 | $1,750 | $1.13 | 43d | 1 | 1.50mi |
Listing history 4 events
-
2026-06-18days on market $49,000 Active 3 DOM
-
2026-06-17days on market $49,000 Active 2 DOM
-
2026-06-15remarks 699-char remark
-
2026-06-15$49,000 Active 1 DOM
ⓘ Source: listings_history table (triggers on properties + properties_extension) + one-shot
backfill from property_details.listing_events for pre-trigger history.
Tax reassessment forecast PA · Partial reset (capped growth)
- Current annual tax
- $1,902 · $158/mo
- Projected year-2 tax
- $1,902 · $158/mo
- Expected delta
- $0/yr ($0/mo · 0.0%)
ⓘ Screening estimate from a state-policy table — verify with the county assessor before closing.
Climate risk First Street
- Flood 1/10 Low FEMA zone X (unshaded) · 0% chance over 30 yrs
- Wildfire 2/10 Low
- Heat 3/10 Moderate 7 d/yr ≥96°F today · 16 d/yr by 30 yrs out
- Wind 3/10 Moderate 4% chance of damaging wind over 30 yrs
- Air quality 2/10 Low 1 unhealthy d/yr today · 2 by 30 yrs out
Nearby sold comps map
Loading sold comps map…
Walkable amenities ~0.75 mi
Loading nearby amenities…
Taxation est. · year 1
- Rental income
- $18,327
- − Mortgage interest
- −$2,745
- − Property taxes
- −$1,902
- − Insurance
- −$245
- − Repairs & maintenance
- −$1,466
- − Management
- −$1,466
- − Depreciation
- −$1,425
- Taxable income
- $9,078
- Est. tax owed @ 24.0%
- −$2,179
- After-tax cash flow
- $7,070/yr
For passive investors: Depreciation is non-cash, so a rental often shows a tax loss while cash-flowing — sheltering income. Rental losses are passive: they offset passive income freely, and up to $25,000/yr can offset ordinary (W-2) income if you actively participate and your MAGI is under $100k (phasing out to $0 by $150k); unused losses carry forward. On sale, claimed depreciation is recaptured at up to 25%, and gains may owe capital-gains tax (a 1031 exchange can defer both). Figures are a year-1 estimate at your 24.0% rate — not tax advice; consult a CPA.
Schools (NCES district)
- District
- Pittston Area SD
- NCES district ID
- 4219200
- Math proficiency
- 30% ▼ -12.00%
- Reading proficiency
- 40% ▼ -19.00%
- Median HH income
- $45,316
- Composite
- 29.86/100
- National rank
- #6409
- State rank
- #418 of 539 in PA
Livability — Hughestown
- Score
- 77/100
- State rank
- #314
- US rank
- #2810
Category grades
Schools grade is shown separately in the Schools card above.
Census & demographics
- Census place
- Hughestown, PA
- Population (ZIP)
- 16,418
Population outlook (Luzerne County) Hauer SSP2
- Today (2025)
- 319,505 people
- By 2030
- 319,943 · +0.1%
- By 2040
- 322,643 · +1.0%
- By 2050
- 330,817 · +3.5%
- By 2075
- 379,145 · +18.7%
- By 2100
- 431,908 · +35.2%
Race, ethnicity, and origin ACS 2023
- Neighborhood character
- Predominantly White (85%)
- Race & ethnicity
- White 85% Hispanic / Latino 6% Two or more races 5% Black 4%
- Hispanic origin (detail)
- Puerto Rican 4%
- Common ancestry
- Romanian 19% Scotch-Irish 2% Iranian 1%
- Foreign-born
- 3% · Canada, Jamaica
- Languages at home
- 93% English-only · Spanish 4% Other Indo-European 1% Chinese 1%
Political lean MEDSL · Luzerne
- 2024 margin
- R (+19.2) · D 40.0% · R 59.2%
- 2008→2024 swing
- -27.6pp toward R · 2008: 8.4pp · 2024: -19.2pp
- All cycles
- 2024: R+19.2 2020: R+14.4 2016: R+19.6 2012: D+4.8 2008: D+8.4
Not yet ingested
- Civics
- —
Market trends
- HPI YoY
- ▼ -102.89%
- Current HPI
- 191.973
- Rent YoY
- —
- Metro
- —
- State GDP YoY
- ▲ 1.68%
- F500 in state
- 34
Industry mix (Fortune 500 HQ in PA)
| Industry | F500 HQs | Revenue |
|---|---|---|
| Healthcare | 2 | $309B |
|
||
| Insurance | 2 | $27B |
|
||
| Telecommunications / Media | 1 | $124B |
|
||
| Industrial Distribution | 1 | $22B |
|
||
| Financial Services | 1 | $20B |
|
||
| Chemicals / Materials | 1 | $18B |
|
||
Price history
+48.5% since first listed2 events — show timeline
- 2026-06-15 Listed $49,000 GSBR as distributed by MLS GRID
- 2011-10-11 Sold (Public Records) $33,000 Public Records
Property tax history
+1.5%/yrLatest (2026): $1,902 · +0.4% YoY. Source: county tax records.
Cash-flow waterfall
monthlySold comps — $/sqft
last 12 mo · ≤1 miLoading sold comps…