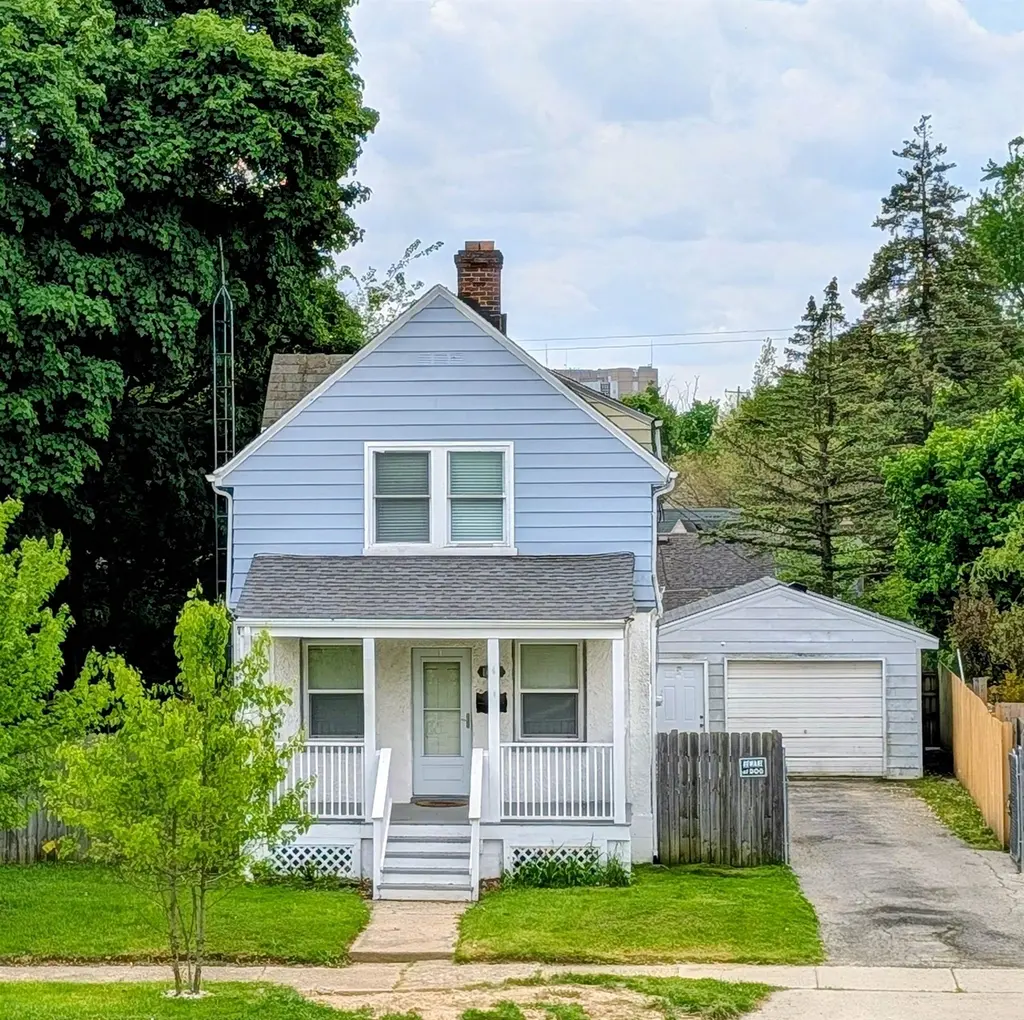
1029 N Chevrolet Rd · Flint, MI
Flood risk 1/10 · Minimal
- FEMA flood zone
- X (unshaded)
- Chance of flooding over 30 yrs
- 0.0%
- Est. flood insurance / yr
- $473 – $860
Fire risk 1/10 · Minimal
- Est. fire insurance / yr
- $784 – $1,456
Heat risk 2/10 · Minimal
- Hot days now (above 97°F)
- 7 days/yr
- Hot days in 30 yrs
- 15 days/yr
Wind risk 2/10 · Minimal
- Chance of severe wind over 30 yrs
- —
Air-quality risk 3/10 · Minor
- Unhealthy air days now
- 3 days/yr
- Unhealthy air days in 30 yrs
- 4 days/yr
Risk factors via First Street. Map © Google.
Why this score? — see what drove the D grade
The composite is a weighted blend of 9 inputs, each scored 0–100. Each bar is that input's sub-score; the figure is the points it added to the 100-point composite (weight × sub-score).
- Cash flow +17.1/30.0
- ARV discount +7.5/15.0
- DSCR +5.3/10.0
- 1% rule +4.1/10.0
- Livability +3.7/5.0
- Rent growth +2.5/5.0
- Condition / age +2.5/5.0
- Schools +1.1/10.0
- Appreciation +0.0/10.0
$120,000
🖨 Deal sheet (PDF) 📄 Offer letter ✓ Due diligence
Listing remarks MLS
Welcome home to charm, convenience, and a little extra personality! Perfectly located across from St. John Vianney Church and School and within walking distance to Kettering University and Mott Park, this move-in ready gem puts you close to everything while still feeling like home. Inside, you’ll find inviting spaces designed for both everyday living and memorable gatherings. The spacious living room and dedicated dining area offer plenty of room for hosting family dinners, holiday gatherings, game nights, or simply enjoying quality time with the people who matter most. In the warmer months, the charming front porch becomes the perfect spot to sip your morning coffee, wave to neighbors, or unwind after a long day. The spacious fenced backyard provides room to entertain, garden, play, or let your four-legged friends enjoy the outdoors. Major updates including the electrical system, windows, and plumbing offer added peace of mind, making this home as practical as it is charming. Convenient, updated, and full of character, this turnkey home is ready for its next chapter. Don’t let this one become “the house that got away” — schedule your showing today!
Key facts
- Charming front porch
- Spacious living room
- 8,276 sq ft lot
Tags
Property features AI
Finance
- Other: Lot approximately 0.19 acre; Basement with concrete construction; Approximately 1,360 above-grade finished square feet
- HOA & community: Homeowners association present
Exterior
- Parking: Detached 2-car garage
- Utilities: Public water; Public sewer; Sewer available
- Home design: Single-family residence; One and one-half stories; Residential zoning
- Construction: Aluminum siding and stucco exterior
- Exterior features: Deck; Fenced yard; Paved road access
Interior
- Kitchen: Oven; Refrigerator; Range
- Flooring: Hardwood floors
- Bathrooms: 2 full bathrooms
- Heating & cooling: Forced air heating; Natural gas heating; No central air
- Interior features: Electric water heater; Oven; Refrigerator; Range
Neighborhood map
What this means for you Summary
Snapshot
- This is a 3-bed/1.5-bath single-family listed at $120k.
Deal economics
- At list price, monthly cash flow is $83 ($995/yr) — positive.
- The deal already cash-flows at list — no discount required.
- To meet the 1% rule (rent ≥ 1% of price), the offer needs to be $110k (8.5% below list).
- Recommended offer: $110k (8.5% below list) — sets the bar for 1% rule.
- Cap rate 7.1% vs local median 11.5% in Flint — below-typical yield; the buyer is paying a premium for something (appreciation thesis, condition, location) that the cap rate doesn't capture.
Location & tenants
- Location reads 74/100 on livability (#196 in MI, #4,946 nationally) — a middle-class / working-renter tenant base. Strengths: commute A+, cost of living A+, housing A+; Watch: crime F, employment F.
- Flint School District (urban): math 7% / reading 13% proficiency, ranked #714 of 760 in MI (top 94%) — low school quality limits family demand, transient renter base, plan for 1-2y turnover; 83% free/reduced lunch — lower-income household profile, screen leases tightly.
- Zoned schools: Holmes Stem Middle School Academy (math 10% / reading 30%, grade F, #420 of 493 statewide, top 86%, 324 students, 90% FRL).
- Market conditions: 132 active listings in the ZIP; 9 comparable units currently listed for rent nearby; rentals at typical pace (median 23d on market — plan ~3-4 weeks tenant-placement turnaround); 419 units permitted in Genesee County in 2024 (68 in 5+ unit buildings).
Forward outlook
- Local home prices are declining (-3.0%/yr); year-one equity from $830 of loan paydown is wiped out by about $4k of value loss. Plan a longer hold.
- Genesee County population projected at -27% by 2050 — secular population decline; favor cash flow + early exit over multi-decade hold.
Negotiation context
- It's been on market 24 days — a 2% lower offer ($118k) is reasonable based on typical stale-listing flexibility.
- 11 sale attempts since 30y ago with the ask held roughly flat each time — persistent listings suggest the price (not the market) is what's stuck; bring a comps-based counter.
- Current owner paid $7k; list at $120k implies a 1511% gain — meaningful room to come down on a strong offer.
Risks & watch-outs
- Watch-outs: built in 1920 — expect roof / HVAC / electrical / plumbing capex.
Questions for the listing agent
- Built in 1920 — when were the roof, HVAC, electrical panel, plumbing, and water heater last replaced?
- Is there a deadline driving the sale (1031 exchange, divorce, estate, relocation)? That informs how much negotiation room exists.
- Schools are F-rated, which usually means shorter tenancies and higher turnover. Who's the typical renter profile here, and what's been the actual vacancy rate?
- Crime grade is F in this area — have there been break-ins, vandalism, or insurance claims at this property in the last 3 years? What carrier currently insures it and at what premium?
- The area grade is low — what's the realistic commute time and amenity access for the typical tenant pool here? Any planned neighborhood developments (good or bad) we should know about?
- What's the average days-on-market for RENTAL listings here right now (not sales)? A rising rental-DOM trend means longer vacancies and softer asking-rent achievability than the comps imply.
- What's the recent tenant-quality profile in this submarket — average credit score on applications, eviction rate, late-payment / NSF rate, and stable-employment percentage? A property-management company in the area should have these aggregated.
- How much new for-sale + rental construction is in the pipeline within 1–3 miles? Heavy new supply typically softens prices + rents 12–24 months out; constrained supply supports both.
Investment metrics
- 1% rule
- 0.91% ✗
- Cap rate
- 7.12%
- Cash-on-cash
- 2.96%
- DSCR
- 1.13
- GRM
- 9.1
CMA / ARV
- ARV (on-the-fly)
- $68,712
- Comps found
- 12
Show comp detail 12 sales within ~0.75 mi
| Address | Dist | Beds/Ba | Sqft | Sold | Price | $/sf | Match |
|---|---|---|---|---|---|---|---|
| 971 N Chevrolet Ave | 0.10mi | 3/1.0 | 1,122 (-9%) | 4mo | $79,900 | $71 | 76 |
| 1017 Perry St | 0.38mi | 3/1.5 | 1,181 (-4%) | 5mo | $110,000 | $93 | 72 |
| 2410 Flushing Rd | 0.17mi | 4/2.0 (+1) | 1,312 (+7%) | 4mo | $39,000 | $30 | 70 |
| 2551 Altoona St | 0.29mi | 2/1.0 (-1) | 1,114 (-9%) | 0mo | $45,000 | $40 | 64 |
| 825 Frank St | 0.40mi | 3/1.0 | 1,334 (+9%) | 3mo | $112,500 | $84 | 62 |
| 2539 Norbert St | 0.31mi | 3/1.0 | 1,350 (+10%) | 6mo | $76,000 | $56 | 62 |
| 3709 Brentwood Dr | 0.66mi | 3/1.0 | 1,176 (-4%) | 3mo | $130,000 | $111 | 58 |
| 1702 Stevenson St | 0.50mi | 3/1.0 | 1,120 (-9%) | 5mo | $17,500 | $16 | 56 |
| 808 N Chevrolet Ave | 0.36mi | 3/1.0 | 1,053 (-14%) | 2mo | $42,900 | $41 | 56 |
| 2713 Norbert St | 0.35mi | 3/1.0 | 1,076 (-12%) | 7mo | $36,000 | $33 | 55 |
| 709 Cadillac St | 0.56mi | 3/2.0 | 1,138 (-7%) | 7mo | $65,000 | $57 | 54 |
| 721 Frank St | 0.49mi | 3/1.0 | 1,408 (+15%) | 5mo | $61,000 | $43 | 46 |
Match score weights: distance 35% · size 25% · config 20% · recency 20%. Top-matched comps best support the ARV.
Projected returns pro-forma
-3.0% appreciation · 3.0% rent growth · sell at horizon
- IRR
- -11.6%
- Equity multiple
- 0.58×
- Total profit
- $-14,173
- Equity at exit
- $17,892
- IRR
- -2.5%
- Equity multiple
- 0.83×
- Total profit
- $-5,584
- Equity at exit
- $10,375
Cash invested: $33,600 (down + closing). Projections, not guarantees.
Landlord ↔ Tenant lean methodology
- Overall (STATE)
- 62 Landlord-Friendly
- State Michigan
- 62 Landlord-Friendly · EVEN
- County
- — inherits STATE
- City
- — inherits STATE
ZIP-level market 48504
- Active inventory
- 132
- Price-to-rent
- 9.1×
Monthly cashflow live
- Estimated rent
- $1,098 high interval (Pro) →
- Mortgage (P&I)
- −$629
- Tax from tax record
- −$105 /mo · $1,260/yr
- Insurance
- −$50
- HOA
- −$0
- Vacancy / Maint / Mgmt
- −$231
- Net cashflow
- $83
Break-even live
Sensitivity live
| Price | -10% $151 | -5% $117 | +0% $83 | +5% $49 | +10% $15 |
|---|---|---|---|---|---|
| Rent | -10% $-4 | -5% $40 | +0% $83 | +5% $126 | +10% $170 |
| Rate | -1.0pp $143 | -0.5pp $113 | base $83 | +0.5pp $52 | +1.0pp $20 |
UW: 25.0% down · 7.5% · 30yr · 1.5% tax · 5.0% vac · 8.0% maint · 8.0% mgmt
Financing live
Cash to close
- Down payment
- $30,000
- Closing costs
- $3,600
- Reserves months
- —
- Total cash needed
- —
Loan-product check · same deal, 3 products live
Conventional
25% down · 7.5% · 30yr
- Down + closing
- —
- Monthly P&I
- —
- Monthly cashflow
- —
- DSCR
- —
- Eligible?
- —
Personal DTI + credit; lowest rate.
DSCR
20% down · 8.5% · 30yr
- Down + closing
- —
- Monthly P&I
- —
- Monthly cashflow
- —
- DSCR
- —
- Eligible?
- —
No personal income docs; deal must DSCR.
Hard money
10% down · 12.0% · 12mo
- Down + closing
- —
- Monthly P&I
- —
- Monthly cashflow
- —
- DSCR
- —
- Eligible?
- —
Short-term bridge; refi at stabilization.
Rent comps 9 comps
| Address | Beds | Baths | Sqft | Rent | $/sqft | DOM | Units | Dist |
|---|---|---|---|---|---|---|---|---|
| 2428 Norbert St Flint, MI | 3.0 | 1.0 | 1200 | $1,250 | $1.04 | 23d | 1 | 0.16mi |
| 2544 Tyrone St Flint, MI | 2.0 | 1.0 | 1440 | $825 | $0.57 | 15d | 1 | 0.22mi |
| 314 Sheffield Ave Flint, MI | 2.0 | 1.0 | 896 | $1,250 | $1.40 | 23d | 1 | 0.49mi |
| 3713 Gratiot Ave Flint, MI | 4.0 | 1.0 | 1400 | $1,400 | $1.00 | 23d | 1 | 0.80mi |
| 806 Barney Ave Flint, MI | 2.0 | 1.0 | 1000 | $1,000 | $1.00 | 23d | 1 | 0.94mi |
| 2610 Swayze St Flint, MI | 3.0 | 1.5 | 1194 | $950 | $0.80 | 23d | 1 | 1.12mi |
| 1540 Garland St Flint, MI | 3.0 | 2.5 | 1344 | $1,017 | $0.76 | 23d | 1 | 1.19mi |
| 1410 Bradley Ave Flint, MI | 3.0 | 1.5 | 1160 | $995 | $0.86 | 23d | 1 | 1.30mi |
| 3701 Whitney Ave Flint, MI | 2.0 | 1.0 | 850 | $900 | $1.06 | 15d | 1 | 1.48mi |
Listing history 38 events
-
2026-06-21days on market $120,000 Active 24 DOM
-
2026-06-18days on market $120,000 Active 21 DOM
-
2026-06-17days on market $120,000 Active 20 DOM
-
2026-06-16days on market $120,000 Active 19 DOM
-
2026-06-15days on market $120,000 Active 18 DOM
-
2026-06-14days on market $120,000 Active 16 DOM
-
2026-06-13statusdays on market $120,000 Active 15 DOM
-
2026-06-10days on market $120,000 Active Under Contract 13 DOM
-
2026-06-09days on market $120,000 Active Under Contract 12 DOM
-
2026-06-08days on market $120,000 Active Under Contract 11 DOM
-
2026-06-07statusdays on market $120,000 Active Under Contract 10 DOM
-
2026-06-05days on market $120,000 Active 7 DOM
-
2026-06-03days on market $120,000 Active 6 DOM
-
2026-06-02days on market $120,000 Active 5 DOM
-
2026-06-01days on market $120,000 Active 4 DOM
-
2026-05-31days on market $120,000 Active 3 DOM
-
2026-05-30days on market $120,000 Active 2 DOM
-
2026-05-28$120,000 Active
Show marketing remark (1197 chars)
Welcome home to charm, convenience, and a little extra personality! Perfectly located across from St. John Vianney Church and School and within walking distance to Kettering University and Mott Park, this move-in ready gem puts you close to everything while still feeling like home. Inside, you’ll find inviting spaces designed for both everyday living and memorable gatherings. The spacious living room and dedicated dining area offer plenty of room for hosting family dinners, holiday gatherings, game nights, or simply enjoying quality time with the people who matter most. In the warmer months, the charming front porch becomes the perfect spot to sip your morning coffee, wave to neighbors, or unwind after a long day. The spacious fenced backyard provides room to entertain, garden, play, or let your four-legged friends enjoy the outdoors. Major updates including the electrical system, windows, and plumbing offer added peace of mind, making this home as practical as it is charming. Convenient, updated, and full of character, this turnkey home is ready for its next chapter. Don’t let this one become “the house that got away” — schedule your showing today!
-
2026-05-28$120,000 Active 1197-char remark
Show marketing remark (1197 chars)
Welcome home to charm, convenience, and a little extra personality! Perfectly located across from St. John Vianney Church and School and within walking distance to Kettering University and Mott Park, this move-in ready gem puts you close to everything while still feeling like home. Inside, you’ll find inviting spaces designed for both everyday living and memorable gatherings. The spacious living room and dedicated dining area offer plenty of room for hosting family dinners, holiday gatherings, game nights, or simply enjoying quality time with the people who matter most. In the warmer months, the charming front porch becomes the perfect spot to sip your morning coffee, wave to neighbors, or unwind after a long day. The spacious fenced backyard provides room to entertain, garden, play, or let your four-legged friends enjoy the outdoors. Major updates including the electrical system, windows, and plumbing offer added peace of mind, making this home as practical as it is charming. Convenient, updated, and full of character, this turnkey home is ready for its next chapter. Don’t let this one become “the house that got away” — schedule your showing today!
-
2018-12-24historical
-
2012-05-22historical
-
2012-05-22historical
-
2011-11-14$14,900
-
2011-11-14$14,900
-
2011-08-04soldstatus $7,450
-
2011-08-04soldstatus $7,450
-
2011-08-04soldstatus $7,450
-
2011-07-12historical
-
2011-06-09$8,640
-
2011-06-09$8,640
-
2011-06-08$8,640
-
2011-03-17historical
-
2010-12-13$9,900
-
2010-12-13$9,900
-
1996-11-14soldstatus $35,000
-
1996-11-14soldstatus $35,000
-
1996-08-05$36,900
-
1996-08-05$36,900
ⓘ Source: listings_history table (triggers on properties + properties_extension) + one-shot
backfill from property_details.listing_events for pre-trigger history.
Tax reassessment forecast MI · Partial reset (capped growth)
- Current annual tax
- $1,260 · $105/mo
- Projected year-2 tax
- $1,554 · $129/mo
- Expected delta
- +$294/yr (+$25/mo · 23.4%)
ⓘ Screening estimate from a state-policy table — verify with the county assessor before closing.
Climate risk First Street
- Flood 1/10 Low FEMA zone X (unshaded) · 0% chance over 30 yrs
- Wildfire 1/10 Low
- Heat 2/10 Low 7 d/yr ≥97°F today · 15 d/yr by 30 yrs out
- Wind 2/10 Low
- Air quality 3/10 Moderate 3 unhealthy d/yr today · 4 by 30 yrs out
Nearby sold comps map
Loading sold comps map…
Walkable amenities ~0.75 mi
Loading nearby amenities…
Taxation est. · year 1
- Rental income
- $13,173
- − Mortgage interest
- −$6,722
- − Property taxes
- −$1,260
- − Insurance
- −$600
- − Repairs & maintenance
- −$1,054
- − Management
- −$1,054
- − Depreciation
- −$3,491
- Taxable loss
- −$1,007
- Est. tax savings @ 24.0%
- +$242
- After-tax cash flow
- $1,237/yr
For passive investors: Depreciation is non-cash, so a rental often shows a tax loss while cash-flowing — sheltering income. Rental losses are passive: they offset passive income freely, and up to $25,000/yr can offset ordinary (W-2) income if you actively participate and your MAGI is under $100k (phasing out to $0 by $150k); unused losses carry forward. On sale, claimed depreciation is recaptured at up to 25%, and gains may owe capital-gains tax (a 1031 exchange can defer both). Figures are a year-1 estimate at your 24.0% rate — not tax advice; consult a CPA.
Schools (NCES district)
- District
- Flint School District
- NCES district ID
- 2614520
- Math proficiency
- 7% ▬ 0.00%
- Reading proficiency
- 13% ▲ 3.00%
- Median HH income
- $25,954
- Composite
- 10.97/100
- National rank
- #14642
- State rank
- #714 of 760 in MI
Livability — Flint
- Score
- 74/100
- State rank
- #196
- US rank
- #4946
Category grades
Schools grade is shown separately in the Schools card above.
Census & demographics
- Census place
- Flint, MI
- City population
- 93,814
- Population (ZIP)
- 23,873
Population outlook (Genesee County) Hauer SSP2
- Today (2025)
- 381,312 people
- By 2030
- 362,731 · -4.9%
- By 2040
- 321,550 · -15.7%
- By 2050
- 279,212 · -26.8%
- By 2075
- 193,336 · -49.3%
- By 2100
- 128,118 · -66.4%
Race, ethnicity, and origin ACS 2023
- Neighborhood character
- Predominantly Black (66%)
- Race & ethnicity
- Black 66% White 24% Two or more races 6% Hispanic / Latino 5% Asian 1%
- Common ancestry
- Romanian 2% Lithuanian 1% Italian 1%
- Foreign-born
- 3% · Canada, China
- Languages at home
- 96% English-only · Spanish 2%
Political lean MEDSL · Genesee
- 2024 margin
- Toss-up / Even · D 51.4% · R 47.2% · Other 1.4%
- 2008→2024 swing
- -28.3pp toward R · 2008: 32.5pp · 2024: 4.2pp
- All cycles
- 2024: D+4.2 2020: D+9.3 2016: D+9.5 2012: D+28.2 2008: D+32.5
Not yet ingested
- Civics
- —
Market trends
- HPI YoY
- ▼ -101.67%
- Current HPI
- 94.3111
- Rent YoY
- —
- Metro
- —
- State GDP YoY
- ▲ 1.37%
- F500 in state
- 28
Industry mix (Fortune 500 HQ in MI)
| Industry | F500 HQs | Revenue |
|---|---|---|
| Automotive Parts | 3 | $48B |
|
||
| Automotive | 2 | $372B |
|
||
| Chemicals | 1 | $45B |
|
||
| Automotive Retail | 1 | $29B |
|
||
| Healthcare / Medical Devices | 1 | $23B |
|
||
| Automotive Technology | 1 | $20B |
|
||
Price history
+225.2% since first listed21 events — show timeline
- 2026-05-28 Listed $120,000 MiRealSource-MiMLS
- 2026-05-28 Listed $120,000 REALCOMP
- 2018-12-24 Listing Removed — MiRealSource-MiMLS
- 2012-05-22 Listing Removed — REALCOMP
- 2012-05-22 Listing Removed — MiRealSource-MiMLS
- 2011-11-14 Listed $14,900 REALCOMP
- 2011-11-14 Listed $14,900 MiRealSource-MiMLS
- 2011-08-04 Sold (MLS) $7,450 REALCOMP
- 2011-08-04 Sold (MLS) $7,450 REALCOMP
- 2011-08-04 Sold (MLS) $7,450 MiRealSource-MiMLS
- 2011-07-12 Listing Removed — MiRealSource-MiMLS
- 2011-06-09 Listed $8,640 REALCOMP
- 2011-06-09 Listed $8,640 MiRealSource-MiMLS
- 2011-06-08 Listed $8,640 REALCOMP
- 2011-03-17 Listing Removed — REALCOMP
- 2010-12-13 Listed $9,900 MiRealSource-MiMLS
- 2010-12-13 Listed $9,900 REALCOMP
- 1996-11-14 Sold (MLS) $35,000 MiRealSource-MiMLS
- 1996-11-14 Sold (MLS) $35,000 REALCOMP
- 1996-08-05 Listed $36,900 MiRealSource-MiMLS
- 1996-08-05 Listed $36,900 REALCOMP
Property tax history
+2.5%/yrLatest (2025): $1,260 · +1.8% YoY. Source: county tax records.
Cash-flow waterfall
monthlySold comps — $/sqft
last 12 mo · ≤1 miLoading sold comps…