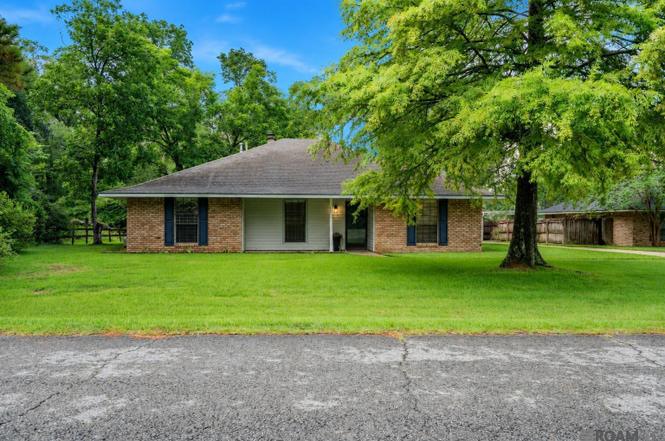
13423 Clear Oak Ave · Central, LA
Flood risk 1/10 · Minimal
- FEMA flood zone
- X (unshaded)
- Chance of flooding over 30 yrs
- 0.0%
- Est. flood insurance / yr
- $507 – $1,088
Fire risk 2/10 · Minimal
- Est. fire insurance / yr
- $1,269 – $2,357
Heat risk 8/10 · Major
- Hot days now (above 108°F)
- 7 days/yr
- Hot days in 30 yrs
- 20 days/yr
Wind risk 9/10 · Severe
- Chance of severe wind over 30 yrs
- 99.0%
Air-quality risk 3/10 · Minor
- Unhealthy air days now
- 3 days/yr
- Unhealthy air days in 30 yrs
- 3 days/yr
Risk factors via First Street. Map © Google.
Why this score? — see what drove the C- grade
The composite is a weighted blend of 9 inputs, each scored 0–100. Each bar is that input's sub-score; the figure is the points it added to the 100-point composite (weight × sub-score).
- Cash flow +16.0/30.0
- ARV discount +15.0/15.0
- DSCR +4.9/10.0
- Schools +4.6/10.0
- Livability +3.7/5.0
- 1% rule +3.5/10.0
- Rent growth +2.5/5.0
- Condition / age +2.5/5.0
- Appreciation +0.0/10.0
$235,000
🖨 Deal sheet (PDF) 📄 Offer letter ✓ Due diligence
Listing remarks
Welcome home to this beautiful 3-bedroom, 2-bath residence situated on a large lot in the heart of Central! Conveniently located just minutes from I-12 and I-110, this home offers the perfect combination of peaceful living and easy access to shopping, dining, and commuting routes. Nestled in a quiet, well-established neighborhood and located within the highly sought-after Central School District, this property is a must-see. Inside, you'll find an inviting floor plan featuring both an eat-in kitchen and a formal dining room, providing plenty of space for everyday living and entertaining. The kitchen is equipped with stainless steel appliances, granite countertops, and ample cabinet storage.
Key facts
- Formal dining room
- Large lot
- Eat-in kitchen
Tags
Property features AI
Finance
- HOA & community: Subdivision: Woods Edge
Exterior
- Parking: Carport (2 spaces); 2 total parking spaces
- Utilities: Public water; Public sewer
- Home design: Residential detached single-family home; Single story
- Construction: Vinyl siding and frame construction; Shingle roof; Slab foundation; Built on 0.37-acre lot
- Exterior features: Covered patio; Fencing (other)
Interior
- Kitchen: Range; Oven; Dishwasher; Disposal; Microwave
- Flooring: Tile; Ceramic tile; Laminate
- Bathrooms: 2 full bathrooms
- Heating & cooling: Central heating; Central air; Ceiling fan(s)
- Interior features: Walk-in closet(s); Wood-burning fireplace; Lighting
- Laundry & utility: Laundry room with inside washer and electric dryer hookups; Gas water heater
Neighborhood map
What this means for you Summary
Snapshot
- This is a 3-bed/2.0-bath single-family listed at $235k.
Deal economics
- At list price, monthly cash flow is $116 ($1k/yr) — positive.
- The deal already cash-flows at list — no discount required.
- To meet the 1% rule (rent ≥ 1% of price), the offer needs to be $199k (15.2% below list).
- Recommended offer: $199k (15.2% below list) — sets the bar for 1% rule.
- Cap rate 6.9% vs local median 3.3% in Central — top-decile yield for the area; either an underpriced asset or a hidden risk that comps aren't pricing in. Stress-test before assuming the spread holds.
Location & tenants
- Location reads 74/100 on livability (#25 in LA, #4,761 nationally) — a middle-class / working-renter tenant base. Strengths: schools A+, employment A+, housing A+; Watch: amenities F, commute F.
- Central Community School District (suburban): math 50% / reading 54% proficiency, ranked #9 of 98 in LA (top 9%) — acceptable for families but not a draw, mixed tenant base, ~2y average lease.
- Market conditions: 128 active listings in the ZIP; solid renter incomes; 2,252 units permitted in East Baton Rouge Parish in 2024 (440 in 5+ unit buildings).
- This rent runs 30% of the median local income ($78k/yr) — at the standard rent-burdened threshold; future hikes will face affordability resistance.
Forward outlook
- Local home prices are declining (-3.0%/yr); year-one equity from $2k of loan paydown is wiped out by about $7k of value loss. Plan a longer hold.
- East Baton Rouge County population projected at +4% by 2050 — modest demand growth; plan on rents tracking national, not racing it.
Negotiation context
- Only 2 days on market — expect competitive offers; lowballing is unlikely to land.
Risks & watch-outs
- Climate carrying-cost: severe wind risk, 99% chance of damaging wind over 30y; extreme-heat days projected 7→20/yr by 2055 (HVAC capex compounding) — expect insurance premiums to compound above CPI over the hold.
Questions for the listing agent
- Built in 1978 — when were the roof, HVAC, electrical panel, plumbing, and water heater last replaced?
- Is there a deadline driving the sale (1031 exchange, divorce, estate, relocation)? That informs how much negotiation room exists.
- Schools are A-rated — typically a magnet for longer-tenancy family renters. What's the average tenant stay here, and is there a school-zone premium baked into asking?
- What's the average days-on-market for RENTAL listings here right now (not sales)? A rising rental-DOM trend means longer vacancies and softer asking-rent achievability than the comps imply.
- What's the recent tenant-quality profile in this submarket — average credit score on applications, eviction rate, late-payment / NSF rate, and stable-employment percentage? A property-management company in the area should have these aggregated.
- How much new for-sale + rental construction is in the pipeline within 1–3 miles? Heavy new supply typically softens prices + rents 12–24 months out; constrained supply supports both.
Investment metrics
- 1% rule
- 0.85% ✗
- Cap rate
- 6.89%
- Cash-on-cash
- 2.12%
- DSCR
- 1.09
- GRM
- 9.8
CMA / ARV
- ARV (on-the-fly)
- $321,678
- Comps found
- 8
Show comp detail 8 sales within ~0.75 mi
| Address | Dist | Beds/Ba | Sqft | Sold | Price | $/sf | Match |
|---|---|---|---|---|---|---|---|
| 7355 Woods Edge Dr | 0.08mi | 3/2.0 | 1,591 (-6%) | 10mo | $249,900 | $157 | 77 |
| 7549 Woods Edge Dr | 0.05mi | 3/2.0 | 1,850 (+9%) | 13mo | $295,000 | $159 | 72 |
| 13534 New Wood Ave | 0.12mi | 3/2.0 | 1,765 (+4%) | 22mo | $285,000 | $161 | 70 |
| 14261 Lovett Rd | 0.49mi | 3/2.0 | 1,724 (+1%) | 9mo | $420,000 | $244 | 67 |
| 13235 W Waterside Dr | 0.17mi | 3/2.0 | 1,838 (+8%) | 23mo | $385,000 | $209 | 60 |
| 7334 Oak Meadow Dr | 0.12mi | 3/2.0 | 1,871 (+10%) | 22mo | $230,000 | $123 | 60 |
| 8242 Knee Tree Dr | 0.68mi | 3/2.0 | 1,724 (+1%) | 14mo | $325,000 | $189 | 55 |
| 13224 Magnolia Square Dr | 0.26mi | 3/2.0 | 1,940 (+14%) | 12mo | $412,000 | $212 | 55 |
Match score weights: distance 35% · size 25% · config 20% · recency 20%. Top-matched comps best support the ARV.
Projected returns pro-forma
-3.0% appreciation · 3.0% rent growth · sell at horizon
- IRR
- -13.0%
- Equity multiple
- 0.53×
- Total profit
- $-30,756
- Equity at exit
- $35,039
- IRR
- -4.0%
- Equity multiple
- 0.73×
- Total profit
- $-17,551
- Equity at exit
- $20,319
Cash invested: $65,800 (down + closing). Projections, not guarantees.
Landlord ↔ Tenant lean methodology
- Overall (STATE)
- 90 Strongly Landlord-Friendly
- State Louisiana
- 90 Strongly Landlord-Friendly · R+12
- County
- — inherits STATE
- City
- — inherits STATE
ZIP-level market 70818
- Active inventory
- 128
- Price-to-rent
- 9.8×
Monthly cashflow live
- Estimated rent
- $1,993 medium interval (Pro) →
- Mortgage (P&I)
- −$1,232
- Tax from tax record
- −$128 /mo · $1,534/yr
- Insurance
- −$98
- HOA
- −$0
- Vacancy / Maint / Mgmt
- −$418
- Net cashflow
- $116
Break-even live
Sensitivity live
| Price | -10% $249 | -5% $183 | +0% $116 | +5% $50 | +10% $-17 |
|---|---|---|---|---|---|
| Rent | -10% $-41 | -5% $37 | +0% $116 | +5% $195 | +10% $274 |
| Rate | -1.0pp $234 | -0.5pp $176 | base $116 | +0.5pp $55 | +1.0pp $-7 |
UW: 25.0% down · 7.5% · 30yr · 1.5% tax · 5.0% vac · 8.0% maint · 8.0% mgmt
Financing live
Cash to close
- Down payment
- $58,750
- Closing costs
- $7,050
- Reserves months
- —
- Total cash needed
- —
Loan-product check · same deal, 3 products live
Conventional
25% down · 7.5% · 30yr
- Down + closing
- —
- Monthly P&I
- —
- Monthly cashflow
- —
- DSCR
- —
- Eligible?
- —
Personal DTI + credit; lowest rate.
DSCR
20% down · 8.5% · 30yr
- Down + closing
- —
- Monthly P&I
- —
- Monthly cashflow
- —
- DSCR
- —
- Eligible?
- —
No personal income docs; deal must DSCR.
Hard money
10% down · 12.0% · 12mo
- Down + closing
- —
- Monthly P&I
- —
- Monthly cashflow
- —
- DSCR
- —
- Eligible?
- —
Short-term bridge; refi at stabilization.
Listing history 3 events
-
2026-06-18days on market $235,000 Active 2 DOM
-
2026-06-16remarks 699-char remark
-
2026-06-16$235,000 Active 1 DOM
ⓘ Source: listings_history table (triggers on properties + properties_extension) + one-shot
backfill from property_details.listing_events for pre-trigger history.
Tax reassessment forecast LA · Resets to sale price
- Current annual tax
- $1,534 · $128/mo
- Projected year-2 tax
- $1,534 · $128/mo
- Expected delta
- $0/yr ($0/mo · 0.0%)
ⓘ Screening estimate from a state-policy table — verify with the county assessor before closing.
Climate risk First Street
- Flood 1/10 Low FEMA zone X (unshaded) · 0% chance over 30 yrs
- Wildfire 2/10 Low
- Heat 8/10 Severe 7 d/yr ≥108°F today · 20 d/yr by 30 yrs out
- Wind 9/10 Extreme 99% chance of damaging wind over 30 yrs
- Air quality 3/10 Moderate 3 unhealthy d/yr today · 3 by 30 yrs out
Nearby sold comps map
Loading sold comps map…
Walkable amenities ~0.75 mi
Loading nearby amenities…
Taxation est. · year 1
- Rental income
- $23,912
- − Mortgage interest
- −$13,164
- − Property taxes
- −$1,534
- − Insurance
- −$1,175
- − Repairs & maintenance
- −$1,913
- − Management
- −$1,913
- − Depreciation
- −$6,836
- Taxable loss
- −$2,623
- Est. tax savings @ 24.0%
- +$629
- After-tax cash flow
- $2,023/yr
For passive investors: Depreciation is non-cash, so a rental often shows a tax loss while cash-flowing — sheltering income. Rental losses are passive: they offset passive income freely, and up to $25,000/yr can offset ordinary (W-2) income if you actively participate and your MAGI is under $100k (phasing out to $0 by $150k); unused losses carry forward. On sale, claimed depreciation is recaptured at up to 25%, and gains may owe capital-gains tax (a 1031 exchange can defer both). Figures are a year-1 estimate at your 24.0% rate — not tax advice; consult a CPA.
Schools (NCES district)
- District
- Central Community School District
- NCES district ID
- 2200125
- Math proficiency
- 50% ▼ -32.00%
- Reading proficiency
- 54% ▼ -31.00%
- Median HH income
- $66,584
- Composite
- 46.02/100
- National rank
- #2528
- State rank
- #9 of 98 in LA
Livability — Central
- Score
- 74/100
- State rank
- #25
- US rank
- #4761
Category grades
Schools grade is shown separately in the Schools card above.
Census & demographics
- Census place
- Central, LA
- County
- East Baton Rouge Parish · 399,686 people
- City population
- 10,403
- Metro
- Baton Rouge, LA
- Population (ZIP)
- 9,370
- Household income
- $78,432
- Rent vs Own
- Severe rent burden
- 408.0
Population outlook (East Baton Rouge County) Hauer SSP2
- Today (2025)
- 464,810 people
- By 2030
- 472,137 · +1.6%
- By 2040
- 480,243 · +3.3%
- By 2050
- 484,422 · +4.2%
- By 2075
- 492,069 · +5.9%
- By 2100
- 476,347 · +2.5%
Race, ethnicity, and origin ACS 2023
- Neighborhood character
- Predominantly White (70%)
- Race & ethnicity
- White 70% Black 21% Two or more races 5% Hispanic / Latino 3%
- Common ancestry
- Lithuanian 8% Italian 1% Serbian 1%
- Foreign-born
- 1% · Canada
- Languages at home
- 96% English-only · Spanish 3% French/Haitian/Cajun 1%
Political lean MEDSL · East Baton Rouge
- 2024 margin
- D (+11.1) · D 54.5% · R 43.4% · Other 2.1%
- 2008→2024 swing
- +8.9pp toward D · 2008: 2.2pp · 2024: 11.1pp
- All cycles
- 2024: D+11.1 2020: D+13.1 2016: D+9.2 2012: D+5.2 2008: D+2.2
Not yet ingested
- Civics
- —
Market trends
- HPI YoY
- ▼ -132.34%
- Current HPI
- 169.9642
- Rent YoY
- —
- Metro
- Baton Rouge, LA
- State GDP YoY
- ▲ 3.29%
- F500 in state
- 10
Industry mix (Fortune 500 HQ in LA)
| Industry | F500 HQs | Revenue |
|---|---|---|
| Telecommunications | 2 | $23B |
|
||
| Utilities | 1 | $12B |
|
||
| Wholesale / Distribution | 1 | $5B |
|
||
| Advertising | 1 | $2B |
|
||
Price history
2 events — show timeline
- 2026-06-16 Listed $235,000 GBRMLS
- 1979-05-16 Sold (Public Records) — Public Records
Property tax history
+10.0%/yrLatest (2025): $1,534 · -0.4% YoY. Source: county tax records.
Cash-flow waterfall
monthlySold comps — $/sqft
last 12 mo · ≤1 miLoading sold comps…