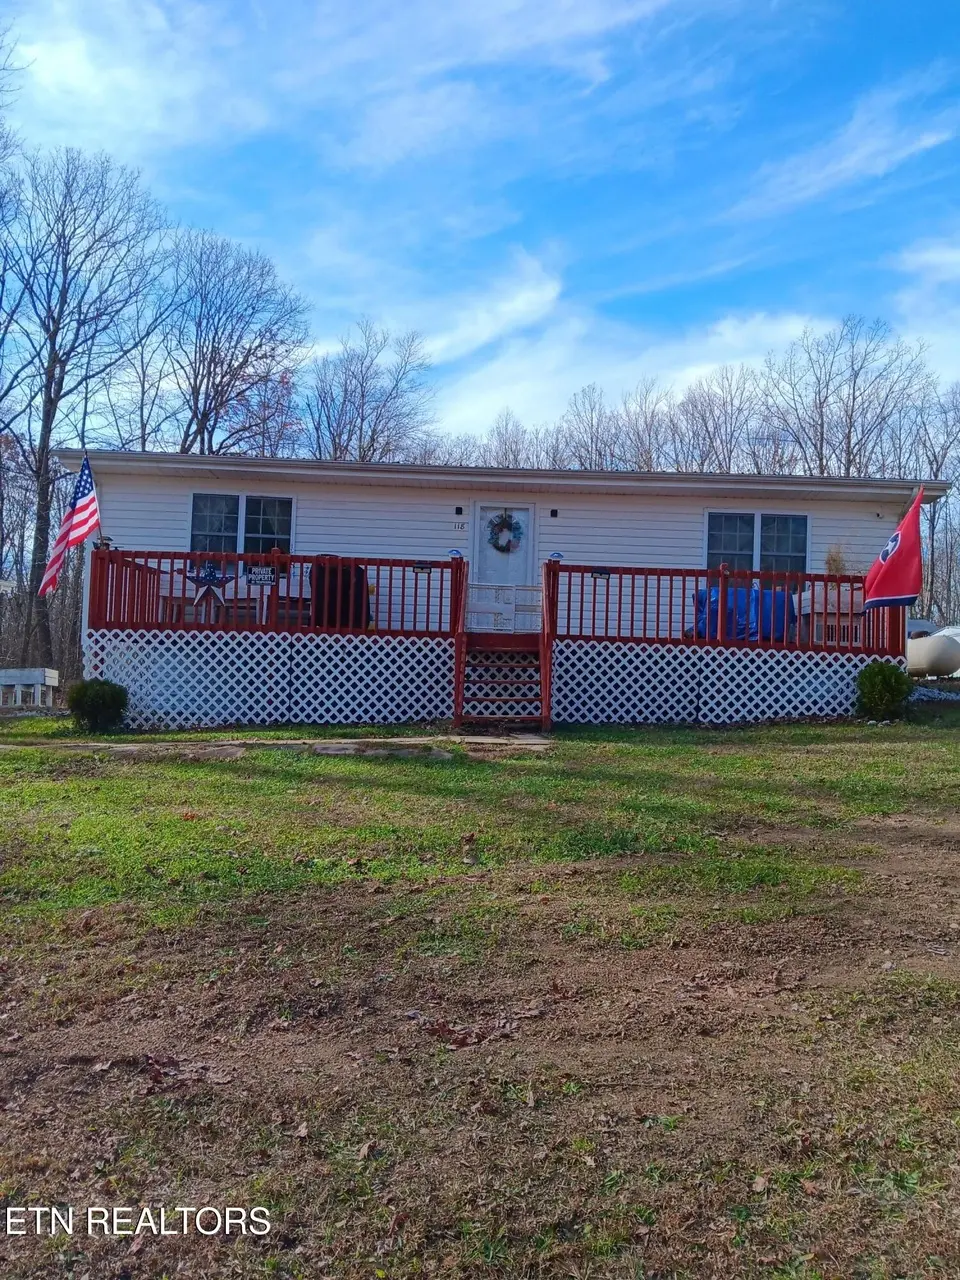
118 Tresa St · Lake Tansi, TN
Flood risk 1/10 · Minimal
- FEMA flood zone
- X (unshaded)
- Chance of flooding over 30 yrs
- 0.0%
- Est. flood insurance / yr
- $473 – $860
Fire risk 3/10 · Minor
- Est. fire insurance / yr
- $949 – $1,763
Heat risk 3/10 · Minor
- Hot days now (above 98°F)
- 6 days/yr
- Hot days in 30 yrs
- 16 days/yr
Wind risk 3/10 · Minor
- Chance of severe wind over 30 yrs
- 7.0%
Air-quality risk 2/10 · Minimal
- Unhealthy air days now
- 2 days/yr
- Unhealthy air days in 30 yrs
- 2 days/yr
Risk factors via First Street. Map © Google.
Why this score? — see what drove the D grade
The composite is a weighted blend of 9 inputs, each scored 0–100. Each bar is that input's sub-score; the figure is the points it added to the 100-point composite (weight × sub-score).
- Appreciation +10.0/10.0
- Cash flow +7.9/30.0
- ARV discount +7.5/15.0
- Livability +3.1/5.0
- Schools +2.6/10.0
- 1% rule +2.5/10.0
- Rent growth +2.5/5.0
- Condition / age +2.5/5.0
- DSCR +2.0/10.0
$220,000
🖨 Deal sheet 📄 Offer letter ✓ Due diligence
Listing remarks MLS
This home features 3 Bedrooms with 1 Bonus/Office + 1 full bath. This listing contains 4 parcels (023,024,025 & 026) Sitting on 2.5 acres of full privacy in Lake Park Subdivision. NO FHA or USDA or any other Government loans - Buyers pay their own closing cost. Sellers are leasing the propane gas. /tank monthly
Key facts
- 2.58 acres
- New hvac
- Huge workshop
Tags
Property features AI
Finance
- HOA & community: Homeowners association with a $200 yearly fee
Exterior
- Parking: Detached 2-car garage; Off-street and designated parking on the main level
- Utilities: Septic tank
- Home design: Detached property
- Construction: Vinyl siding, block and frame construction
- Exterior features: Private, wooded lot with level and rolling slope areas; Country setting view; Storage building; Workshop
Interior
- Kitchen: Microwave; Refrigerator; Self-cleaning oven
- Flooring: Laminate; Vinyl
- Bathrooms: One full bathroom; One half bathroom
- Heating & cooling: Central heating; Propane heating option; Electric heating option; Central cooling
- Interior features: Pantry; Eat-in kitchen; Gas log fireplace (one)
Neighborhood map
What this means for you Summary
Snapshot
- This is a 3-bed/1.0-bath single-family listed at $220k.
Deal economics
- At list price, monthly cash flow is $-234 ($-3k/yr) — negative.
- To cash-flow at today's rent, offer at most $186k (15.4% below list).
- To meet the 1% rule (rent ≥ 1% of price), the offer needs to be $165k (25.0% below list).
- Recommended offer: $165k (25.0% below list) — sets the bar for 1% rule.
Location & tenants
- Location reads 61/100 on livability (#245 in TN) — a middle-class / working-renter tenant base. Strengths: cost of living A+, housing A+; Watch: employment C-, schools F, amenities F.
- Cumberland County (rural): math 30% / reading 31% proficiency, ranked #59 of 139 in TN (top 42%) — families likely to look elsewhere, expect single-tenant / working-renter base with shorter leases.
- Market conditions: 447 active listings in the ZIP; 1 comparable units currently listed for rent nearby; 114 units permitted in Cumberland County in 2024 (0 in 5+ unit buildings).
Forward outlook
- In year one you build about $24k of equity ($2k loan paydown + $22k appreciation (10.0% local appreciation)).
- Cumberland County population projected at +7% by 2050 — modest demand growth; plan on rents tracking national, not racing it.
- By year 2, paydown + projected appreciation supports a ~$38k cash-out refi (75% LTV) — recoverable capital for the next deal without selling this one.
Negotiation context
- It's been on market 27 days — a 2% lower offer ($217k) is reasonable based on typical stale-listing flexibility.
- 9 sale attempts since 20y ago with the ask held roughly flat each time — persistent listings suggest the price (not the market) is what's stuck; bring a comps-based counter.
- Current owner paid $82k; list at $220k implies a 168% gain — meaningful room to come down on a strong offer.
Questions for the listing agent
- What do current leases actually rent for vs. the listed asking? Can we see a recent rent roll and the last 12 months of T-12 income?
- Built in 1971 — when were the roof, HVAC, electrical panel, plumbing, and water heater last replaced?
- What does the HOA fee cover, when was the last increase, and are there any pending special assessments or reserve-fund shortfalls?
- Is there a deadline driving the sale (1031 exchange, divorce, estate, relocation)? That informs how much negotiation room exists.
- Schools are F-rated, which usually means shorter tenancies and higher turnover. Who's the typical renter profile here, and what's been the actual vacancy rate?
- The area grade is low — what's the realistic commute time and amenity access for the typical tenant pool here? Any planned neighborhood developments (good or bad) we should know about?
- What's the average days-on-market for RENTAL listings here right now (not sales)? A rising rental-DOM trend means longer vacancies and softer asking-rent achievability than the comps imply.
- What's the recent tenant-quality profile in this submarket — average credit score on applications, eviction rate, late-payment / NSF rate, and stable-employment percentage? A property-management company in the area should have these aggregated.
- How much new for-sale + rental construction is in the pipeline within 1–3 miles? Heavy new supply typically softens prices + rents 12–24 months out; constrained supply supports both.
Investment metrics
- 1% rule
- 0.75% ✗
- Cap rate
- 5.02%
- Cash-on-cash
- -4.56%
- DSCR
- 0.80
- GRM
- 11.1
CMA / ARV
No comps found within radius.
Projected returns pro-forma
10.0% appreciation · 3.0% rent growth · sell at horizon
- IRR
- 21.1%
- Equity multiple
- 2.70×
- Total profit
- $104,958
- Equity at exit
- $198,193
- IRR
- 19.1%
- Equity multiple
- 6.21×
- Total profit
- $320,867
- Equity at exit
- $427,412
Cash invested: $61,600 (down + closing). Projections, not guarantees.
Landlord ↔ Tenant lean methodology
- Overall (STATE)
- 87 Strongly Landlord-Friendly
- State Tennessee
- 87 Strongly Landlord-Friendly · R+13
- County
- — inherits STATE
- City
- — inherits STATE
ZIP-level market 38572
- Home prices YoY
- 10.4%
- Active inventory
- 447
- Price-to-rent
- 11.1×
Monthly cashflow live
- Estimated rent
- $1,650 medium interval (Pro) →
- Mortgage (P&I)
- −$1,154
- Tax est. 1.5%
- −$275 /mo · $3,300/yr
- Insurance
- −$92
- HOA
- −$17
- Vacancy / Maint / Mgmt
- −$346
- Net cashflow
- $-234
Break-even live
UW: 25.0% down · 7.5% · 30yr · 1.5% tax · 5.0% vac · 8.0% maint · 8.0% mgmt
Financing live
Cash to close
- Down payment
- $55,000
- Closing costs
- $6,600
- Reserves months
- —
- Total cash needed
- —
Loan-product check · same deal, 3 products live
Conventional
25% down · 7.5% · 30yr
- Down + closing
- —
- Monthly P&I
- —
- Monthly cashflow
- —
- DSCR
- —
- Eligible?
- —
Personal DTI + credit; lowest rate.
DSCR
20% down · 8.5% · 30yr
- Down + closing
- —
- Monthly P&I
- —
- Monthly cashflow
- —
- DSCR
- —
- Eligible?
- —
No personal income docs; deal must DSCR.
Hard money
10% down · 12.0% · 12mo
- Down + closing
- —
- Monthly P&I
- —
- Monthly cashflow
- —
- DSCR
- —
- Eligible?
- —
Short-term bridge; refi at stabilization.
Rent comps 1 comps
| Address | Beds | Baths | Sqft | Rent | $/sqft | DOM | Units | Dist |
|---|---|---|---|---|---|---|---|---|
| 1345 Midway Rd Crossville, TN | 3.0 | 2.0 | 1288 | $1,650 | $1.28 | 14d | 1 | 1.25mi |
HOA detail
- Monthly dues
- $17 · $204/yr
- Likely covers
- gas
Listing history 43 events
-
2026-06-18days on market $220,000 Active 27 DOM
-
2026-06-17days on market $220,000 Active 26 DOM
-
2026-06-16days on market $220,000 Active 25 DOM
-
2026-06-15days on market $220,000 Active 24 DOM
-
2026-06-13days on market $220,000 Active 22 DOM
-
2026-06-12days on market $220,000 Active 21 DOM
-
2026-06-09days on market $220,000 Active 18 DOM
-
2026-06-08days on market $220,000 Active 17 DOM
-
2026-06-08days on market $220,000 Active 16 DOM
-
2026-06-07days on market $220,000 Active 15 DOM
-
2026-06-03days on market $220,000 Active 12 DOM
-
2026-06-02days on market $220,000 Active 11 DOM
-
2026-06-01days on market $220,000 Active 10 DOM
-
2026-05-31days on market $220,000 Active 9 DOM
-
2026-05-31price $220,000 Active 8 DOM
-
2026-05-22$225,000 Active
-
2026-05-13status Under Contract 318-char remark
Show marketing remark (318 chars)
This home features 3 Bedrooms with 1 Bonus/Office + 1 full bath. This listing contains 4 parcels (023,024,025 & 026) Sitting on 2.5 acres of full privacy in Lake Park Subdivision. NO FHA or USDA or any other Government loans - Buyers pay their own closing cost. Sellers are leasing the propane gas. /tank monthly
-
2026-05-12$225,000 Active 318-char remark
Show marketing remark (318 chars)
This home features 3 Bedrooms with 1 Bonus/Office + 1 full bath. This listing contains 4 parcels (023,024,025 & 026) Sitting on 2.5 acres of full privacy in Lake Park Subdivision. NO FHA or USDA or any other Government loans - Buyers pay their own closing cost. Sellers are leasing the propane gas. /tank monthly
-
2025-09-14historical Pending - Continue to Show - Inspection
-
2025-09-14historical
-
2025-08-22price $214,500
-
2025-08-13price $232,000
-
2025-07-08price $250,000
-
2025-05-12price $264,500
-
2025-04-06price $265,000
-
2025-03-22price $267,000
-
2025-03-18price $277,700
-
2025-03-12$299,900 Active
-
2023-10-31historical
-
2023-08-30price $239,999
-
2023-08-18price $242,000
-
2023-08-10price $243,500
-
2023-07-24$245,000 Active
-
2020-05-26soldstatus $82,000 Closed
-
2020-05-26soldstatus $82,000
-
2020-05-26soldstatus $82,000
-
2020-04-24status Pending - Continue to Show
-
2020-03-11historical
-
2020-01-28price $84,900
-
2019-12-05$92,500 Active
-
2009-10-20$85,000
-
2007-11-09$92,500
-
2006-02-22$79,900
ⓘ Source: listings_history table (triggers on properties + properties_extension) + one-shot
backfill from property_details.listing_events for pre-trigger history.
Climate risk First Street
- Flood 1/10 Low FEMA zone X (unshaded) · 0% chance over 30 yrs
- Wildfire 3/10 Moderate
- Heat 3/10 Moderate 6 d/yr ≥98°F today · 16 d/yr by 30 yrs out
- Wind 3/10 Moderate 7% chance of damaging wind over 30 yrs
- Air quality 2/10 Low 2 unhealthy d/yr today · 2 by 30 yrs out
Nearby sold comps map
Loading sold comps map…
Walkable amenities ~0.75 mi
Loading nearby amenities…
Taxation est. · year 1
- Rental income
- $19,800
- − Mortgage interest
- −$12,323
- − Property taxes
- −$3,300
- − Insurance
- −$1,100
- − Repairs & maintenance
- −$1,584
- − Management
- −$1,584
- − HOA
- −$204
- − Depreciation
- −$6,400
- Taxable loss
- −$6,695
- Est. tax savings @ 24.0%
- +$1,607
- After-tax cash flow
- $-1,200/yr
For passive investors: Depreciation is non-cash, so a rental often shows a tax loss while cash-flowing — sheltering income. Rental losses are passive: they offset passive income freely, and up to $25,000/yr can offset ordinary (W-2) income if you actively participate and your MAGI is under $100k (phasing out to $0 by $150k); unused losses carry forward. On sale, claimed depreciation is recaptured at up to 25%, and gains may owe capital-gains tax (a 1031 exchange can defer both). Figures are a year-1 estimate at your 24.0% rate — not tax advice; consult a CPA.
Schools (NCES district)
- District
- Cumberland County
- NCES district ID
- 4700900
- Math proficiency
- 30% ▼ -10.00%
- Reading proficiency
- 31% ▼ -7.00%
- Median HH income
- $38,510
- Composite
- 25.52/100
- National rank
- #7438
- State rank
- #59 of 139 in TN
Livability — Lake Tansi
- Score
- 61/100
- State rank
- #245
- US rank
- #17630
Category grades
Schools grade is shown separately in the Schools card above.
Census & demographics
- Population (ZIP)
- 12,030
Population outlook (Cumberland County) Hauer SSP2
- Today (2025)
- 61,344 people
- By 2030
- 62,611 · +2.1%
- By 2040
- 64,547 · +5.2%
- By 2050
- 65,462 · +6.7%
- By 2075
- 66,839 · +9.0%
- By 2100
- 63,855 · +4.1%
Race, ethnicity, and origin ACS 2023
- Neighborhood character
- Predominantly White (95%)
- Race & ethnicity
- White 95% Hispanic / Latino 3% Two or more races 2%
- Common ancestry
- Romanian 3% Iranian 2% Italian 2%
- Foreign-born
- 1% · Canada
Political lean MEDSL · Cumberland
- 2024 margin
- Solid R (+58.9) · D 20.2% · R 79.1%
- 2008→2024 swing
- -21.8pp toward R · 2008: -37.1pp · 2024: -58.9pp
- All cycles
- 2024: R+58.9 2020: R+57.1 2016: R+57.8 2012: R+49.1 2008: R+37.1
Not yet ingested
- Civics
- —
Market trends
- HPI YoY
- ▲ 34.68%
- Current HPI
- 367.3069
- Rent YoY
- —
- Metro
- —
- State GDP YoY
- ▲ 2.78%
- F500 in state
- 22
Industry mix (Fortune 500 HQ in TN)
| Industry | F500 HQs | Revenue |
|---|---|---|
| Healthcare | 3 | $91B |
|
||
| Retail | 3 | $72B |
|
||
| Transportation / Logistics | 1 | $88B |
|
||
| Paper / Packaging | 1 | $19B |
|
||
| Insurance | 1 | $13B |
|
||
| Energy | 1 | $12B |
|
||
Price history
+181.6% since first listed28 events — show timeline
- 2026-05-22 Listed $225,000 Knoxville MLS
- 2026-05-13 Pending — FSBO.com
- 2026-05-12 Listed $225,000 FSBO.com
- 2025-09-14 Contingent — Knoxville MLS
- 2025-09-14 Listing Removed — Knoxville MLS
- 2025-08-22 Price Changed $214,500 Knoxville MLS
- 2025-08-13 Price Changed $232,000 Knoxville MLS
- 2025-07-08 Price Changed $250,000 Knoxville MLS
- 2025-05-12 Price Changed $264,500 Knoxville MLS
- 2025-04-06 Price Changed $265,000 Knoxville MLS
- 2025-03-22 Price Changed $267,000 Knoxville MLS
- 2025-03-18 Price Changed $277,700 Knoxville MLS
- 2025-03-12 Listed $299,900 Knoxville MLS
- 2023-10-31 Listing Removed — Knoxville MLS
- 2023-08-30 Price Changed $239,999 Knoxville MLS
- 2023-08-18 Price Changed $242,000 Knoxville MLS
- 2023-08-10 Price Changed $243,500 Knoxville MLS
- 2023-07-24 Listed $245,000 Knoxville MLS
- 2020-05-26 Sold (Public Records) $82,000 Public Records
- 2020-05-26 Sold (MLS) $82,000 REALTRACS as Distributed by MLS Grid
- 2020-05-26 Sold (MLS) $82,000 Knoxville MLS
- 2020-04-24 Relisted — Knoxville MLS
- 2020-03-11 Listing Removed — Knoxville MLS
- 2020-01-28 Price Changed $84,900 Knoxville MLS
- 2019-12-05 Listed $92,500 Knoxville MLS
- 2009-10-20 Listed $85,000 Knoxville MLS
- 2007-11-09 Listed $92,500 Knoxville MLS
- 2006-02-22 Listed $79,900 Knoxville MLS
Property tax history
+5.5%/yrLatest (2025): $350 · +0.0% YoY. Source: county tax records.
Cash-flow waterfall
monthlySold comps — $/sqft
last 12 mo · ≤1 miLoading sold comps…