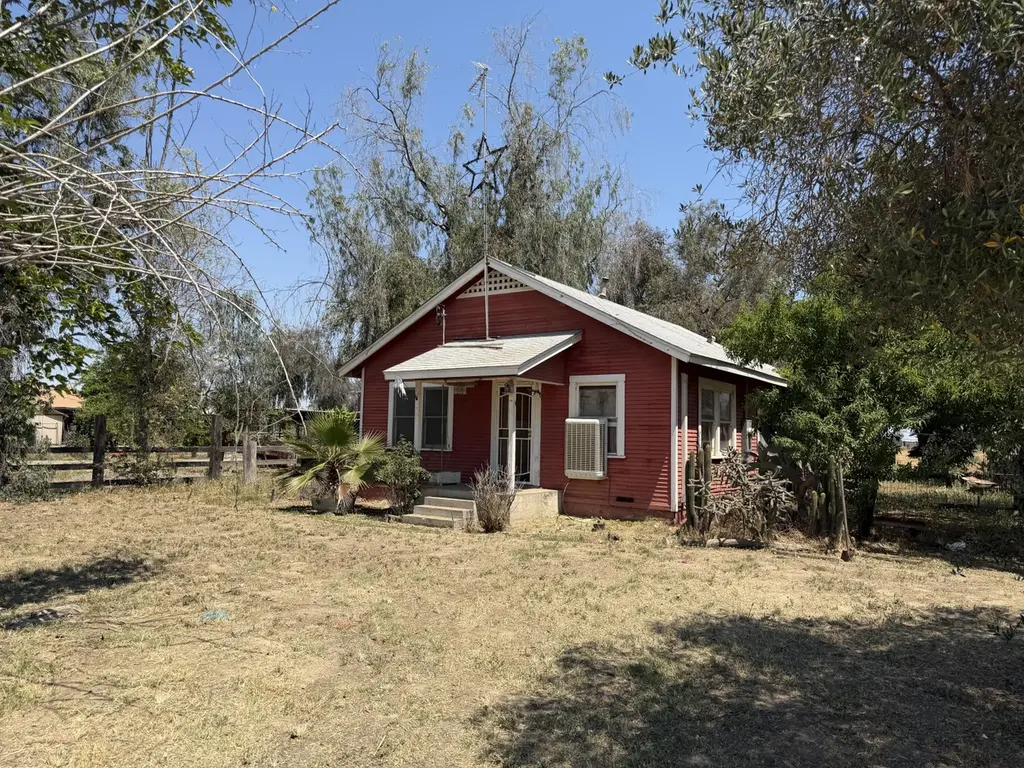
30614 Road 52 · West Goshen, CA
Flood risk 1/10 · Minimal
- FEMA flood zone
- X (unshaded)
- Chance of flooding over 30 yrs
- 0.0%
- Est. flood insurance / yr
- $507 – $1,088
Fire risk 4/10 · Minor
- Est. fire insurance / yr
- $659 – $1,223
Heat risk 8/10 · Major
- Hot days now (above 105°F)
- 7 days/yr
- Hot days in 30 yrs
- 19 days/yr
Wind risk 1/10 · Minimal
- Chance of severe wind over 30 yrs
- —
Air-quality risk 10/10 · Severe
- Unhealthy air days now
- 41 days/yr
- Unhealthy air days in 30 yrs
- 43 days/yr
Risk factors via First Street. Map © Google.
Why this score? — see what drove the C+ grade
The composite is a weighted blend of 9 inputs, each scored 0–100. Each bar is that input's sub-score; the figure is the points it added to the 100-point composite (weight × sub-score).
- Cash flow +25.5/30.0
- ARV discount +14.1/15.0
- DSCR +8.5/10.0
- 1% rule +5.7/10.0
- Rent growth +3.3/5.0
- Schools +3.0/10.0
- Condition / age +2.5/5.0
- Livability +1.7/5.0
- Appreciation +0.0/10.0
$160,000
🖨 Deal sheet 📄 Offer letter ✓ Due diligence
Listing remarks
Come see this country investment opportunity! This charming 2-bedroom home is brimming with potential for those with a decerning eye! Enjoy the tranquility of rural living with a versatile layout, including living room, dining room, kitchen and enclosed back patio/mud room all nestled on a large half acre of land. The home also includes efficient ductless mini-split units in the living room and bedrooms for year-round comfort. This fixer-upper is ready for your personal style to turn it into a cozy homestead. Perfect for those looking to downsize to the country or start their renovation journey.
Key facts
- 0.5 acre lot
- Built 1967
- Listed 5 days
Property features AI
Finance
- Other: Approximately 0.5 acre lot (about 147.5' x 147.5')
Exterior
- Utilities: Public water; Septic tank; Natural gas available and connected; Electricity connected
- Home design: Single-family residence; One story; Faces west
- Construction: Frame construction; Raised foundation on pillars/piers
- Exterior features: Composition roof
Interior
- Bathrooms: 1 full bathroom
- Heating & cooling: Ductless heating; Evaporative cooling; Ductless cooling; Window cooling units
- Interior features: Fixer condition
Neighborhood map
What this means for you Summary
Snapshot
- This is a 2-bed/1.0-bath single-family listed at $160k.
Deal economics
- At list price, monthly cash flow is $374 ($4k/yr) — positive.
- The deal already cash-flows at list — no discount required.
- Meets the 1% rule at list price ($2k rent vs $160k).
Location & tenants
- Location reads 34/100 on livability (#1,444 in CA) — a limited-amenity area; tenant pool skews transient or value-seeking. Strengths: housing B; Watch: schools F, crime F, amenities F.
- Visalia Unified (urban): math 30% / reading 40% proficiency, ranked #273 of 517 in CA (top 53%) — families likely to look elsewhere, expect single-tenant / working-renter base with shorter leases.
- Market conditions: Rents rising (+3.1%/yr); 552 active listings in the ZIP; solid renter incomes; 1,447 units permitted in Tulare County in 2024 (307 in 5+ unit buildings).
Forward outlook
- Local home prices are declining (-3.0%/yr); year-one equity from $1k of loan paydown is wiped out by about $5k of value loss. Plan a longer hold.
- Tulare County population projected at +10% by 2050 — modest demand growth; plan on rents tracking national, not racing it.
Negotiation context
- Only 5 days on market — expect competitive offers; lowballing is unlikely to land.
- Current owner paid $49k; list at $160k implies a 227% gain — meaningful room to come down on a strong offer.
Risks & watch-outs
- Climate carrying-cost: extreme-heat days projected 7→19/yr by 2055 (HVAC capex compounding) — expect insurance premiums to compound above CPI over the hold.
Questions for the listing agent
- Built in 1967 — when were the roof, HVAC, electrical panel, plumbing, and water heater last replaced?
- Is there a deadline driving the sale (1031 exchange, divorce, estate, relocation)? That informs how much negotiation room exists.
- Schools are F-rated, which usually means shorter tenancies and higher turnover. Who's the typical renter profile here, and what's been the actual vacancy rate?
- Crime grade is F in this area — have there been break-ins, vandalism, or insurance claims at this property in the last 3 years? What carrier currently insures it and at what premium?
- What's the average days-on-market for RENTAL listings here right now (not sales)? A rising rental-DOM trend means longer vacancies and softer asking-rent achievability than the comps imply.
- What's the recent tenant-quality profile in this submarket — average credit score on applications, eviction rate, late-payment / NSF rate, and stable-employment percentage? A property-management company in the area should have these aggregated.
- How much new for-sale + rental construction is in the pipeline within 1–3 miles? Heavy new supply typically softens prices + rents 12–24 months out; constrained supply supports both.
Investment metrics
- 1% rule
- 1.07% ✓
- Cap rate
- 9.10%
- Cash-on-cash
- 10.01%
- DSCR
- 1.45
- GRM
- 7.8
CMA / ARV
- ARV (on-the-fly)
- $187,562
- Comps found
- 1
Show comp detail 1 sale within ~0.75 mi
| Address | Dist | Beds/Ba | Sqft | Sold | Price | $/sf | Match |
|---|---|---|---|---|---|---|---|
| 30614 Road 52 | 0.00mi | 2/1.0 | 982 (0%) | 0mo | $188,000 | $191 | 100 |
Match score weights: distance 35% · size 25% · config 20% · recency 20%. Top-matched comps best support the ARV.
Projected returns pro-forma
-3.0% appreciation · 3.12% rent growth · sell at horizon
- IRR
- -1.2%
- Equity multiple
- 0.96×
- Total profit
- $-1,967
- Equity at exit
- $23,857
- IRR
- 8.6%
- Equity multiple
- 1.66×
- Total profit
- $29,583
- Equity at exit
- $13,834
Cash invested: $44,800 (down + closing). Projections, not guarantees.
Landlord ↔ Tenant lean methodology
- Overall (STATE)
- 18 Strongly Tenant-Friendly
- State California
- 18 Strongly Tenant-Friendly · D+13
- County
- — inherits STATE
- City
- — inherits STATE
ZIP-level market 93291
- Rents YoY
- 3.1%
- Active inventory
- 552
- Price-to-rent
- 7.8×
Monthly cashflow live
- Estimated rent
- $1,714 medium interval (Pro) →
- Mortgage (P&I)
- −$839
- Tax from tax record
- −$74 /mo · $893/yr
- Insurance
- −$67
- HOA
- −$0
- Vacancy / Maint / Mgmt
- −$360
- Net cashflow
- $374
Break-even live
UW: 25.0% down · 7.5% · 30yr · 1.5% tax · 5.0% vac · 8.0% maint · 8.0% mgmt
Financing live
Cash to close
- Down payment
- $40,000
- Closing costs
- $4,800
- Reserves months
- —
- Total cash needed
- —
Loan-product check · same deal, 3 products live
Conventional
25% down · 7.5% · 30yr
- Down + closing
- —
- Monthly P&I
- —
- Monthly cashflow
- —
- DSCR
- —
- Eligible?
- —
Personal DTI + credit; lowest rate.
DSCR
20% down · 8.5% · 30yr
- Down + closing
- —
- Monthly P&I
- —
- Monthly cashflow
- —
- DSCR
- —
- Eligible?
- —
No personal income docs; deal must DSCR.
Hard money
10% down · 12.0% · 12mo
- Down + closing
- —
- Monthly P&I
- —
- Monthly cashflow
- —
- DSCR
- —
- Eligible?
- —
Short-term bridge; refi at stabilization.
Listing history 3 events
-
2026-05-12status Pending
-
2026-05-08$160,000 Active
-
1996-03-14soldstatus $49,000
ⓘ Source: listings_history table (triggers on properties + properties_extension) + one-shot
backfill from property_details.listing_events for pre-trigger history.
Tax reassessment forecast CA · Resets to sale price
- Current annual tax
- $893 · $74/mo
- Projected year-2 tax
- $1,216 · $101/mo
- Expected delta
- +$323/yr (+$27/mo · 36.2%)
ⓘ Screening estimate from a state-policy table — verify with the county assessor before closing.
Climate risk First Street
- Flood 1/10 Low FEMA zone X (unshaded) · 0% chance over 30 yrs
- Wildfire 4/10 Moderate
- Heat 8/10 Severe 7 d/yr ≥105°F today · 19 d/yr by 30 yrs out
- Wind 1/10 Low
- Air quality 10/10 Extreme 41 unhealthy d/yr today · 43 by 30 yrs out
Nearby sold comps map
Loading sold comps map…
Walkable amenities ~0.75 mi
Loading nearby amenities…
Taxation est. · year 1
- Rental income
- $20,565
- − Mortgage interest
- −$8,962
- − Property taxes
- −$893
- − Insurance
- −$800
- − Repairs & maintenance
- −$1,645
- − Management
- −$1,645
- − Depreciation
- −$4,655
- Taxable income
- $1,965
- Est. tax owed @ 24.0%
- −$472
- After-tax cash flow
- $4,013/yr
For passive investors: Depreciation is non-cash, so a rental often shows a tax loss while cash-flowing — sheltering income. Rental losses are passive: they offset passive income freely, and up to $25,000/yr can offset ordinary (W-2) income if you actively participate and your MAGI is under $100k (phasing out to $0 by $150k); unused losses carry forward. On sale, claimed depreciation is recaptured at up to 25%, and gains may owe capital-gains tax (a 1031 exchange can defer both). Figures are a year-1 estimate at your 24.0% rate — not tax advice; consult a CPA.
Schools (NCES district)
- District
- Visalia Unified
- NCES district ID
- 0641160
- Math proficiency
- 30% ▼ -3.00%
- Reading proficiency
- 40% ▼ -10.00%
- Median HH income
- $51,672
- Composite
- 30.47/100
- National rank
- #6223
- State rank
- #273 of 517 in CA
Livability — West Goshen
- Score
- 34/100
- State rank
- #1444
- US rank
- #27758
Category grades
Schools grade is shown separately in the Schools card above.
Census & demographics
- Census place
- West Goshen, CA
- County
- Tulare County · 323,826 people
- Metro
- Visalia, CA
- Population (ZIP)
- 63,568
- Household income
- $82,610
- Rent vs Own
- Severe rent burden
- 1764.0
Population outlook (Tulare County) Hauer SSP2
- Today (2025)
- 484,681 people
- By 2030
- 496,241 · +2.4%
- By 2040
- 518,507 · +7.0%
- By 2050
- 534,920 · +10.4%
- By 2075
- 548,417 · +13.2%
- By 2100
- 513,085 · +5.9%
Race, ethnicity, and origin ACS 2023
- Neighborhood character
- Diverse neighborhood (Simpson 0.60)
- Race & ethnicity
- Hispanic / Latino 53% White 34% Two or more races 17% Asian 9% Black 2% Native American 1%
- Hispanic origin (detail)
- Mexican 48%
- Common ancestry
- Russian 2% Iranian 2% Lithuanian 1%
- Foreign-born
- 19% · Canada
- Languages at home
- 58% English-only · Spanish 36% Other Asian/Pacific 3% Other Indo-European 1%
Political lean MEDSL · Tulare
- 2024 margin
- Strong R (+20.7) · D 38.5% · R 59.2% · Other 2.3%
- 2008→2024 swing
- -5.4pp toward R · 2008: -15.3pp · 2024: -20.7pp
- All cycles
- 2024: R+20.7 2020: R+7.8 2016: R+12.1 2012: R+17.8 2008: R+15.3
Not yet ingested
- Civics
- —
Market trends
- HPI YoY
- ▼ -204.95%
- Current HPI
- 329.0192
- Rent YoY
- ▲ 3.12%
- Metro
- Visalia, CA
- State GDP YoY
- ▲ 3.21%
- F500 in state
- 116
Industry mix (Fortune 500 HQ in CA)
| Industry | F500 HQs | Revenue |
|---|---|---|
| Technology | 27 | $1,492B |
|
||
| Financial Services | 3 | $174B |
|
||
| Retail | 3 | $44B |
|
||
| Insurance | 3 | $26B |
|
||
| Media / Entertainment | 2 | $115B |
|
||
| Pharmaceuticals / Biotech | 2 | $62B |
|
||
Price history
+226.5% since first listed3 events — show timeline
- 2026-05-12 Pending — TCMLS
- 2026-05-08 Listed $160,000 TCMLS
- 1996-03-14 Sold (Public Records) $49,000 Public Records
Property tax history
+2.9%/yrLatest (2025): $893 · +3.0% YoY. Source: county tax records.
Cash-flow waterfall
monthlySold comps — $/sqft
last 12 mo · ≤1 miLoading sold comps…