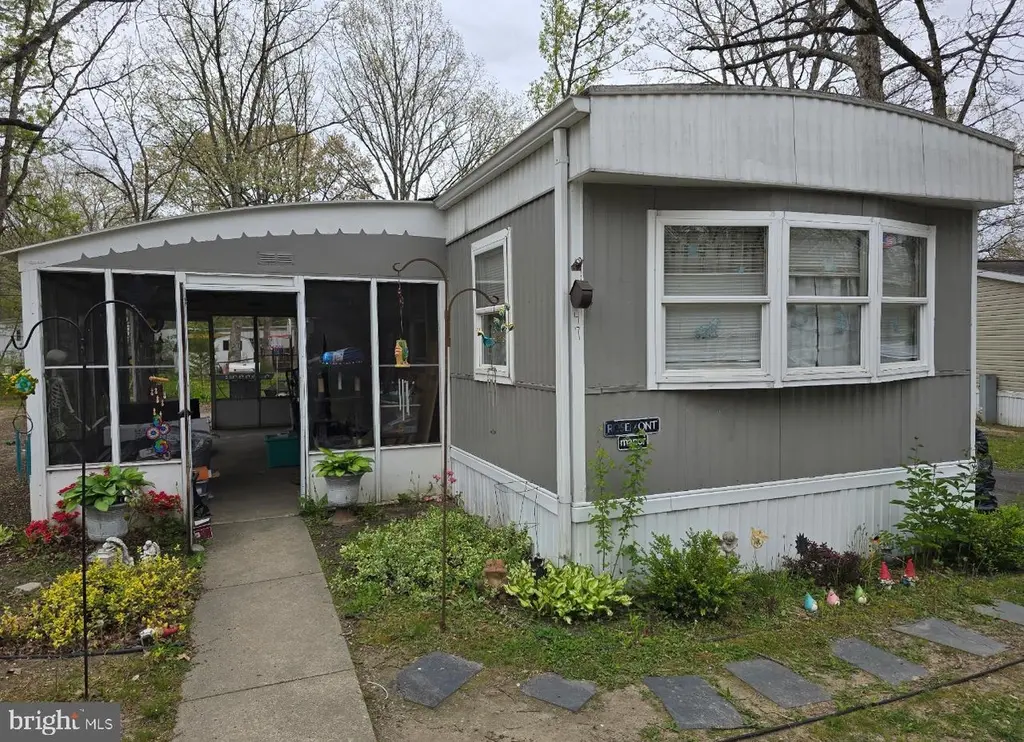
47 Schalick Dr · Franklinville, NJ
Flood risk No data
- FEMA flood zone
- —
- Chance of flooding over 30 yrs
- —
- Est. flood insurance / yr
- —
Fire risk No data
- Est. fire insurance / yr
- —
Heat risk No data
- Hot days now (above threshold)
- —
- Hot days in 30 yrs
- —
Wind risk No data
- Chance of severe wind over 30 yrs
- —
Air-quality risk No data
- Unhealthy air days now
- —
- Unhealthy air days in 30 yrs
- —
Risk factors via First Street. Map © Google.
Why this score? — see what drove the B+ grade
The composite is a weighted blend of 9 inputs, each scored 0–100. Each bar is that input's sub-score; the figure is the points it added to the 100-point composite (weight × sub-score).
- Cash flow +30.0/30.0
- ARV discount +15.0/15.0
- 1% rule +10.0/10.0
- DSCR +10.0/10.0
- Schools +3.1/10.0
- Rent growth +2.5/5.0
- Livability +2.5/5.0
- Condition / age +2.2/5.0
- Appreciation +0.0/10.0
$55,000
🖨 Deal sheet 📄 Offer letter ✓ Due diligence
Listing remarks
🏡 Fully Renovated Mobile Home for Sale in Harding Woods Don’t miss this opportunity to own a beautifully renovated 2-bedroom, 1-bathroom mobile home in the desirable Harding Woods community. This move-in-ready home has been updated from top to bottom and offers comfort, convenience, and affordability. Features Include: ✔ 2 spacious bedrooms ✔ 1 full bathroom ✔ Brand-new appliances ✔ New flooring throughout ✔ Fresh interior paint ✔ Natural gas heating ✔ Central air conditioning ✔ Ceiling fans in both bedrooms and the living room ✔ Large screened-in porch, perfect for relaxing or entertaining guests ✔ Laundry hookups ✔ Off-street parking This charming home provides a comfortable living
Key facts
- Built 1975
Property features AI
Finance
- Other: Annual ground rent listed in income/expense items
- Financial info: Monthly land lease of $746; Land lease paid annually noted; 99 years remaining; Ground rent exists
- HOA & community: Association covers common area maintenance, snow removal, trash, water and sewer
Exterior
- Utilities: Public water; Public sewer
- Home design: Manufactured home; Land lease ownership
- Construction: Estimated year built; Above-grade construction noted
- Exterior features: Personal pool; Above-grade other structures
Interior
- Kitchen: Eat-in kitchen
- Bedrooms: 2 bedrooms on the main level; Rooms include: Living Room, Master Bedroom, Kitchen, Bedroom 1
- Bathrooms: 1 full bathroom (main level)
- Heating & cooling: 90% forced air heating (oil); Central air conditioning (electric); Electric hot water
- Interior features: Eat-in kitchen; Estimated living area
- Laundry & utility: Main floor laundry
Neighborhood map
What this means for you Summary
Snapshot
- This is a 2-bed/1.0-bath single-family listed at $55k. Condition is rated fair.
Deal economics
- At list price, monthly cash flow is $620 ($7k/yr) — positive.
- The deal already cash-flows at list — no discount required.
- Meets the 1% rule at list price ($1k rent vs $55k).
- Cap rate 19.8% vs local median 2.5% in Franklinville — top-decile yield for the area; either an underpriced asset or a hidden risk that comps aren't pricing in. Stress-test before assuming the spread holds.
Location & tenants
- Location reads: area grade B — affects rentability + tenant quality, not the cash-flow math above.
- Pittsgrove Township School District (rural): math 18% / reading 48% proficiency, ranked #295 of 472 in NJ (top 62%) — families likely to look elsewhere, expect single-tenant / working-renter base with shorter leases.
- Market conditions: 79 active listings in the ZIP; 95 units permitted in Salem County in 2024 (0 in 5+ unit buildings).
Forward outlook
- Local home prices are declining (-3.0%/yr); year-one equity from $380 of loan paydown is wiped out by about $2k of value loss. Plan a longer hold.
- Salem County population projected at -23% by 2050 — secular population decline; favor cash flow + early exit over multi-decade hold.
- At projected returns (-3.0% appreciation + 3.0% rent growth), your $15k cash investment doubles in ~3 years — after that, you're playing with house money.
Negotiation context
- Only 2 days on market — expect competitive offers; lowballing is unlikely to land.
Questions for the listing agent
- Have any recent inspections been done? Can we get a copy of the seller's disclosures and any deferred-maintenance estimates?
- Built in 1975 — when were the roof, HVAC, electrical panel, plumbing, and water heater last replaced?
- Is there a deadline driving the sale (1031 exchange, divorce, estate, relocation)? That informs how much negotiation room exists.
- What's the average days-on-market for RENTAL listings here right now (not sales)? A rising rental-DOM trend means longer vacancies and softer asking-rent achievability than the comps imply.
- What's the recent tenant-quality profile in this submarket — average credit score on applications, eviction rate, late-payment / NSF rate, and stable-employment percentage? A property-management company in the area should have these aggregated.
- How much new for-sale + rental construction is in the pipeline within 1–3 miles? Heavy new supply typically softens prices + rents 12–24 months out; constrained supply supports both.
Investment metrics
- 1% rule
- 2.30% ✓
- Cap rate
- 19.83%
- Cash-on-cash
- 48.34%
- DSCR
- 3.15
- GRM
- 3.6
CMA / ARV
- ARV (on-the-fly)
- $67,200
- Comps found
- 11
Show comp detail 11 sales within ~0.75 mi
| Address | Dist | Beds/Ba | Sqft | Sold | Price | $/sf | Match |
|---|---|---|---|---|---|---|---|
| 43 Hazelwood Dr | 0.10mi | 2/1.0 | 860 (+2%) | 11mo | $69,000 | $80 | 82 |
| 88 Hazelwood Dr | 0.10mi | 2/2.0 | 800 (-5%) | 9mo | $64,000 | $80 | 76 |
| 25 Elmwood Dr | 0.06mi | 2/1.0 | 768 (-9%) | 10mo | $20,000 | $26 | 75 |
| 4 Donald Pl | 0.29mi | 2/2.0 | 868 (+3%) | 6mo | $50,000 | $58 | 71 |
| 1 Cedarwood Dr | 0.08mi | 2/1.0 | 750 (-11%) | 16mo | $60,000 | $80 | 65 |
| 7 Elmwood Dr | 0.14mi | 2/2.0 | 784 (-7%) | 18mo | $109,000 | $139 | 64 |
| 26 Cedarwood Ave | 0.09mi | 2/2.0 | 952 (+13%) | 9mo | $83,000 | $87 | 62 |
| 5 Luann Dr | 0.41mi | 2/1.0 | 860 (+2%) | 23mo | $77,500 | $90 | 58 |
| 248 Route 40 Lot D10 | 0.73mi | 2/1.0 | 800 (-5%) | 1mo | $50,000 | $63 | 57 |
| 5 Elmwood Cir | 0.14mi | 3/2.0 (+1) | 924 (+10%) | 19mo | $125,000 | $135 | 52 |
| 248 Harding Hwy Unit E-10 | 0.66mi | 2/1.0 | 800 (-5%) | 24mo | $74,900 | $94 | 42 |
Match score weights: distance 35% · size 25% · config 20% · recency 20%. Top-matched comps best support the ARV.
Projected returns pro-forma
-3.0% appreciation · 3.0% rent growth · sell at horizon
- IRR
- 45.9%
- Equity multiple
- 2.99×
- Total profit
- $30,616
- Equity at exit
- $8,201
- IRR
- 51.7%
- Equity multiple
- 6.04×
- Total profit
- $77,612
- Equity at exit
- $4,755
Cash invested: $15,400 (down + closing). Projections, not guarantees.
Landlord ↔ Tenant lean methodology
- Overall (STATE)
- 21 Tenant-Leaning
- State New Jersey
- 21 Tenant-Leaning · D+6
- County
- — inherits STATE
- City
- — inherits STATE
ZIP-level market 08318
- Home prices YoY
- -16.6%
- Active inventory
- 79
- Price-to-rent
- 3.6×
Monthly cashflow live
- Estimated rent
- $1,266 medium interval (Pro) →
- Mortgage (P&I)
- −$288
- Tax est. 1.5%
- −$69 /mo · $825/yr
- Insurance
- −$23
- HOA
- −$0
- Vacancy / Maint / Mgmt
- −$266
- Net cashflow
- $620
Break-even live
UW: 25.0% down · 7.5% · 30yr · 1.5% tax · 5.0% vac · 8.0% maint · 8.0% mgmt
Financing live
Cash to close
- Down payment
- $13,750
- Closing costs
- $1,650
- Reserves months
- —
- Total cash needed
- —
Loan-product check · same deal, 3 products live
Conventional
25% down · 7.5% · 30yr
- Down + closing
- —
- Monthly P&I
- —
- Monthly cashflow
- —
- DSCR
- —
- Eligible?
- —
Personal DTI + credit; lowest rate.
DSCR
20% down · 8.5% · 30yr
- Down + closing
- —
- Monthly P&I
- —
- Monthly cashflow
- —
- DSCR
- —
- Eligible?
- —
No personal income docs; deal must DSCR.
Hard money
10% down · 12.0% · 12mo
- Down + closing
- —
- Monthly P&I
- —
- Monthly cashflow
- —
- DSCR
- —
- Eligible?
- —
Short-term bridge; refi at stabilization.
Listing history 17 events
-
2026-06-19days on market $55,000 Active 2 DOM
-
2026-06-17statusdays on market $55,000 Active 1 DOM
-
2026-06-17days on market $55,000 Coming Soon 17 DOM
-
2026-06-17remarks 693-char remark
-
2026-06-17price $55,000 Coming Soon 16 DOM
-
2026-06-16days on market $53,000 Coming Soon 16 DOM
-
2026-06-15days on market $53,000 Coming Soon 15 DOM
-
2026-06-14days on market $53,000 Coming Soon 13 DOM
-
2026-06-13days on market $53,000 Coming Soon 12 DOM
-
2026-06-10days on market $53,000 Coming Soon 10 DOM
-
2026-06-09days on market $53,000 Coming Soon 9 DOM
-
2026-06-08days on market $53,000 Coming Soon 8 DOM
-
2026-06-07days on market $53,000 Coming Soon 7 DOM
-
2026-06-05days on market $53,000 Coming Soon 4 DOM
-
2026-06-02days on market $53,000 Coming Soon 2 DOM
-
2026-06-01remarks 14-char remark
-
2026-06-01$53,000 Coming Soon 1 DOM
ⓘ Source: listings_history table (triggers on properties + properties_extension) + one-shot
backfill from property_details.listing_events for pre-trigger history.
Nearby sold comps map
Loading sold comps map…
Walkable amenities ~0.75 mi
Loading nearby amenities…
Taxation est. · year 1
- Rental income
- $15,196
- − Mortgage interest
- −$3,081
- − Property taxes
- −$825
- − Insurance
- −$275
- − Repairs & maintenance
- −$1,216
- − Management
- −$1,216
- − Depreciation
- −$1,600
- Taxable income
- $6,984
- Est. tax owed @ 24.0%
- −$1,676
- After-tax cash flow
- $5,768/yr
For passive investors: Depreciation is non-cash, so a rental often shows a tax loss while cash-flowing — sheltering income. Rental losses are passive: they offset passive income freely, and up to $25,000/yr can offset ordinary (W-2) income if you actively participate and your MAGI is under $100k (phasing out to $0 by $150k); unused losses carry forward. On sale, claimed depreciation is recaptured at up to 25%, and gains may owe capital-gains tax (a 1031 exchange can defer both). Figures are a year-1 estimate at your 24.0% rate — not tax advice; consult a CPA.
Condition & rehab AI · 2 photos
The home is a mobile home with fair exterior condition and some wear and tear. It has a need for cosmetic updates, including landscaping, painting, and fencing. These updates can significantly increase its resale and rental value.
Repairs flagged
- Minor Landscaping — The landscaping is overgrown and could benefit from trimming and planting.
- Minor Fencing — The fencing shows some wear and could be repainted or replaced.
- Minor Driveway and Sidewalk — The driveway and sidewalk appear to be in fair condition but could be cleaned and repaired if needed.
- Minor Exterior Paint — The siding shows some discoloration and could be repainted for a fresh look.
Value-add opportunities
- Both Landscaping — A well-maintained landscape can enhance curb appeal and property value.
- Both Painting — Fresh paint can improve the home's appearance and increase its value.
- Both Fencing — A new or repainted fence can enhance the home's curb appeal and property value.
- Both Driveway and Sidewalk — A clean and repaired driveway and sidewalk can improve the home's curb appeal and property value.
Renovation cost estimate screening
| Repair item | Severity | Est. cost |
|---|---|---|
| Landscaping · The landscaping is overgrown and could benefit from trimming and planting. | Minor | $500–3,000 |
| Fencing · The fencing shows some wear and could be repainted or replaced. | Minor | $500–3,000 |
| Driveway and Sidewalk · The driveway and sidewalk appear to be in fair condition but could be cleaned and repaired if needed. | Minor | $500–3,000 |
| Exterior Paint · The siding shows some discoloration and could be repainted for a fresh look. | Minor | $500–3,000 |
| Total estimated repair cost · 4 items | $2,000–12,000 |
Value-add ROI direction
- Both Landscaping — A well-maintained landscape can enhance curb appeal and property value. ↑
- Both Painting — Fresh paint can improve the home's appearance and increase its value. ↑
- Both Fencing — A new or repainted fence can enhance the home's curb appeal and property value. ↑
- Both Driveway and Sidewalk — A clean and repaired driveway and sidewalk can improve the home's curb appeal and property value. ↑
ⓘ Cost ranges are severity-bucket heuristics (US national rule-of-thumb). Get contractor quotes + a written scope before underwriting a rehab budget.
Schools (NCES district)
- District
- Pittsgrove Township School District
- NCES district ID
- 3413110
- Math proficiency
- 18% ▼ -22.00%
- Reading proficiency
- 48% ▼ -8.00%
- Median HH income
- $71,126
- Composite
- 30.59/100
- National rank
- #6201
- State rank
- #295 of 472 in NJ
Livability — Franklinville
No livability data for this city. (Only ~50 U.S. cities are tracked.)
Census & demographics
- Population (ZIP)
- 12,149
Population outlook (Salem County) Hauer SSP2
- Today (2025)
- 59,905 people
- By 2030
- 57,351 · -4.3%
- By 2040
- 51,837 · -13.5%
- By 2050
- 46,356 · -22.6%
- By 2075
- 36,452 · -39.2%
- By 2100
- 28,907 · -51.7%
Race, ethnicity, and origin ACS 2023
- Neighborhood character
- Predominantly White (79%)
- Race & ethnicity
- White 79% Hispanic / Latino 9% Black 7% Two or more races 7%
- Hispanic origin (detail)
- Mexican 2% Puerto Rican 6%
- Common ancestry
- Lithuanian 3% Romanian 3% Serbian 1%
- Foreign-born
- 1%
- Languages at home
- 93% English-only · Spanish 5%
Political lean MEDSL · Salem
- 2024 margin
- R (+19.2) · D 39.6% · R 58.8% · Other 1.6%
- 2008→2024 swing
- -23.1pp toward R · 2008: 3.9pp · 2024: -19.2pp
- All cycles
- 2024: R+19.2 2020: R+12.8 2016: R+15.4 2012: D+0.8 2008: D+3.9
Not yet ingested
- Civics
- —
Market trends
- HPI YoY
- ▼ -56.68%
- Current HPI
- 284.9025
- Rent YoY
- —
- Metro
- —
- State GDP YoY
- ▲ 2.05%
- F500 in state
- 34
Industry mix (Fortune 500 HQ in NJ)
| Industry | F500 HQs | Revenue |
|---|---|---|
| Consumer Goods | 3 | $31B |
|
||
| Pharmaceuticals | 2 | $153B |
|
||
| Technology | 2 | $21B |
|
||
| Insurance | 2 | $20B |
|
||
| Healthcare | 2 | $19B |
|
||
| Financial Services | 1 | $70B |
|
||
Price history
1 event — show timeline
- 2026-05-31 Coming Soon $53,000 BRIGHT MLS
Cash-flow waterfall
monthlySold comps — $/sqft
last 12 mo · ≤1 miLoading sold comps…