2308 S Naclerio Ln · Boise City, ID
Flood risk 1/10 · Minimal
- FEMA flood zone
- X (unshaded)
- Chance of flooding over 30 yrs
- 0.0%
- Est. flood insurance / yr
- $507 – $1,088
Fire risk 1/10 · Minimal
- Est. fire insurance / yr
- $584 – $1,086
Heat risk 4/10 · Minor
- Hot days now (above 96°F)
- 7 days/yr
- Hot days in 30 yrs
- 18 days/yr
Wind risk 1/10 · Minimal
- Chance of severe wind over 30 yrs
- —
Air-quality risk 8/10 · Major
- Unhealthy air days now
- 14 days/yr
- Unhealthy air days in 30 yrs
- 19 days/yr
Risk factors via First Street. Map © Google.
Why this score? — see what drove the B+ grade
The composite is a weighted blend of 9 inputs, each scored 0–100. Each bar is that input's sub-score; the figure is the points it added to the 100-point composite (weight × sub-score).
- Cash flow +30.0/30.0
- ARV discount +13.9/15.0
- 1% rule +10.0/10.0
- DSCR +10.0/10.0
- Rent growth +4.3/5.0
- Schools +4.2/10.0
- Livability +2.5/5.0
- Condition / age +2.5/5.0
- Appreciation +0.0/10.0
$64,990
🖨 Deal sheet 📄 Offer letter ✓ Due diligence
Listing remarks MLS
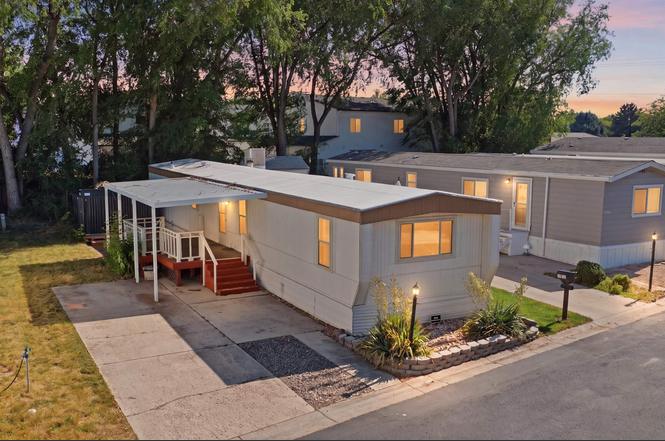
Clean, quiet, shady street behind Country Club Manor mobile home park! Single wide home needing some updates. Clean, functional, ready-to-live-in home. Lot rent $445 includes water & trash. Home is next to Phillippi Park.
Key facts
- Newer appliances
- Covered patio
- Storage shed
Tags
Property features AI
Exterior
- Parking: Finished driveway
- Utilities: City water service; Sewer connected
- Home design: Manufactured on land; Built in 1983
- Construction: Other roof type
- Exterior features: Covered patio/deck; Storage shed; Located in a mobile home park; Bus service on city route
Interior
- Kitchen: Dishwasher; Disposal; Refrigerator
- Bedrooms: Primary bedroom on main level; Second bedroom on main level
- Flooring: Carpet; Laminate
- Bathrooms: 2 bathrooms
- Heating & cooling: Forced air heating (natural gas); Central air conditioning
- Interior features: Primary bedroom has an en-suite bath; Split bedroom floorplan
- Laundry & utility: Washer; Dryer; Electric water heater
Neighborhood map
What this means for you Summary
Snapshot
- This is a 2-bed/2.0-bath manufactured listed at $65k.
Deal economics
- At list price, monthly cash flow is $722 ($9k/yr) — positive.
- The deal already cash-flows at list — no discount required.
- Meets the 1% rule at list price ($1k rent vs $65k).
- Cap rate 19.6% vs local median 2.6% in Boise City — top-decile yield for the area; either an underpriced asset or a hidden risk that comps aren't pricing in. Stress-test before assuming the spread holds.
Location & tenants
- Location reads: area grade B — affects rentability + tenant quality, not the cash-flow math above.
- Boise Independent District (urban): math 42% / reading 56% proficiency, ranked #36 of 92 in ID (top 39%) — families likely to look elsewhere, expect single-tenant / working-renter base with shorter leases.
- Zoned schools: Hillcrest Elementary School (math 27% / reading 32%, grade F, #306 of 357 statewide, top 88%, 280 students, 71% FRL); Borah Senior High School (math 34% / reading 57%, grade D-, #59 of 169 statewide, top 35%, 1,289 students, 25% FRL).
- Market conditions: Rents rising fast (+7.4%/yr); 135 active listings in the ZIP; 12 comparable units currently listed for rent nearby; rentals at typical pace (median 19d on market — plan ~3-4 weeks tenant-placement turnaround); 5,129 units permitted in Ada County in 2024 (414 in 5+ unit buildings).
Forward outlook
- Local home prices are declining (-3.0%/yr); year-one equity from $450 of loan paydown is wiped out by about $2k of value loss. Plan a longer hold.
- Ada County population projected at +45% by 2050 — long-run rental-demand tailwind backs the buy-and-hold thesis.
- At projected returns (-3.0% appreciation + 7.4% rent growth), your $18k cash investment doubles in ~3 years — after that, you're playing with house money.
Negotiation context
- Only 3 days on market — expect competitive offers; lowballing is unlikely to land.
- 4 sale attempts since 5y ago with the ask held roughly flat each time — persistent listings suggest the price (not the market) is what's stuck; bring a comps-based counter.
Questions for the listing agent
- Is there a deadline driving the sale (1031 exchange, divorce, estate, relocation)? That informs how much negotiation room exists.
- What's the average days-on-market for RENTAL listings here right now (not sales)? A rising rental-DOM trend means longer vacancies and softer asking-rent achievability than the comps imply.
- What's the recent tenant-quality profile in this submarket — average credit score on applications, eviction rate, late-payment / NSF rate, and stable-employment percentage? A property-management company in the area should have these aggregated.
- How much new for-sale + rental construction is in the pipeline within 1–3 miles? Heavy new supply typically softens prices + rents 12–24 months out; constrained supply supports both.
Investment metrics
- 1% rule
- 2.28% ✓
- Cap rate
- 19.62%
- Cash-on-cash
- 47.60%
- DSCR
- 3.12
- GRM
- 3.7
CMA / ARV
- ARV (on-the-fly)
- $75,768
- Comps found
- 4
Show comp detail 4 sales within ~0.75 mi
| Address | Dist | Beds/Ba | Sqft | Sold | Price | $/sf | Match |
|---|---|---|---|---|---|---|---|
| 5209 W Targee St #17 | 0.05mi | 2/1.0 | 924 (0%) | 4mo | $55,000 | $60 | 90 |
| 2316 S Naclerio Ln | 0.01mi | 2/2.0 | 924 (0%) | 12mo | $99,900 | $108 | 90 |
| 5209 W Targee St #18 St | 0.05mi | 2/2.0 | 980 (+6%) | 10mo | $79,000 | $81 | 79 |
| 2263 Naclerio Ln | 0.03mi | 3/1.5 (+1) | 980 (+6%) | 17mo | $79,900 | $82 | 68 |
Match score weights: distance 35% · size 25% · config 20% · recency 20%. Top-matched comps best support the ARV.
Projected returns pro-forma
-3.0% appreciation · 7.38% rent growth · sell at horizon
- IRR
- 49.9%
- Equity multiple
- 3.32×
- Total profit
- $42,282
- Equity at exit
- $9,690
- IRR
- 57.2%
- Equity multiple
- 7.96×
- Total profit
- $126,741
- Equity at exit
- $5,619
Cash invested: $18,197 (down + closing). Projections, not guarantees.
Landlord ↔ Tenant lean methodology
- Overall (STATE)
- 91 Strongly Landlord-Friendly
- State Idaho
- 91 Strongly Landlord-Friendly · R+18
- County
- — inherits STATE
- City
- — inherits STATE
ZIP-level market 83705
- Rents YoY
- 7.4%
- Active inventory
- 135
- Price-to-rent
- 3.7×
Monthly cashflow live
- Estimated rent
- $1,482 high interval (Pro) →
- Mortgage (P&I)
- −$341
- Tax est. 1.5%
- −$81 /mo · $975/yr
- Insurance
- −$27
- HOA
- −$0
- Vacancy / Maint / Mgmt
- −$311
- Net cashflow
- $722
Break-even live
UW: 25.0% down · 7.5% · 30yr · 1.5% tax · 5.0% vac · 8.0% maint · 8.0% mgmt
Financing live
Cash to close
- Down payment
- $16,248
- Closing costs
- $1,950
- Reserves months
- —
- Total cash needed
- —
Loan-product check · same deal, 3 products live
Conventional
25% down · 7.5% · 30yr
- Down + closing
- —
- Monthly P&I
- —
- Monthly cashflow
- —
- DSCR
- —
- Eligible?
- —
Personal DTI + credit; lowest rate.
DSCR
20% down · 8.5% · 30yr
- Down + closing
- —
- Monthly P&I
- —
- Monthly cashflow
- —
- DSCR
- —
- Eligible?
- —
No personal income docs; deal must DSCR.
Hard money
10% down · 12.0% · 12mo
- Down + closing
- —
- Monthly P&I
- —
- Monthly cashflow
- —
- DSCR
- —
- Eligible?
- —
Short-term bridge; refi at stabilization.
Rent comps 12 comps
| Address | Beds | Baths | Sqft | Rent | $/sqft | DOM | Units | Dist |
|---|---|---|---|---|---|---|---|---|
| 2175 S Curtis Rd Unit 2175 Boise, ID | 2.0 | 1.0 | 842 | $1,695 | $2.01 | 3d | 1 | 0.34mi |
| 5140 W Kootenai St Unit 10 Boise, ID | 1.0 | 1.0 | 560 | $1,045 | $1.87 | 23d | 1 | 0.90mi |
| 4213 W Clark St Boise, ID | 2.0 | 1.0 | 754 | $1,750 | $2.32 | 23d | 1 | 0.99mi |
| 4980 W Camas St Boise, ID | 1.0 | 1.0 | 576 | $1,095 | $1.90 | 23d | 1 | 1.03mi |
| 6733 W Overland Rd Unit 102 Overland Boise, ID | 2.0 | 2.0 | 900 | $1,495 | $1.66 | 11d | 1 | 1.04mi |
| 5938 W Camas Ln Boise, ID | 2.0 | 1.0 | 768 | $1,210 | $1.58 | 2d | 1 | 1.05mi |
| 952 S Curtis Rd Boise, ID | 2.0 | 1.5 | 912 | $1,650 | $1.81 | 3d | 1 | 1.05mi |
| 4840 Blaser Cir Boise, ID | 2.0 | 1.0 | 925 | $1,425 | $1.54 | 18d | 1 | 1.09mi |
| 811 S Phillippi St Unit 811 Boise, ID | 2.0 | 1.0 | 915 | $1,195 | $1.31 | 23d | 1 | 1.10mi |
| 223 S Phillippi St Boise, ID | 2.0 | 1.0 | 1050 | $1,375 | $1.31 | 23d | 1 | 1.46mi |
| 227 S Orchard St Boise, ID | 2.0 | 2.0 | 993 | $1,428 | $1.44 | 2d | 1 | 1.50mi |
| 5453 W Franklin Rd Boise, ID | 1.0 | 1.0 | 580 | $1,324 | $2.28 | 2d | 2 | 1.50mi |
Listing history 4 events
-
2026-06-18days on market $64,990 Active 3 DOM
-
2026-06-17days on market $64,990 Active 2 DOM
-
2026-06-15remarks 699-char remark
-
2026-06-15$64,990 Active 1 DOM
ⓘ Source: listings_history table (triggers on properties + properties_extension) + one-shot
backfill from property_details.listing_events for pre-trigger history.
Climate risk First Street
- Flood 1/10 Low FEMA zone X (unshaded) · 0% chance over 30 yrs
- Wildfire 1/10 Low
- Heat 4/10 Moderate 7 d/yr ≥96°F today · 18 d/yr by 30 yrs out
- Wind 1/10 Low
- Air quality 8/10 Severe 14 unhealthy d/yr today · 19 by 30 yrs out
Nearby sold comps map
Loading sold comps map…
Walkable amenities ~0.75 mi
Loading nearby amenities…
Taxation est. · year 1
- Rental income
- $17,786
- − Mortgage interest
- −$3,640
- − Property taxes
- −$975
- − Insurance
- −$325
- − Repairs & maintenance
- −$1,423
- − Management
- −$1,423
- − Depreciation
- −$1,891
- Taxable income
- $8,109
- Est. tax owed @ 24.0%
- −$1,946
- After-tax cash flow
- $6,715/yr
For passive investors: Depreciation is non-cash, so a rental often shows a tax loss while cash-flowing — sheltering income. Rental losses are passive: they offset passive income freely, and up to $25,000/yr can offset ordinary (W-2) income if you actively participate and your MAGI is under $100k (phasing out to $0 by $150k); unused losses carry forward. On sale, claimed depreciation is recaptured at up to 25%, and gains may owe capital-gains tax (a 1031 exchange can defer both). Figures are a year-1 estimate at your 24.0% rate — not tax advice; consult a CPA.
Schools (NCES district)
- District
- Boise Independent District
- NCES district ID
- 1600360
- Math proficiency
- 42% ▼ -5.00%
- Reading proficiency
- 56% ▼ -1.00%
- Median HH income
- $49,135
- Composite
- 41.82/100
- National rank
- #3388
- State rank
- #36 of 92 in ID
Livability — Boise City
No livability data for this city. (Only ~50 U.S. cities are tracked.)
Census & demographics
- Census place
- Boise City, ID
- County
- Ada County · 522,161 people
- City population
- 152,689
- Metro
- Boise City, ID
- Population (ZIP)
- 26,830
- Household income
- $64,731
- Rent vs Own
- Severe rent burden
- 1509.0
Population outlook (Ada County) Hauer SSP2
- Today (2025)
- 535,818 people
- By 2030
- 585,751 · +9.3%
- By 2040
- 682,435 · +27.4%
- By 2050
- 775,818 · +44.8%
- By 2075
- 994,458 · +85.6%
- By 2100
- 1,148,884 · +114.4%
Race, ethnicity, and origin ACS 2023
- Neighborhood character
- Predominantly White (76%)
- Race & ethnicity
- White 76% Hispanic / Latino 13% Two or more races 8% Asian 3% Black 3% Native American 1%
- Hispanic origin (detail)
- Mexican 10%
- Common ancestry
- Slovak 4% Italian 3% Lithuanian 3%
- Foreign-born
- 9% · Canada, China
- Languages at home
- 87% English-only · Spanish 7% Arabic 1% Other Asian/Pacific 1%
Political lean MEDSL · Ada
- 2024 margin
- R (+10.3) · D 43.4% · R 53.8% · Other 2.8%
- 2008→2024 swing
- -4.2pp toward R · 2008: -6.2pp · 2024: -10.3pp
- All cycles
- 2024: R+10.3 2020: R+3.9 2016: R+9.2 2012: R+11.3 2008: R+6.2
Not yet ingested
- Civics
- —
Market trends
- HPI YoY
- ▼ -396.60%
- Current HPI
- 430.0629
- Rent YoY
- ▲ 7.38%
- Metro
- Boise City, ID
- State GDP YoY
- ▲ 4.51%
- F500 in state
- 6
Industry mix (Fortune 500 HQ in ID)
| Industry | F500 HQs | Revenue |
|---|---|---|
| Retail | 1 | $79B |
|
||
| Technology | 1 | $25B |
|
||
| Food / Agriculture | 1 | $6B |
|
||
Price history
-0.0% since first listed8 events — show timeline
- 2026-06-15 Listed $64,990 IMLS
- 2022-10-01 Listing Removed — IMLS
- 2022-09-22 Listed $90,000 IMLS
- 2021-09-21 Sold (MLS) — IMLS
- 2021-08-29 Pending — IMLS
- 2021-08-26 Relisted — IMLS
- 2021-08-08 Pending — IMLS
- 2021-07-23 Listed $65,000 IMLS
Cash-flow waterfall
monthlySold comps — $/sqft
last 12 mo · ≤1 miLoading sold comps…