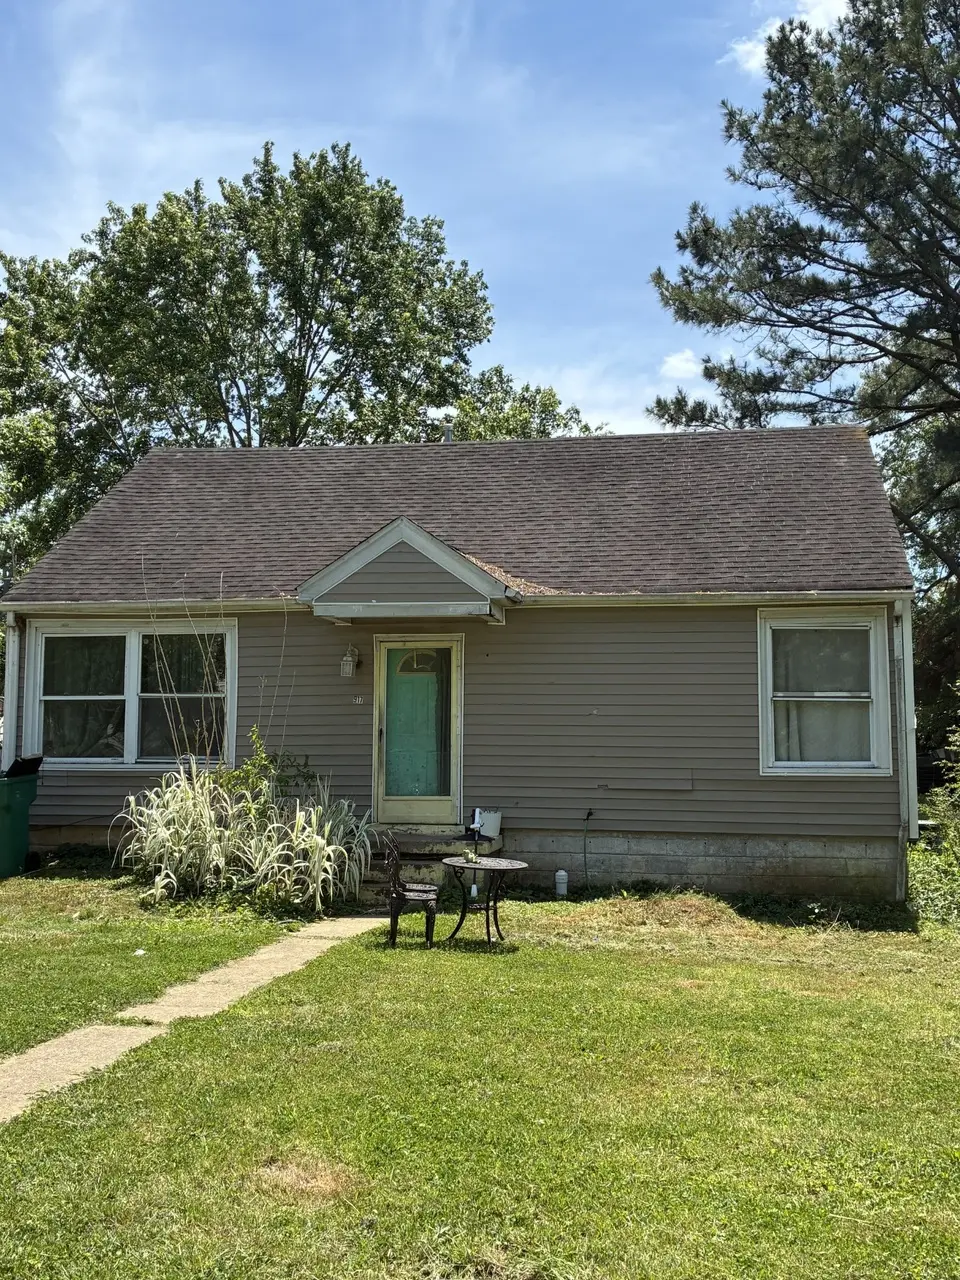
917 Maple St · Lewisburg, TN
Flood risk 1/10 · Minimal
- FEMA flood zone
- X (unshaded)
- Chance of flooding over 30 yrs
- 0.0%
- Est. flood insurance / yr
- $507 – $1,088
Fire risk 4/10 · Minor
- Est. fire insurance / yr
- $949 – $1,763
Heat risk 5/10 · Moderate
- Hot days now (above 105°F)
- 7 days/yr
- Hot days in 30 yrs
- 20 days/yr
Wind risk 4/10 · Minor
- Chance of severe wind over 30 yrs
- 14.0%
Air-quality risk 1/10 · Minimal
- Unhealthy air days now
- 0 days/yr
- Unhealthy air days in 30 yrs
- 0 days/yr
Risk factors via First Street. Map © Google.
Why this score? — see what drove the D+ grade
The composite is a weighted blend of 9 inputs, each scored 0–100. Each bar is that input's sub-score; the figure is the points it added to the 100-point composite (weight × sub-score).
- Cash flow +15.2/30.0
- ARV discount +15.0/15.0
- DSCR +4.7/10.0
- 1% rule +3.1/10.0
- Livability +3.0/5.0
- Schools +2.6/10.0
- Rent growth +2.5/5.0
- Condition / age +2.5/5.0
- Appreciation +0.0/10.0
$125,000
🖨 Deal sheet 📄 Offer letter ✓ Due diligence
Listing remarks
MOTIVATED SELLER!! Investor Special with Endless Potential! Bring your vision and tools—this property is ready for a complete transformation. Situated on a generous lot in an established neighborhood, this home offers a rare opportunity for investors, flippers, or buyers looking to create their dream space from the ground up. The house features a solid footprint with 2 bedrooms and a flexible layout, but it will require significant repairs and updates throughout. Expect to address major systems, cosmetic improvements, and possible structural work. This is not a move-in-ready property, but rather a blank canvas for those with the skills and imagination to unlock its full value. Highli
Key facts
- Spacious yard
- Generous lot
- Flexible layout
Tags
Property features AI
Finance
- Financial info: Annual tax amount noted
Exterior
- Utilities: Public water; Public sewer; Water available
- Home design: Single-family residence; One story
- Construction: Vinyl siding; Existing construction
- Exterior features: Approximately 0.27-acre lot; Lot dimensions about 75 x 160 (irregular)
Interior
- Kitchen: Electric oven; Cooktop
- Bedrooms: 2 bedrooms (both on the main level)
- Flooring: Laminate flooring
- Bathrooms: 1 full bathroom
- Heating & cooling: Central heating; Central air conditioning
- Interior features: Electric oven and cooktop; Laminate flooring; Crawl space basement
Neighborhood map
What this means for you Summary
Snapshot
- This is a 2-bed/1.0-bath single-family listed at $125k.
Deal economics
- At list price, monthly cash flow is $43 ($519/yr) — positive.
- The deal already cash-flows at list — no discount required.
- To meet the 1% rule (rent ≥ 1% of price), the offer needs to be $101k (18.8% below list).
- Recommended offer: $101k (18.8% below list) — sets the bar for 1% rule.
- Cap rate 6.7% vs local median 3.6% in Lewisburg — top-decile yield for the area; either an underpriced asset or a hidden risk that comps aren't pricing in. Stress-test before assuming the spread holds.
Location & tenants
- Location reads 59/100 on livability (#284 in TN) — a working-class tenant base; expect higher turnover. Strengths: cost of living A+, housing A+, health & safety A+; Watch: crime F, amenities F, commute F.
- Marshall County (rural): math 31% / reading 29% proficiency, ranked #58 of 139 in TN (top 42%) — families likely to look elsewhere, expect single-tenant / working-renter base with shorter leases.
- Zoned schools: Marshall Elementary (math 27% / reading 27%, grade F, #496 of 952 statewide, top 55%, 388 students, 0% FRL); Marshall Co High School (math 17% / reading 35%, grade F, #117 of 332 statewide, top 37%, 815 students, 0% FRL) — zoned schools average 0% FRL vs 48% district-wide (48 pts lower); this property's tenant base skews higher-income than the district average.
- Market conditions: 274 active listings in the ZIP; 13 comparable units currently listed for rent nearby; rentals at typical pace (median 24d on market — plan ~3-4 weeks tenant-placement turnaround); 46% of comp listings sitting > 30 days — soft ceiling on asking rent; 400 units permitted in Marshall County in 2024 (75 in 5+ unit buildings).
Forward outlook
- Local home prices are declining (-3.0%/yr); year-one equity from $864 of loan paydown is wiped out by about $4k of value loss. Plan a longer hold.
- Marshall County population projected at +5% by 2050 — modest demand growth; plan on rents tracking national, not racing it.
Negotiation context
- It's been on market 45 days — a 3% lower offer ($121k) is reasonable based on typical stale-listing flexibility.
- Current owner paid $42k; list at $125k implies a 194% gain — meaningful room to come down on a strong offer.
Risks & watch-outs
- Watch-outs: built in 1946 — expect roof / HVAC / electrical / plumbing capex.
- Climate carrying-cost: extreme-heat days projected 7→20/yr by 2055 (HVAC capex compounding) — expect insurance premiums to compound above CPI over the hold.
Questions for the listing agent
- It's been on market 45 days. Have you received any prior offers? Is the seller open to a 19% concession, seller financing, or rate buy-down credit?
- Built in 1946 — when were the roof, HVAC, electrical panel, plumbing, and water heater last replaced?
- Is there a deadline driving the sale (1031 exchange, divorce, estate, relocation)? That informs how much negotiation room exists.
- Schools are F-rated, which usually means shorter tenancies and higher turnover. Who's the typical renter profile here, and what's been the actual vacancy rate?
- Crime grade is F in this area — have there been break-ins, vandalism, or insurance claims at this property in the last 3 years? What carrier currently insures it and at what premium?
- The area grade is low — what's the realistic commute time and amenity access for the typical tenant pool here? Any planned neighborhood developments (good or bad) we should know about?
- What's the average days-on-market for RENTAL listings here right now (not sales)? A rising rental-DOM trend means longer vacancies and softer asking-rent achievability than the comps imply.
- What's the recent tenant-quality profile in this submarket — average credit score on applications, eviction rate, late-payment / NSF rate, and stable-employment percentage? A property-management company in the area should have these aggregated.
- How much new for-sale + rental construction is in the pipeline within 1–3 miles? Heavy new supply typically softens prices + rents 12–24 months out; constrained supply supports both.
Investment metrics
- 1% rule
- 0.81% ✗
- Cap rate
- 6.71%
- Cash-on-cash
- 1.48%
- DSCR
- 1.07
- GRM
- 10.3
CMA / ARV
- ARV (median comp)
- $204,442
- List price
- $125,000
- Delta
- -38.86%
- Verdict
- UNDERPRICED
- Comps
- 20 within 1.0 mi
Show comp detail 11 sales within ~0.75 mi
| Address | Dist | Beds/Ba | Sqft | Sold | Price | $/sf | Match |
|---|---|---|---|---|---|---|---|
| 303 W Berkley Cir | 0.06mi | 2/1.0 | 891 (0%) | 19mo | $240,000 | $269 | 82 |
| 904 Maple St | 0.03mi | 2/1.0 | 922 (+4%) | 20mo | $195,000 | $211 | 76 |
| 524 S Berkley Cir | 0.11mi | 2/1.0 | 983 (+10%) | 11mo | $230,000 | $234 | 69 |
| 108 7th Ave S | 0.31mi | 2/1.0 | 840 (-6%) | 11mo | $56,500 | $67 | 67 |
| 203 6th Ave S | 0.39mi | 2/1.0 | 901 (+1%) | 17mo | $179,900 | $200 | 66 |
| 309 Woods Ave N | 0.47mi | 2/1.0 | 945 (+6%) | 4mo | $217,000 | $230 | 65 |
| 305 8th Ave S | 0.14mi | 3/1.0 (+1) | 1,012 (+14%) | 1mo | $205,009 | $203 | 65 |
| 321 E Berkley Cir | 0.06mi | 2/1.0 | 1,016 (+14%) | 23mo | $210,000 | $207 | 54 |
| 1012 Silver Creek Rd | 0.48mi | 3/1.0 (+1) | 840 (-6%) | 18mo | $165,900 | $198 | 48 |
| 108 W End Ave N | 0.45mi | 3/2.0 (+1) | 1,021 (+15%) | 7mo | $132,500 | $130 | 40 |
| 415 4th Ave N | 0.71mi | 3/1.5 (+1) | 1,016 (+14%) | 20mo | $219,900 | $216 | 20 |
Match score weights: distance 35% · size 25% · config 20% · recency 20%. Top-matched comps best support the ARV.
Projected returns pro-forma
-3.0% appreciation · 3.0% rent growth · sell at horizon
- IRR
- -14.0%
- Equity multiple
- 0.50×
- Total profit
- $-17,551
- Equity at exit
- $18,638
- IRR
- -5.2%
- Equity multiple
- 0.66×
- Total profit
- $-11,938
- Equity at exit
- $10,808
Cash invested: $35,000 (down + closing). Projections, not guarantees.
Landlord ↔ Tenant lean methodology
- Overall (STATE)
- 87 Strongly Landlord-Friendly
- State Tennessee
- 87 Strongly Landlord-Friendly · R+13
- County
- — inherits STATE
- City
- — inherits STATE
ZIP-level market 37091
- Home prices YoY
- -14.6%
- Active inventory
- 274
- Price-to-rent
- 10.3×
Monthly cashflow live
- Estimated rent
- $1,015 high interval (Pro) →
- Mortgage (P&I)
- −$656
- Tax from tax record
- −$51 /mo · $609/yr
- Insurance
- −$52
- HOA
- −$0
- Vacancy / Maint / Mgmt
- −$213
- Net cashflow
- $43
Break-even live
UW: 25.0% down · 7.5% · 30yr · 1.5% tax · 5.0% vac · 8.0% maint · 8.0% mgmt
Financing live
Cash to close
- Down payment
- $31,250
- Closing costs
- $3,750
- Reserves months
- —
- Total cash needed
- —
Loan-product check · same deal, 3 products live
Conventional
25% down · 7.5% · 30yr
- Down + closing
- —
- Monthly P&I
- —
- Monthly cashflow
- —
- DSCR
- —
- Eligible?
- —
Personal DTI + credit; lowest rate.
DSCR
20% down · 8.5% · 30yr
- Down + closing
- —
- Monthly P&I
- —
- Monthly cashflow
- —
- DSCR
- —
- Eligible?
- —
No personal income docs; deal must DSCR.
Hard money
10% down · 12.0% · 12mo
- Down + closing
- —
- Monthly P&I
- —
- Monthly cashflow
- —
- DSCR
- —
- Eligible?
- —
Short-term bridge; refi at stabilization.
Rent comps 13 comps
| Address | Beds | Baths | Sqft | Rent | $/sqft | DOM | Units | Dist |
|---|---|---|---|---|---|---|---|---|
| 527 Maple St Lewisburg, TN | 1.0 | 1.0 | 615 | $800 | $1.30 | 43d | 1 | 0.35mi |
| 115 Joyce Ave Unit 20 Lewisburg, TN | 2.0 | 1.0 | 850 | $975 | $1.15 | 44d | 1 | 0.42mi |
| 115 Joyce Ave Apt 22 Lewisburg, TN | 1.0 | 1.0 | 729 | $875 | $1.20 | 2d | 1 | 0.42mi |
| 115 Joyce Ave Apt 21 Lewisburg, TN | 2.0 | 1.0 | 850 | $975 | $1.15 | 23d | 1 | 0.42mi |
| 115 Joyce Ave Apt 23 Lewisburg, TN | 1.0 | 1.0 | 729 | $875 | $1.20 | 7d | 1 | 0.42mi |
| 423 4th Ave N Lewisburg, TN | 2.0 | 1.0 | 1086 | $790 | $0.73 | 23d | 1 | 0.68mi |
| 314 Preston Ave Lewisburg, TN | 1.0–2.0 | 1.0 | 610 | $1,075 | $1.76 | 1d | 2 | 0.69mi |
| 566 1st Ave N Lewisburg, TN | 2.0 | 1.0 | 950 | $2,250 | $2.37 | 43d | 1 | 0.95mi |
| 664 4th Ave N Unit C Lewisburg, TN | 1.0 | 1.0 | 750 | $850 | $1.13 | 23d | 1 | 0.97mi |
| 328 E Church St Lewisburg, TN | 2.0 | 2.0 | 1000 | $4,000 | $4.00 | 43d | 1 | 0.99mi |
| 708 Woodlawn Ave Lewisburg, TN | 2.0 | 1.0 | 837 | $899 | $1.07 | 16d | 1 | 1.05mi |
| 1860 Lowe St Apt A Lewisburg, TN | 2.0 | 1.5 | 1094 | $1,200 | $1.10 | 43d | 1 | 1.19mi |
| 944 Sumerset Cir Lewisburg, TN | 3.0 | 2.0 | 1025 | $1,450 | $1.41 | 43d | 1 | 1.43mi |
Listing history 15 events
-
2026-06-18days on market $125,000 Active 45 DOM
-
2026-06-17days on market $125,000 Active 44 DOM
-
2026-06-16days on market $125,000 Active 43 DOM
-
2026-06-15days on market $125,000 Active 42 DOM
-
2026-06-13pricedays on market $125,000 Active 40 DOM
-
2026-06-09days on market $140,000 Active 36 DOM
-
2026-06-08days on market $140,000 Active 35 DOM
-
2026-06-07days on market $140,000 Active 34 DOM
-
2026-06-03days on market $140,000 Active 30 DOM
-
2026-06-02pricedays on market $140,000 Active 29 DOM
-
2026-06-01days on market $150,000 Active 28 DOM
-
2026-05-31days on market $150,000 Active 27 DOM
-
2026-05-13price $150,000 1038-char remark
-
2026-05-04$175,000 Active 1038-char remark
-
2016-07-06soldstatus $42,500
ⓘ Source: listings_history table (triggers on properties + properties_extension) + one-shot
backfill from property_details.listing_events for pre-trigger history.
Tax reassessment forecast TN · Resets to sale price
- Current annual tax
- $609 · $51/mo
- Projected year-2 tax
- $888 · $74/mo
- Expected delta
- +$278/yr (+$23/mo · 45.7%)
ⓘ Screening estimate from a state-policy table — verify with the county assessor before closing.
Climate risk First Street
- Flood 1/10 Low FEMA zone X (unshaded) · 0% chance over 30 yrs
- Wildfire 4/10 Moderate
- Heat 5/10 Major 7 d/yr ≥105°F today · 20 d/yr by 30 yrs out
- Wind 4/10 Moderate 14% chance of damaging wind over 30 yrs
- Air quality 1/10 Low 0 unhealthy d/yr today · 0 by 30 yrs out
Nearby sold comps map
Loading sold comps map…
Walkable amenities ~0.75 mi
Loading nearby amenities…
Taxation est. · year 1
- Rental income
- $12,176
- − Mortgage interest
- −$7,002
- − Property taxes
- −$609
- − Insurance
- −$625
- − Repairs & maintenance
- −$974
- − Management
- −$974
- − Depreciation
- −$3,636
- Taxable loss
- −$1,644
- Est. tax savings @ 24.0%
- +$395
- After-tax cash flow
- $914/yr
For passive investors: Depreciation is non-cash, so a rental often shows a tax loss while cash-flowing — sheltering income. Rental losses are passive: they offset passive income freely, and up to $25,000/yr can offset ordinary (W-2) income if you actively participate and your MAGI is under $100k (phasing out to $0 by $150k); unused losses carry forward. On sale, claimed depreciation is recaptured at up to 25%, and gains may owe capital-gains tax (a 1031 exchange can defer both). Figures are a year-1 estimate at your 24.0% rate — not tax advice; consult a CPA.
Schools (NCES district)
- District
- Marshall County
- NCES district ID
- 4702670
- Math proficiency
- 31% ▼ -9.00%
- Reading proficiency
- 29% ▼ -5.00%
- Median HH income
- $43,058
- Composite
- 25.56/100
- National rank
- #7426
- State rank
- #58 of 139 in TN
Livability — Lewisburg
- Score
- 59/100
- State rank
- #284
- US rank
- #20031
Category grades
Schools grade is shown separately in the Schools card above.
Census & demographics
- Census place
- Lewisburg, TN
- Population (ZIP)
- 23,991
Population outlook (Marshall County) Hauer SSP2
- Today (2025)
- 33,222 people
- By 2030
- 33,867 · +1.9%
- By 2040
- 34,743 · +4.6%
- By 2050
- 34,954 · +5.2%
- By 2075
- 34,652 · +4.3%
- By 2100
- 31,862 · -4.1%
Race, ethnicity, and origin ACS 2023
- Neighborhood character
- Predominantly White (82%)
- Race & ethnicity
- White 82% Hispanic / Latino 8% Black 5% Two or more races 4%
- Hispanic origin (detail)
- Mexican 7%
- Common ancestry
- Serbian 4% Slovak 2% Romanian 1%
- Foreign-born
- 3% · Canada, Jamaica, Vietnam
- Languages at home
- 92% English-only · Spanish 7%
Political lean MEDSL · Marshall
- 2024 margin
- Solid R (+56.6) · D 21.2% · R 77.8%
- 2008→2024 swing
- -17.0pp toward R · 2008: -39.6pp · 2024: -56.6pp
- All cycles
- 2024: R+56.6 2020: R+50.0 2016: R+46.6 2012: R+28.9 2008: R+39.6
Not yet ingested
- Civics
- —
Market trends
- HPI YoY
- ▼ -59.86%
- Current HPI
- 350.5306
- Rent YoY
- —
- Metro
- —
- State GDP YoY
- ▲ 2.78%
- F500 in state
- 22
Industry mix (Fortune 500 HQ in TN)
| Industry | F500 HQs | Revenue |
|---|---|---|
| Healthcare | 3 | $91B |
|
||
| Retail | 3 | $72B |
|
||
| Transportation / Logistics | 1 | $88B |
|
||
| Paper / Packaging | 1 | $19B |
|
||
| Insurance | 1 | $13B |
|
||
| Energy | 1 | $12B |
|
||
Price history
+194.1% since first listed5 events — show timeline
- 2026-06-12 Price Changed $125,000 REALTRACS as Distributed by MLS Grid
- 2026-06-02 Price Changed $140,000 REALTRACS as Distributed by MLS Grid
- 2026-05-13 Price Changed $150,000 REALTRACS as Distributed by MLS Grid
- 2026-05-04 Listed $175,000 REALTRACS as Distributed by MLS Grid
- 2016-07-06 Sold (Public Records) $42,500 Public Records
Property tax history
+2.1%/yrLatest (2025): $609 · +7.8% YoY. Source: county tax records.
Cash-flow waterfall
monthlySold comps — $/sqft
last 12 mo · ≤1 miLoading sold comps…