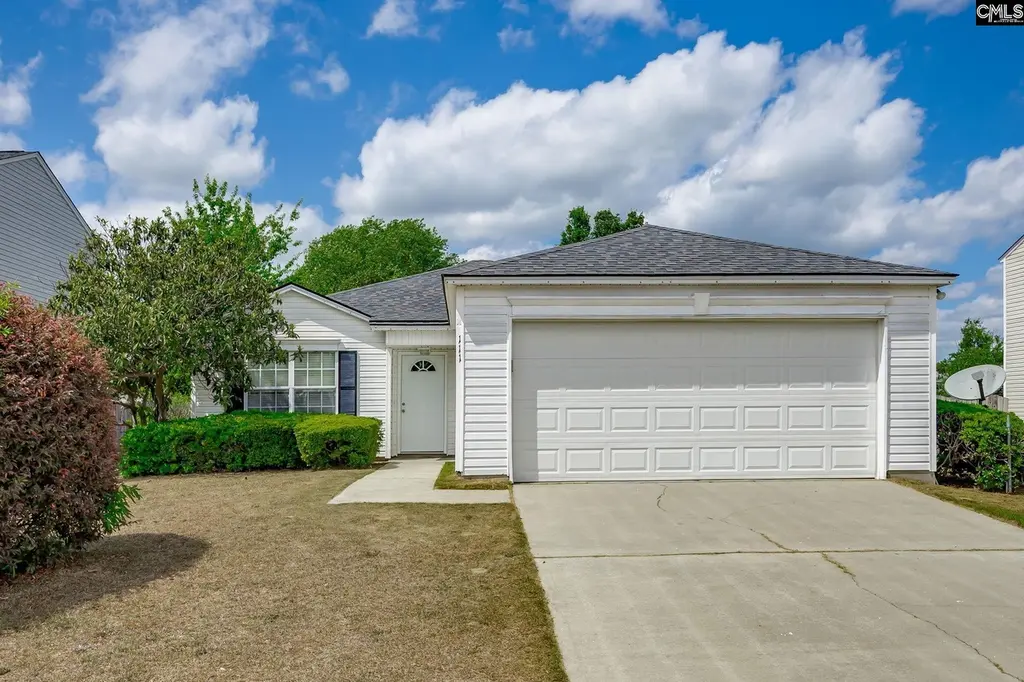
111 Malisa Dr · Columbia, SC
Flood risk 1/10 · Minimal
- FEMA flood zone
- X
- Chance of flooding over 30 yrs
- 0.0%
- Est. flood insurance / yr
- $435 – $905
Fire risk 2/10 · Minimal
- Est. fire insurance / yr
- $783 – $1,453
Heat risk 7/10 · Major
- Hot days now (above threshold)
- 7 days/yr
- Hot days in 30 yrs
- 16 days/yr
Wind risk No data
- Chance of severe wind over 30 yrs
- —
Air-quality risk No data
- Unhealthy air days now
- —
- Unhealthy air days in 30 yrs
- —
Risk factors via First Street. Map © Google.
Why this score? — see what drove the D+ grade
The composite is a weighted blend of 9 inputs, each scored 0–100. Each bar is that input's sub-score; the figure is the points it added to the 100-point composite (weight × sub-score).
- ARV discount +13.1/15.0
- Cash flow +12.6/30.0
- Livability +3.9/5.0
- DSCR +3.8/10.0
- 1% rule +3.7/10.0
- Schools +3.6/10.0
- Rent growth +3.2/5.0
- Condition / age +2.5/5.0
- Appreciation +0.0/10.0
$225,000
🖨 Deal sheet (PDF) 📄 Offer letter ✓ Due diligence
Listing remarks
Well Maintained Single Story Home w/ 3 Bedrooms, 2 Full Baths, 2 Car Garage, Fenced Backyard, & a Community Pool 2 Blocks From Listing. Since the Current Owners Purchased the Home Dec. 2013 for Rental Purposes, they have Replaced: the 3 Tab Shingles with Architectural Shingle in Approx. 2015; Hot Water Heater Approx. 2023; Heating & Air Units Approx. 2014; Kitchen Appliance w/ Stainless Steel Appliances 2026; Hall Bathroom's Vanity & Vinyl Floor w/ Tile Floor 2026; Installed Wide Plank Cherry Finished Engineered Hardwood Floors Approx. 2018; & Repainted the Interior 2-3 times as well as the Garage. This Home is Conveniently Located 10 Minutes from North Springs Elemen
Key facts
- Community pool
- Fenced backyard
- 6,098 sq ft lot
Tags
Property features AI
Finance
- Other: Community pool
- HOA & community: Community association with pool, playground, green areas and common area maintenance covered
Exterior
- Parking: Attached 2-car garage (main level) and garage opener
- Security: Owned security system; Smoke detector
- Utilities: Public water; Public sewer; Thermopane energy-efficient windows
- Home design: Single-story home; House faces south
- Construction: Vinyl exterior; Slab foundation
- Exterior features: Covered front porch; Patio; Automatic sprinkler system; Privacy wood fence in rear
Interior
- Kitchen: Bar; Eat-in kitchen; Wood cabinets (stained); Pantry; Formica countertops; Tile floor; Dishwasher; Free-standing smooth-surface range
- Bedrooms: Master bedroom with garden tub, private bath, walk-in closet, private closet, engineered hardwood and vinyl floors; Bedroom 2 with shared bath, tub/shower, private closet, engineered hardwood and tile floors; Bedroom 3 with shared bath, tub/shower, private closet, engineered hardwood and tile floors
- Flooring: Engineered hardwood; Vinyl; Tile
- Bathrooms: Two full bathrooms
- Heating & cooling: Central heating; Central air conditioning
- Interior features: Ceiling fan; Garage door opener; Owned security system; Smoke detector; Attic access
- Laundry & utility: Main-level laundry in heated mud room; Electric hookup
Neighborhood map
What this means for you Summary
Snapshot
- This is a 3-bed/2.0-bath single-family listed at $225k.
Deal economics
- At list price, monthly cash flow is $-27 ($-327/yr) — negative.
- To cash-flow at today's rent, offer at most $220k (2.1% below list).
- To meet the 1% rule (rent ≥ 1% of price), the offer needs to be $197k (12.5% below list).
- Recommended offer: $197k (12.5% below list) — sets the bar for 1% rule.
- Cap rate 6.1% vs local median 5.1% in Columbia — meaningfully above typical; check what's discounted (condition, days-on-market, listing class) to confirm the premium yield is real.
Location & tenants
- Location reads 78/100 on livability (#18 in SC, #2,436 nationally) — a middle-class / working-renter tenant base. Strengths: amenities A+, commute A+, cost of living A+; Watch: employment D, crime F.
- Richland 02 (suburban): math 35% / reading 47% proficiency, ranked #29 of 80 in SC (top 36%) — families likely to look elsewhere, expect single-tenant / working-renter base with shorter leases.
- Zoned schools: North Springs Elementary (math 37% / reading 37%, grade F, #315 of 597 statewide, top 55%, 703 students, 78% FRL); Ridge View High (math 43% / reading 76%, grade C+, #110 of 196 statewide, top 58%, 1,711 students, 60% FRL) — zoned schools average 69% FRL vs 38% district-wide (31 pts higher); higher-poverty schools than district average — tighter screening recommended.
- Market conditions: Rents rising (+2.8%/yr); 417 active listings in the ZIP; 13 comparable units currently listed for rent nearby; rentals leasing fast (median 13d on market — plan ~1-2 weeks tenant-placement turnaround); 3,472 units permitted in Richland County in 2024 (1,096 in 5+ unit buildings).
- This rent runs 32% of the median local income ($74k/yr) — at the standard rent-burdened threshold; future hikes will face affordability resistance.
Forward outlook
- Local home prices are declining (-3.0%/yr); year-one equity from $2k of loan paydown is wiped out by about $7k of value loss. Plan a longer hold.
- Richland County population projected at +30% by 2050 — long-run rental-demand tailwind backs the buy-and-hold thesis.
Negotiation context
- It's been on market 32 days — a 3% lower offer ($218k) is reasonable based on typical stale-listing flexibility.
- Current owner paid $116k; list at $225k implies a 94% gain — meaningful room to come down on a strong offer.
Risks & watch-outs
- Climate carrying-cost: extreme-heat days projected 7→16/yr by 2055 (HVAC capex compounding) — expect insurance premiums to compound above CPI over the hold.
Questions for the listing agent
- What do current leases actually rent for vs. the listed asking? Can we see a recent rent roll and the last 12 months of T-12 income?
- It's been on market 32 days. Have you received any prior offers? Is the seller open to a 13% concession, seller financing, or rate buy-down credit?
- What does the HOA fee cover, when was the last increase, and are there any pending special assessments or reserve-fund shortfalls?
- Is there a deadline driving the sale (1031 exchange, divorce, estate, relocation)? That informs how much negotiation room exists.
- Schools are D-rated, which usually means shorter tenancies and higher turnover. Who's the typical renter profile here, and what's been the actual vacancy rate?
- Crime grade is F in this area — have there been break-ins, vandalism, or insurance claims at this property in the last 3 years? What carrier currently insures it and at what premium?
- The area grade is low — what's the realistic commute time and amenity access for the typical tenant pool here? Any planned neighborhood developments (good or bad) we should know about?
- What's the average days-on-market for RENTAL listings here right now (not sales)? A rising rental-DOM trend means longer vacancies and softer asking-rent achievability than the comps imply.
- What's the recent tenant-quality profile in this submarket — average credit score on applications, eviction rate, late-payment / NSF rate, and stable-employment percentage? A property-management company in the area should have these aggregated.
- How much new for-sale + rental construction is in the pipeline within 1–3 miles? Heavy new supply typically softens prices + rents 12–24 months out; constrained supply supports both.
Investment metrics
- 1% rule
- 0.87% ✗
- Cap rate
- 6.15%
- Cash-on-cash
- -0.52%
- DSCR
- 0.98
- GRM
- 9.5
CMA / ARV
- ARV (on-the-fly)
- $257,044
- Comps found
- 2
Show comp detail 2 sales within ~0.75 mi
| Address | Dist | Beds/Ba | Sqft | Sold | Price | $/sf | Match |
|---|---|---|---|---|---|---|---|
| 250 Curvewood Rd | 0.36mi | 3/2.5 | 1,352 (-6%) | 8mo | $154,000 | $114 | 64 |
| 1007 May Oak Cir | 0.73mi | 3/2.0 | 1,342 (-6%) | 24mo | $240,000 | $179 | 35 |
Match score weights: distance 35% · size 25% · config 20% · recency 20%. Top-matched comps best support the ARV.
Projected returns pro-forma
-3.0% appreciation · 2.81% rent growth · sell at horizon
- IRR
- -17.3%
- Equity multiple
- 0.39×
- Total profit
- $-38,524
- Equity at exit
- $33,548
- IRR
- -9.7%
- Equity multiple
- 0.41×
- Total profit
- $-37,127
- Equity at exit
- $19,454
Cash invested: $63,000 (down + closing). Projections, not guarantees.
Landlord ↔ Tenant lean methodology
- Overall (STATE)
- 90 Strongly Landlord-Friendly
- State South Carolina
- 90 Strongly Landlord-Friendly · R+6
- County
- — inherits STATE
- City
- — inherits STATE
ZIP-level market 29229
- Home prices YoY
- -21.5%
- Rents YoY
- 2.8%
- Active inventory
- 417
- Price-to-rent
- 9.5×
Monthly cashflow live
- Estimated rent
- $1,968 high interval (Pro) →
- Mortgage (P&I)
- −$1,180
- Tax from tax record
- −$271 /mo · $3,252/yr
- Insurance
- −$94
- HOA
- −$37
- Vacancy / Maint / Mgmt
- −$413
- Net cashflow
- $-27
Break-even live
Sensitivity live
| Price | -10% $100 | -5% $36 | +0% $-27 | +5% $-91 | +10% $-155 |
|---|---|---|---|---|---|
| Rent | -10% $-183 | -5% $-105 | +0% $-27 | +5% $50 | +10% $128 |
| Rate | -1.0pp $86 | -0.5pp $30 | base $-27 | +0.5pp $-86 | +1.0pp $-145 |
UW: 25.0% down · 7.5% · 30yr · 1.5% tax · 5.0% vac · 8.0% maint · 8.0% mgmt
Financing live
Cash to close
- Down payment
- $56,250
- Closing costs
- $6,750
- Reserves months
- —
- Total cash needed
- —
Loan-product check · same deal, 3 products live
Conventional
25% down · 7.5% · 30yr
- Down + closing
- —
- Monthly P&I
- —
- Monthly cashflow
- —
- DSCR
- —
- Eligible?
- —
Personal DTI + credit; lowest rate.
DSCR
20% down · 8.5% · 30yr
- Down + closing
- —
- Monthly P&I
- —
- Monthly cashflow
- —
- DSCR
- —
- Eligible?
- —
No personal income docs; deal must DSCR.
Hard money
10% down · 12.0% · 12mo
- Down + closing
- —
- Monthly P&I
- —
- Monthly cashflow
- —
- DSCR
- —
- Eligible?
- —
Short-term bridge; refi at stabilization.
Rent comps 13 comps
| Address | Beds | Baths | Sqft | Rent | $/sqft | DOM | Units | Dist |
|---|---|---|---|---|---|---|---|---|
| 500 Castle Ridge Dr Columbia, SC | 3.0 | 2.0 | 1753 | $2,150 | $1.23 | 5d | 1 | 0.13mi |
| 1214 Waverly Place Ln Columbia, SC | 3.0 | 2.0 | 1152 | $1,800 | $1.56 | 13d | 1 | 0.63mi |
| 1116 Waverly Place Ln Columbia, SC | 3.0 | 2.0 | 1428 | $1,875 | $1.31 | 16d | 1 | 0.73mi |
| 423 Elders Pond Cir Columbia, SC | 2.0 | 2.0 | 1125 | $1,475 | $1.31 | 21d | 1 | 0.80mi |
| 5 Elders Pond Ct Columbia, SC | 3.0 | 2.5 | 1640 | $1,795 | $1.09 | 16d | 1 | 0.89mi |
| 214 Elders Pond Dr Columbia, SC | 3.0 | 2.5 | 1400 | $1,350 | $0.96 | 13d | 1 | 0.89mi |
| 3 Glen Knoll Ct Columbia, SC | 3.0 | 2.0 | 1320 | $1,699 | $1.29 | 13d | 1 | 0.93mi |
| 512 N Crossing Dr Columbia, SC | 3.0 | 2.0 | 1302 | $1,799 | $1.38 | 25d | 1 | 0.95mi |
| 3 Long Glen Ct Columbia, SC | 3.0 | 2.0 | 1314 | $1,849 | $1.41 | 4d | 1 | 0.98mi |
| 112 Turnstone Way Columbia, SC | 3.0 | 2.0 | 1145 | $1,779 | $1.55 | 4d | 1 | 0.99mi |
| 4500 Hard Scrabble Rd Columbia, SC | 1.0–3.0 | 1.0–2.0 | 1031 | $1,455 | $1.41 | 4d | 4 | 1.07mi |
| 440 Town Center Pl Columbia, SC | 1.0–2.0 | 1.0–2.0 | 1016 | $2,610 | $2.57 | 5d | 17 | 1.28mi |
| 108 Quinton Ln Columbia, SC | 3.0 | 2.0 | 1052 | $1,749 | $1.66 | 23d | 1 | 1.42mi |
HOA detail
- Monthly dues
- $37 · $444/yr
- Likely covers
- waterpool
Listing history 8 events
-
2026-06-03statusdays on market $225,000 Pending 32 DOM
-
2026-06-03days on market $225,000 Active - Contingent 31 DOM
-
2026-06-01days on market $225,000 Active - Contingent 30 DOM
-
2026-05-31days on market $225,000 Active - Contingent 29 DOM
-
2026-05-20historical Active - Contingent
-
2026-05-02$225,000 Active
-
2006-09-12soldstatus $115,900
-
1999-11-19soldstatus $90,985
ⓘ Source: listings_history table (triggers on properties + properties_extension) + one-shot
backfill from property_details.listing_events for pre-trigger history.
Tax reassessment forecast SC · Resets to sale price
- Current annual tax
- $3,252 · $271/mo
- Projected year-2 tax
- $3,252 · $271/mo
- Expected delta
- $0/yr ($0/mo · 0.0%)
ⓘ Screening estimate from a state-policy table — verify with the county assessor before closing.
Climate risk First Street
- Flood 1/10 Low FEMA zone X · 0% chance over 30 yrs
- Wildfire 2/10 Low
- Heat 7/10 Severe
Nearby sold comps map
Loading sold comps map…
Walkable amenities ~0.75 mi
Loading nearby amenities…
Taxation est. · year 1
- Rental income
- $23,612
- − Mortgage interest
- −$12,603
- − Property taxes
- −$3,252
- − Insurance
- −$1,125
- − Repairs & maintenance
- −$1,889
- − Management
- −$1,889
- − HOA
- −$444
- − Depreciation
- −$6,545
- Taxable loss
- −$4,136
- Est. tax savings @ 24.0%
- +$993
- After-tax cash flow
- $666/yr
For passive investors: Depreciation is non-cash, so a rental often shows a tax loss while cash-flowing — sheltering income. Rental losses are passive: they offset passive income freely, and up to $25,000/yr can offset ordinary (W-2) income if you actively participate and your MAGI is under $100k (phasing out to $0 by $150k); unused losses carry forward. On sale, claimed depreciation is recaptured at up to 25%, and gains may owe capital-gains tax (a 1031 exchange can defer both). Figures are a year-1 estimate at your 24.0% rate — not tax advice; consult a CPA.
Schools (NCES district)
- District
- Richland 02
- NCES district ID
- 4503390
- Math proficiency
- 35% ▼ -15.00%
- Reading proficiency
- 47% ▼ -5.00%
- Median HH income
- $59,684
- Composite
- 36.2/100
- National rank
- #4730
- State rank
- #29 of 80 in SC
Livability — Columbia
- Score
- 78/100
- State rank
- #18
- US rank
- #2436
Category grades
Schools grade is shown separately in the Schools card above.
Census & demographics
- County
- Richland County · 389,530 people
- City population
- 335,994
- Metro
- Columbia, SC
- Population (ZIP)
- 51,861
- Household income
- $74,043
- Rent vs Own
- Severe rent burden
- 1939.0
Population outlook (Richland County) Hauer SSP2
- Today (2025)
- 459,667 people
- By 2030
- 487,524 · +6.1%
- By 2040
- 542,035 · +17.9%
- By 2050
- 595,371 · +29.5%
- By 2075
- 732,998 · +59.5%
- By 2100
- 820,415 · +78.5%
Race, ethnicity, and origin ACS 2023
- Neighborhood character
- Diverse neighborhood (Simpson 0.56)
- Race & ethnicity
- Black 62% White 24% Hispanic / Latino 8% Two or more races 6% Asian 3%
- Hispanic origin (detail)
- Mexican 2% Puerto Rican 2%
- Common ancestry
- Slovak 1% Lithuanian 1% Romanian 1%
- Foreign-born
- 7% · Canada, South Korea, Jamaica
- Languages at home
- 89% English-only · Spanish 6% Other Indo-European 1% Korean 1%
Political lean MEDSL · Richland
- 2024 margin
- Solid D (+34.6) · D 66.4% · R 31.8% · Other 1.8%
- 2008→2024 swing
- +5.7pp toward D · 2008: 28.9pp · 2024: 34.6pp
- All cycles
- 2024: D+34.6 2020: D+38.3 2016: D+32.9 2012: D+33.3 2008: D+28.9
Not yet ingested
- Civics
- —
Market trends
- HPI YoY
- ▼ -51.11%
- Current HPI
- 186.782
- Rent YoY
- ▲ 2.81%
- Metro
- Columbia, SC
- State GDP YoY
- ▲ 4.51%
- F500 in state
- 2
Industry mix (Fortune 500 HQ in SC)
| Industry | F500 HQs | Revenue |
|---|---|---|
| Packaging | 1 | $7B |
|
||
Price history
+147.3% since first listed4 events — show timeline
- 2026-05-20 Contingent — Consolidated MLS
- 2026-05-02 Listed $225,000 Consolidated MLS
- 2006-09-12 Sold (Public Records) $115,900 Public Records
- 1999-11-19 Sold (Public Records) $90,985 Public Records
Property tax history
-0.6%/yrLatest (2025): $3,252 · +2.7% YoY. Source: county tax records.
Cash-flow waterfall
monthlySold comps — $/sqft
last 12 mo · ≤1 miLoading sold comps…