 🏷️ Likely Rental
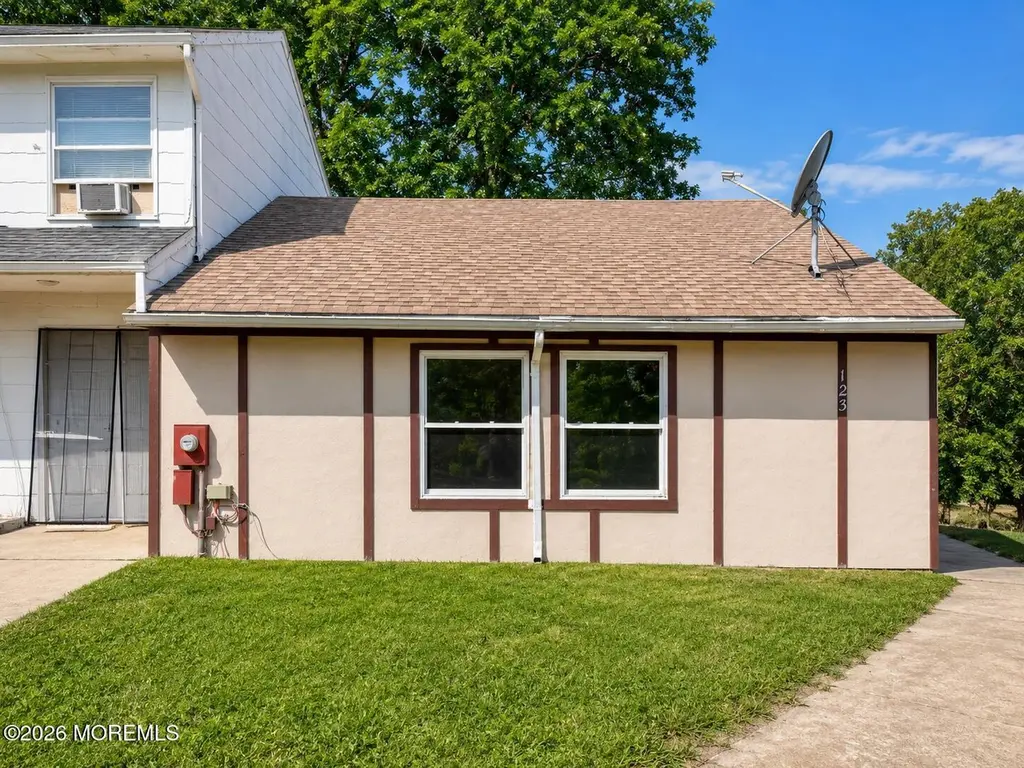
123 Lexington Blvd · Barnegat, NJ
Flood risk 1/10 · Minimal
- FEMA flood zone
- X (unshaded)
- Chance of flooding over 30 yrs
- 0.0%
- Est. flood insurance / yr
- $507 – $1,088
Fire risk 4/10 · Minor
- Est. fire insurance / yr
- $526 – $976
Heat risk 7/10 · Major
- Hot days now (above 98°F)
- 7 days/yr
- Hot days in 30 yrs
- 15 days/yr
Wind risk 8/10 · Major
- Chance of severe wind over 30 yrs
- 80.0%
Air-quality risk 3/10 · Minor
- Unhealthy air days now
- 2 days/yr
- Unhealthy air days in 30 yrs
- 3 days/yr
Risk factors via First Street. Map © Google.
Why this score? — see what drove the C+ grade
The composite is a weighted blend of 9 inputs, each scored 0–100. Each bar is that input's sub-score; the figure is the points it added to the 100-point composite (weight × sub-score).
- Cash flow +24.1/30.0
- ARV discount +15.0/15.0
- DSCR +7.8/10.0
- 1% rule +5.5/10.0
- Livability +3.4/5.0
- Schools +3.1/10.0
- Rent growth +2.5/5.0
- Condition / age +2.5/5.0
- Appreciation +0.0/10.0
$219,000
🖨 Deal sheet 📄 Offer letter ✓ Due diligence
Listing remarks MLS
Great opportunity for an investor. Owner was previously getting $1200 per month in rent. Easy to show
Key facts
- Refreshed bath
- Renovated
- Updated interior
Tags
Property features AI
Exterior
- Parking: No garage
- Utilities: Public sewer
- Home design: Fee simple ownership
- Exterior features: Shingle roof
Interior
- Bedrooms: 2 bedrooms
- Bathrooms: 1 full bathroom
- Heating & cooling: Electric heating; Cooling system (other type)
- Interior features: No fireplaces; Crawl space basement
Neighborhood map
What this means for you Summary
Snapshot
- This is a 2-bed/1.0-bath single-family listed at $219k.
Deal economics
- At list price, monthly cash flow is $434 ($5k/yr) — positive.
- The deal already cash-flows at list — no discount required.
- Meets the 1% rule at list price ($2k rent vs $219k).
- Cap rate 8.7% vs local median 3.6% in Barnegat — top-decile yield for the area; either an underpriced asset or a hidden risk that comps aren't pricing in. Stress-test before assuming the spread holds.
Location & tenants
- Location reads 68/100 on livability (#310 in NJ) — a middle-class / working-renter tenant base. Strengths: crime A+, employment A+, housing A; Watch: schools C-, amenities F, commute F.
- Barnegat Township School District (suburban): math 23% / reading 46% proficiency, ranked #285 of 472 in NJ (top 60%) — families likely to look elsewhere, expect single-tenant / working-renter base with shorter leases.
- Market conditions: 253 active listings in the ZIP; 1 comparable units currently listed for rent nearby; solid renter incomes; 4,434 units permitted in Ocean County in 2024 (868 in 5+ unit buildings).
Forward outlook
- Local home prices are declining (-3.0%/yr); year-one equity from $2k of loan paydown is wiped out by about $7k of value loss. Plan a longer hold.
- Ocean County population projected to shrink 8% by 2050 — rents likely to lag national; underwrite the cash flow, not the appreciation.
Negotiation context
- Only 7 days on market — expect competitive offers; lowballing is unlikely to land.
- 3 sale attempts since 18y ago; this cycle's ask is 213% above the opening price — seller raised mid-cycle; expect resistance to lowballs.
- Current owner paid $65k; list at $219k implies a 237% gain — meaningful room to come down on a strong offer.
Risks & watch-outs
- Climate carrying-cost: severe wind risk, 80% chance of damaging wind over 30y; extreme-heat days projected 7→15/yr by 2055 (HVAC capex compounding) — expect insurance premiums to compound above CPI over the hold.
Questions for the listing agent
- Built in 1979 — when were the roof, HVAC, electrical panel, plumbing, and water heater last replaced?
- Is there a deadline driving the sale (1031 exchange, divorce, estate, relocation)? That informs how much negotiation room exists.
- What's the average days-on-market for RENTAL listings here right now (not sales)? A rising rental-DOM trend means longer vacancies and softer asking-rent achievability than the comps imply.
- What's the recent tenant-quality profile in this submarket — average credit score on applications, eviction rate, late-payment / NSF rate, and stable-employment percentage? A property-management company in the area should have these aggregated.
- How much new for-sale + rental construction is in the pipeline within 1–3 miles? Heavy new supply typically softens prices + rents 12–24 months out; constrained supply supports both.
Investment metrics
- 1% rule
- 1.05% ✓
- Cap rate
- 8.67%
- Cash-on-cash
- 8.48%
- DSCR
- 1.38
- GRM
- 7.9
CMA / ARV
- ARV (on-the-fly)
- $295,200
- Comps found
- 5
Show comp detail 5 sales within ~0.75 mi
| Address | Dist | Beds/Ba | Sqft | Sold | Price | $/sf | Match |
|---|---|---|---|---|---|---|---|
| 88 Lexington Blvd | 0.08mi | 2/1.0 | 900 (0%) | 2mo | $217,500 | $242 | 95 |
| 24 Anchor Rd | 0.15mi | 3/1.0 (+1) | 936 (+4%) | 4mo | $290,000 | $310 | 78 |
| 6 Anchor Rd | 0.14mi | 3/1.0 (+1) | 975 (+8%) | 14mo | $365,000 | $374 | 63 |
| 142 Village Dr | 0.20mi | 3/1.0 (+1) | 975 (+8%) | 12mo | $345,000 | $354 | 61 |
| 35 Tiller Dr | 0.33mi | 3/1.0 (+1) | 975 (+8%) | 21mo | $320,000 | $328 | 48 |
Match score weights: distance 35% · size 25% · config 20% · recency 20%. Top-matched comps best support the ARV.
Projected returns pro-forma
-3.0% appreciation · 3.0% rent growth · sell at horizon
- IRR
- -3.4%
- Equity multiple
- 0.87×
- Total profit
- $-7,916
- Equity at exit
- $32,654
- IRR
- 6.2%
- Equity multiple
- 1.46×
- Total profit
- $28,496
- Equity at exit
- $18,935
Cash invested: $61,320 (down + closing). Projections, not guarantees.
Landlord ↔ Tenant lean methodology
- Overall (STATE)
- 21 Tenant-Leaning
- State New Jersey
- 21 Tenant-Leaning · D+6
- County
- — inherits STATE
- City
- — inherits STATE
ZIP-level market 08005
- Active inventory
- 253
- Price-to-rent
- 7.9×
Monthly cashflow live
- Estimated rent
- $2,309 medium interval (Pro) →
- Mortgage (P&I)
- −$1,148
- Tax from tax record
- −$151 /mo · $1,810/yr
- Insurance
- −$91
- HOA
- −$0
- Vacancy / Maint / Mgmt
- −$485
- Net cashflow
- $434
Break-even live
UW: 25.0% down · 7.5% · 30yr · 1.5% tax · 5.0% vac · 8.0% maint · 8.0% mgmt
Financing live
Cash to close
- Down payment
- $54,750
- Closing costs
- $6,570
- Reserves months
- —
- Total cash needed
- —
Loan-product check · same deal, 3 products live
Conventional
25% down · 7.5% · 30yr
- Down + closing
- —
- Monthly P&I
- —
- Monthly cashflow
- —
- DSCR
- —
- Eligible?
- —
Personal DTI + credit; lowest rate.
DSCR
20% down · 8.5% · 30yr
- Down + closing
- —
- Monthly P&I
- —
- Monthly cashflow
- —
- DSCR
- —
- Eligible?
- —
No personal income docs; deal must DSCR.
Hard money
10% down · 12.0% · 12mo
- Down + closing
- —
- Monthly P&I
- —
- Monthly cashflow
- —
- DSCR
- —
- Eligible?
- —
Short-term bridge; refi at stabilization.
Rent comps 1 comps
| Address | Beds | Baths | Sqft | Rent | $/sqft | DOM | Units | Dist |
|---|---|---|---|---|---|---|---|---|
| 21 Potomac Ct Barnegat, NJ | 2.0 | 1.0 | 900 | $2,100 | $2.33 | 5d | 1 | 0.03mi |
Listing history 8 events
-
2026-06-18days on market $219,000 Active 7 DOM
-
2026-06-17days on market $219,000 Active 6 DOM
-
2026-06-16days on market $219,000 Active 5 DOM
-
2026-06-15days on market $219,000 Active 4 DOM
-
2026-06-13days on market $219,000 Active 2 DOM
-
2026-06-13status $219,000 Active 1 DOM
-
2026-06-10remarks 699-char remark
-
2026-06-10$219,000 Coming Soon 1 DOM
ⓘ Source: listings_history table (triggers on properties + properties_extension) + one-shot
backfill from property_details.listing_events for pre-trigger history.
Tax reassessment forecast NJ · Partial reset (capped growth)
- Current annual tax
- $1,810 · $151/mo
- Projected year-2 tax
- $3,631 · $303/mo
- Expected delta
- +$1,822/yr (+$152/mo · 100.7%)
ⓘ Screening estimate from a state-policy table — verify with the county assessor before closing.
Climate risk First Street
- Flood 1/10 Low FEMA zone X (unshaded) · 0% chance over 30 yrs
- Wildfire 4/10 Moderate
- Heat 7/10 Severe 7 d/yr ≥98°F today · 15 d/yr by 30 yrs out
- Wind 8/10 Severe 80% chance of damaging wind over 30 yrs
- Air quality 3/10 Moderate 2 unhealthy d/yr today · 3 by 30 yrs out
Nearby sold comps map
Loading sold comps map…
Walkable amenities ~0.75 mi
Loading nearby amenities…
Taxation est. · year 1
- Rental income
- $27,707
- − Mortgage interest
- −$12,267
- − Property taxes
- −$1,810
- − Insurance
- −$1,095
- − Repairs & maintenance
- −$2,217
- − Management
- −$2,217
- − Depreciation
- −$6,371
- Taxable income
- $1,731
- Est. tax owed @ 24.0%
- −$415
- After-tax cash flow
- $4,787/yr
For passive investors: Depreciation is non-cash, so a rental often shows a tax loss while cash-flowing — sheltering income. Rental losses are passive: they offset passive income freely, and up to $25,000/yr can offset ordinary (W-2) income if you actively participate and your MAGI is under $100k (phasing out to $0 by $150k); unused losses carry forward. On sale, claimed depreciation is recaptured at up to 25%, and gains may owe capital-gains tax (a 1031 exchange can defer both). Figures are a year-1 estimate at your 24.0% rate — not tax advice; consult a CPA.
Schools (NCES district)
- District
- Barnegat Township School District
- NCES district ID
- 3416470
- Math proficiency
- 23% ▼ -14.00%
- Reading proficiency
- 46% ▼ -5.00%
- Median HH income
- $63,645
- Composite
- 31.15/100
- National rank
- #6059
- State rank
- #285 of 472 in NJ
Livability — Barnegat
- Score
- 68/100
- State rank
- #310
- US rank
- #9556
Category grades
Schools grade is shown separately in the Schools card above.
Census & demographics
- County
- Ocean County · 439,426 people
- City population
- 26,866
- Metro
- New York-Newark-Jersey City, NY-NJ-PA
- Population (ZIP)
- 26,866
- Household income
- $93,584
- Rent vs Own
- Severe rent burden
- 384.0
Population outlook (Ocean County) Hauer SSP2
- Today (2025)
- 586,991 people
- By 2030
- 581,403 · -1.0%
- By 2040
- 564,913 · -3.8%
- By 2050
- 538,149 · -8.3%
- By 2075
- 468,845 · -20.1%
- By 2100
- 350,297 · -40.3%
Race, ethnicity, and origin ACS 2023
- Neighborhood character
- Predominantly White (86%)
- Race & ethnicity
- White 86% Two or more races 7% Hispanic / Latino 6% Black 3% Asian 1%
- Hispanic origin (detail)
- Puerto Rican 3%
- Common ancestry
- Romanian 9% Scotch-Irish 2% Serbian 1%
- Foreign-born
- 5% · Canada, Vietnam, China
- Languages at home
- 94% English-only · Spanish 2% Other Indo-European 1% Arabic 1%
Political lean MEDSL · Ocean
- 2024 margin
- Solid R (+36.0) · D 31.4% · R 67.4% · Other 1.2%
- 2008→2024 swing
- -17.6pp toward R · 2008: -18.4pp · 2024: -36.0pp
- All cycles
- 2024: R+36.0 2020: R+28.7 2016: R+34.0 2012: R+17.7 2008: R+18.4
Not yet ingested
- Civics
- —
Market trends
- HPI YoY
- ▼ -204.01%
- Current HPI
- 344.3189
- Rent YoY
- —
- Metro
- New York-Newark-Jersey City, NY-NJ-PA
- State GDP YoY
- ▲ 2.05%
- F500 in state
- 34
Industry mix (Fortune 500 HQ in NJ)
| Industry | F500 HQs | Revenue |
|---|---|---|
| Consumer Goods | 3 | $31B |
|
||
| Pharmaceuticals | 2 | $153B |
|
||
| Technology | 2 | $21B |
|
||
| Insurance | 2 | $20B |
|
||
| Healthcare | 2 | $19B |
|
||
| Financial Services | 1 | $70B |
|
||
Price history
+231.8% since first listed12 events — show timeline
- 2026-06-09 Coming Soon $219,000 MOMLS
- 2020-07-13 Sold (Public Records) $65,000 Public Records
- 2020-07-07 Sold (MLS) $65,000 BRIGHT MLS
- 2020-07-07 Sold (MLS) $65,000 MOMLS
- 2020-06-13 Pending — BRIGHT MLS
- 2020-06-12 Pending — MOMLS
- 2020-06-01 Listed $69,900 BRIGHT MLS
- 2020-06-01 Listed $69,900 MOMLS
- 2008-12-04 Sold (MLS) $73,500 BRIGHT MLS
- 2008-07-11 Listed $77,740 BRIGHT MLS
- 2003-07-02 Sold (Public Records) $75,000 Public Records
- 1988-01-11 Sold (Public Records) $66,000 Public Records
Property tax history
-1.2%/yrLatest (2025): $1,810 · +3.6% YoY. Source: county tax records.
Cash-flow waterfall
monthlySold comps — $/sqft
last 12 mo · ≤1 miLoading sold comps…