973 Apache Trl · Fancy Gap, VA
Flood risk 1/10 · Minimal
- FEMA flood zone
- X (unshaded)
- Chance of flooding over 30 yrs
- 0.0%
- Est. flood insurance / yr
- $507 – $1,088
Fire risk 5/10 · Moderate
- Est. fire insurance / yr
- $666 – $1,236
Heat risk 1/10 · Minimal
- Hot days now (above 98°F)
- 6 days/yr
- Hot days in 30 yrs
- 14 days/yr
Wind risk 2/10 · Minimal
- Chance of severe wind over 30 yrs
- 1.0%
Air-quality risk 1/10 · Minimal
- Unhealthy air days now
- 0 days/yr
- Unhealthy air days in 30 yrs
- 0 days/yr
Risk factors via First Street. Map © Google.
Why this score? — see what drove the A- grade
The composite is a weighted blend of 9 inputs, each scored 0–100. Each bar is that input's sub-score; the figure is the points it added to the 100-point composite (weight × sub-score).
- Cash flow +30.0/30.0
- ARV discount +15.0/15.0
- 1% rule +10.0/10.0
- DSCR +10.0/10.0
- Appreciation +6.4/10.0
- Schools +5.4/10.0
- Livability +2.8/5.0
- Rent growth +2.5/5.0
- Condition / age +2.5/5.0
$103,000
🖨 Deal sheet 📄 Offer letter ✓ Due diligence
Listing remarks
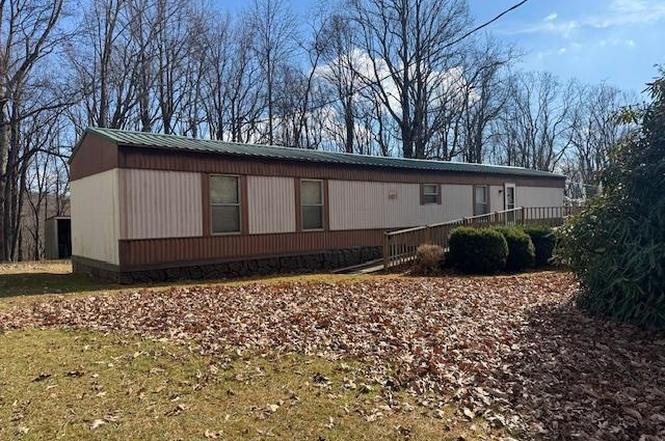
Great Investment! Singlewide in High Chapparral just off the Blue Ridge Parkway in Fancy Gap VA. 2 bedroom 2 bath. Nice decks on front and back to enjoy the mountain air and views. HOA included community water and road maintenance! Acreage is estmated. Buyer to determine internet options.
Key facts
- 0.35 acre lot
- Built 1972
- Listed 206 days
Property features AI
Finance
- Other:
- Financial info:
- HOA & community: Homeowners association with a $37.50 monthly fee
Exterior
- Parking:
- Security:
- Utilities: Public water; Septic tank
- Home design: Manufactured home; One story; Residential property in the High Chaparral subdivision; Zoned SFS
- Construction: Metal siding
- Exterior features: Deck
Interior
- Kitchen: Refrigerator
- Bedrooms:
- Flooring: Carpet; Vinyl
- Bathrooms: 2 full bathrooms
- Heating & cooling: Electric forced air heating; Central cooling with ceiling fan(s)
- Interior features: Ceiling fan(s)
- Laundry & utility: Washer; Dryer
Neighborhood map
What this means for you Summary
Snapshot
- This is a 2-bed/2.0-bath single-family listed at $103k.
Deal economics
- At list price, monthly cash flow is $490 ($6k/yr) — positive.
- The deal already cash-flows at list — no discount required.
- Meets the 1% rule at list price ($2k rent vs $103k).
- Recommended offer: $91k (12.0% below list) — sets the bar for market timing.
- Cap rate 12.0% vs local median 3.8% in Fancy Gap — top-decile yield for the area; either an underpriced asset or a hidden risk that comps aren't pricing in. Stress-test before assuming the spread holds.
Location & tenants
- Location reads 56/100 on livability (#515 in VA) — a working-class tenant base; expect higher turnover. Strengths: cost of living A+, crime A; Watch: amenities F, commute F, employment F.
- Carroll County Public School District (rural): math 60% / reading 70% proficiency, ranked #46 of 131 in VA (top 35%) — acceptable for families but not a draw, mixed tenant base, ~2y average lease.
- Zoned schools: Fancy Gap Elementary (math 92% / reading 87%, grade A+, #19 of 1,108 statewide, top 2%, 127 students, 85% FRL); Carroll County Middle (math 54% / reading 72%, grade B+, #134 of 342 statewide, top 40%, 756 students, 84% FRL); Carroll County High (math 64% / reading 67%, grade B, #204 of 319 statewide, top 65%, 1,069 students, 81% FRL) — zoned schools average 83% FRL vs 48% district-wide (35 pts higher); higher-poverty schools than district average — tighter screening recommended.
- Market conditions: 134 active listings in the ZIP; 80 units permitted in Carroll County in 2024 (0 in 5+ unit buildings).
Forward outlook
- In year one you build about $4k of equity ($712 loan paydown + $3k appreciation (2.9% local appreciation)).
- Carroll County population projected at -18% by 2050 — secular population decline; favor cash flow + early exit over multi-decade hold.
- At projected returns (2.9% appreciation + 3.0% rent growth), your $29k cash investment doubles in ~3 years — after that, you're playing with house money.
- By year 9, paydown + projected appreciation supports a ~$31k cash-out refi (75% LTV) — recoverable capital for the next deal without selling this one.
Negotiation context
- It's been on market 207 days — a 12% lower offer ($91k) is reasonable based on typical stale-listing flexibility.
- Current owner paid $31k; list at $103k implies a 231% gain — meaningful room to come down on a strong offer.
Risks & watch-outs
- Climate carrying-cost: moderate wildfire risk — expect insurance premiums to compound above CPI over the hold.
Questions for the listing agent
- It's been on market 207 days. Have you received any prior offers? Is the seller open to a 12% concession, seller financing, or rate buy-down credit?
- Built in 1972 — when were the roof, HVAC, electrical panel, plumbing, and water heater last replaced?
- What does the HOA fee cover, when was the last increase, and are there any pending special assessments or reserve-fund shortfalls?
- Why hasn't it sold? Are there any deal-killer items the seller is aware of (foundation, flood, title, zoning, code violations)?
- Is there a deadline driving the sale (1031 exchange, divorce, estate, relocation)? That informs how much negotiation room exists.
- Schools are A-rated — typically a magnet for longer-tenancy family renters. What's the average tenant stay here, and is there a school-zone premium baked into asking?
- What's the average days-on-market for RENTAL listings here right now (not sales)? A rising rental-DOM trend means longer vacancies and softer asking-rent achievability than the comps imply.
- What's the recent tenant-quality profile in this submarket — average credit score on applications, eviction rate, late-payment / NSF rate, and stable-employment percentage? A property-management company in the area should have these aggregated.
- How much new for-sale + rental construction is in the pipeline within 1–3 miles? Heavy new supply typically softens prices + rents 12–24 months out; constrained supply supports both.
Investment metrics
- 1% rule
- 1.52% ✓
- Cap rate
- 12.00%
- Cash-on-cash
- 20.37%
- DSCR
- 1.91
- GRM
- 5.5
CMA / ARV
- ARV (on-the-fly)
- $194,432
- Comps found
- 2
Show comp detail 2 sales within ~0.75 mi
| Address | Dist | Beds/Ba | Sqft | Sold | Price | $/sf | Match |
|---|---|---|---|---|---|---|---|
| 575 Apache Trl | 0.35mi | 2/1.0 | 882 (-2%) | 11mo | $180,000 | $204 | 68 |
| 632 Apache Trl | 0.31mi | 1/1.0 (-1) | 922 (+3%) | 18mo | $200,000 | $217 | 57 |
Match score weights: distance 35% · size 25% · config 20% · recency 20%. Top-matched comps best support the ARV.
Projected returns pro-forma
2.85% appreciation · 3.0% rent growth · sell at horizon
- IRR
- 26.4%
- Equity multiple
- 2.48×
- Total profit
- $42,810
- Equity at exit
- $45,438
- IRR
- 27.2%
- Equity multiple
- 4.81×
- Total profit
- $109,811
- Equity at exit
- $69,352
Cash invested: $28,840 (down + closing). Projections, not guarantees.
Landlord ↔ Tenant lean methodology
- Overall (STATE)
- 55 Moderately Landlord-Leaning
- State Virginia
- 55 Moderately Landlord-Leaning · D+2
- County
- — inherits STATE
- City
- — inherits STATE
ZIP-level market 24328
- Home prices YoY
- 1.7%
- Active inventory
- 134
- Price-to-rent
- 5.5×
Monthly cashflow live
- Estimated rent
- $1,568 medium interval (Pro) →
- Mortgage (P&I)
- −$540
- Tax est. 1.5%
- −$129 /mo · $1,545/yr
- Insurance
- −$43
- HOA
- −$37
- Vacancy / Maint / Mgmt
- −$329
- Net cashflow
- $490
Break-even live
UW: 25.0% down · 7.5% · 30yr · 1.5% tax · 5.0% vac · 8.0% maint · 8.0% mgmt
Financing live
Cash to close
- Down payment
- $25,750
- Closing costs
- $3,090
- Reserves months
- —
- Total cash needed
- —
Loan-product check · same deal, 3 products live
Conventional
25% down · 7.5% · 30yr
- Down + closing
- —
- Monthly P&I
- —
- Monthly cashflow
- —
- DSCR
- —
- Eligible?
- —
Personal DTI + credit; lowest rate.
DSCR
20% down · 8.5% · 30yr
- Down + closing
- —
- Monthly P&I
- —
- Monthly cashflow
- —
- DSCR
- —
- Eligible?
- —
No personal income docs; deal must DSCR.
Hard money
10% down · 12.0% · 12mo
- Down + closing
- —
- Monthly P&I
- —
- Monthly cashflow
- —
- DSCR
- —
- Eligible?
- —
Short-term bridge; refi at stabilization.
HOA detail
- Monthly dues
- $37 · $444/yr
- Likely covers
- waterinternet
Listing history 19 events
-
2026-06-19days on market $103,000 Active 207 DOM
-
2026-06-18days on market $103,000 Active 206 DOM
-
2026-06-17days on market $103,000 Active 205 DOM
-
2026-06-16days on market $103,000 Active 204 DOM
-
2026-06-15days on market $103,000 Active 203 DOM
-
2026-06-14days on market $103,000 Active 201 DOM
-
2026-06-12days on market $103,000 Active 200 DOM
-
2026-06-09days on market $103,000 Active 197 DOM
-
2026-06-08days on market $103,000 Active 196 DOM
-
2026-06-07days on market $103,000 Active 195 DOM
-
2026-06-05days on market $103,000 Active 192 DOM
-
2026-06-02days on market $103,000 Active 190 DOM
-
2026-06-01days on market $103,000 Active 189 DOM
-
2026-05-31days on market $103,000 Active 188 DOM
-
2026-05-30days on market $103,000 Active 187 DOM
-
2026-04-14price $103,000
-
2025-11-24$115,000 Active
-
2012-03-02soldstatus $31,100
-
2007-02-16soldstatus $17,620
ⓘ Source: listings_history table (triggers on properties + properties_extension) + one-shot
backfill from property_details.listing_events for pre-trigger history.
Climate risk First Street
- Flood 1/10 Low FEMA zone X (unshaded) · 0% chance over 30 yrs
- Wildfire 5/10 Major
- Heat 1/10 Low 6 d/yr ≥98°F today · 14 d/yr by 30 yrs out
- Wind 2/10 Low 100% chance of damaging wind over 30 yrs
- Air quality 1/10 Low 0 unhealthy d/yr today · 0 by 30 yrs out
Nearby sold comps map
Loading sold comps map…
Walkable amenities ~0.75 mi
Loading nearby amenities…
Taxation est. · year 1
- Rental income
- $18,810
- − Mortgage interest
- −$5,770
- − Property taxes
- −$1,545
- − Insurance
- −$515
- − Repairs & maintenance
- −$1,505
- − Management
- −$1,505
- − HOA
- −$444
- − Depreciation
- −$2,996
- Taxable income
- $4,531
- Est. tax owed @ 24.0%
- −$1,087
- After-tax cash flow
- $4,787/yr
For passive investors: Depreciation is non-cash, so a rental often shows a tax loss while cash-flowing — sheltering income. Rental losses are passive: they offset passive income freely, and up to $25,000/yr can offset ordinary (W-2) income if you actively participate and your MAGI is under $100k (phasing out to $0 by $150k); unused losses carry forward. On sale, claimed depreciation is recaptured at up to 25%, and gains may owe capital-gains tax (a 1031 exchange can defer both). Figures are a year-1 estimate at your 24.0% rate — not tax advice; consult a CPA.
Schools (NCES district)
- District
- Carroll County Public School District
- NCES district ID
- 5100690
- Math proficiency
- 60% ▼ -25.00%
- Reading proficiency
- 70% ▼ -10.00%
- Median HH income
- $36,359
- Composite
- 53.88/100
- National rank
- #1406
- State rank
- #46 of 131 in VA
Livability — Fancy Gap
- Score
- 56/100
- State rank
- #515
- US rank
- #23081
Category grades
Schools grade is shown separately in the Schools card above.
Census & demographics
- Population (ZIP)
- 1,724
Population outlook (Carroll County) Hauer SSP2
- Today (2025)
- 28,768 people
- By 2030
- 27,909 · -3.0%
- By 2040
- 25,788 · -10.4%
- By 2050
- 23,522 · -18.2%
- By 2075
- 19,045 · -33.8%
- By 2100
- 14,801 · -48.6%
Race, ethnicity, and origin ACS 2023
- Neighborhood character
- Predominantly White (97%)
- Race & ethnicity
- White 97%
- Common ancestry
- Italian 7% Serbian 4% Slovak 2%
Political lean MEDSL · Carroll
- 2024 margin
- Solid R (+63.3) · D 18.1% · R 81.4%
- 2008→2024 swing
- -30.9pp toward R · 2008: -32.4pp · 2024: -63.3pp
- All cycles
- 2024: R+63.3 2020: R+62.7 2016: R+59.6 2012: R+39.4 2008: R+32.4
Not yet ingested
- Civics
- —
Market trends
- HPI YoY
- ▲ 2.85%
- Current HPI
- 168.5656
- Rent YoY
- —
- Metro
- —
- State GDP YoY
- ▲ 2.40%
- F500 in state
- 50
Industry mix (Fortune 500 HQ in VA)
| Industry | F500 HQs | Revenue |
|---|---|---|
| Aerospace / Defense | 4 | $236B |
|
||
| Technology / Defense | 3 | $32B |
|
||
| Financial Services | 2 | $176B |
|
||
| Utilities | 2 | $27B |
|
||
| Insurance | 2 | $25B |
|
||
| Technology | 2 | $15B |
|
||
Price history
+484.6% since first listed4 events — show timeline
- 2026-04-14 Price Changed $103,000 SWVAR
- 2025-11-24 Listed $115,000 SWVAR
- 2012-03-02 Sold (Public Records) $31,100 Public Records
- 2007-02-16 Sold (Public Records) $17,620 Public Records
Property tax history
-2.0%/yrLatest (2025): $82 · +1.1% YoY. Source: county tax records.
Cash-flow waterfall
monthlySold comps — $/sqft
last 12 mo · ≤1 miLoading sold comps…