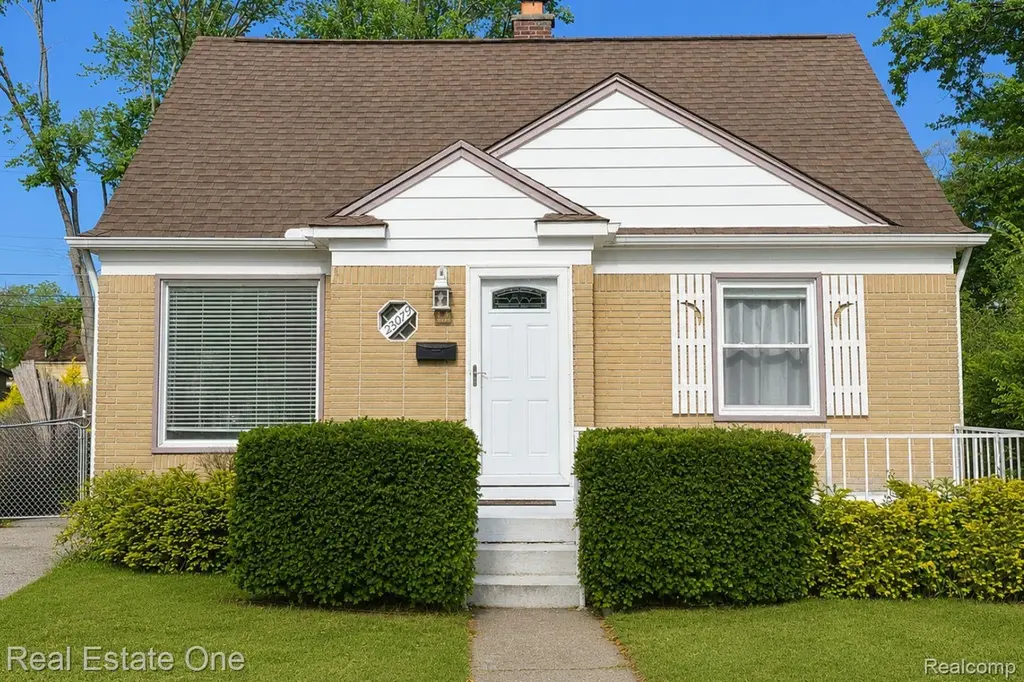
23079 Violet St · Farmington, MI
Flood risk 1/10 · Minimal
- FEMA flood zone
- X (unshaded)
- Chance of flooding over 30 yrs
- 0.0%
- Est. flood insurance / yr
- $507 – $1,088
Fire risk 1/10 · Minimal
- Est. fire insurance / yr
- $784 – $1,456
Heat risk 3/10 · Minor
- Hot days now (above 97°F)
- 7 days/yr
- Hot days in 30 yrs
- 15 days/yr
Wind risk 2/10 · Minimal
- Chance of severe wind over 30 yrs
- —
Air-quality risk 3/10 · Minor
- Unhealthy air days now
- 2 days/yr
- Unhealthy air days in 30 yrs
- 4 days/yr
Risk factors via First Street. Map © Google.
Why this score? — see what drove the D grade
The composite is a weighted blend of 9 inputs, each scored 0–100. Each bar is that input's sub-score; the figure is the points it added to the 100-point composite (weight × sub-score).
- Cash flow +10.8/30.0
- ARV discount +8.4/15.0
- Rent growth +5.0/5.0
- Schools +4.6/10.0
- Livability +4.6/5.0
- DSCR +3.1/10.0
- 1% rule +3.0/10.0
- Condition / age +2.5/5.0
- Appreciation +0.0/10.0
$215,000
🖨 Deal sheet 📄 Offer letter ✓ Due diligence
Listing remarks MLS
Charming bungalow in the heart of Farmington offering move-in ready comfort with room to add your personal finishing touches! Beautiful hardwood flooring flows throughout the main level, while abundant natural light fills the home with warmth and charm. Perfect as a starter home or investment property, this home features a spacious kitchen with ample cabinet storage and room for a dining table. All appliances are included for an easy transition. The oversized upstairs bedroom offers wonderful built-in storage and flexible living space. Downstairs, the clean and well-maintained full basement includes a charming root cellar and additional storage opportunities. Step outside to enjoy the deep, fenced backyard - ideal for children, pets, gardening, or entertaining. Located within highly regarded Farmington schools and just minutes from downtown Farmington's shopping, dining, and community events, this home is full of opportunity and value!
Key facts
- Hardwood flooring
- Spacious kitchen
- Full basement
Tags
Property features AI
Finance
- Other: Lot is paved with dimensions approximately 50 x 137 (0.16 acre)
Exterior
- Parking: No garage
- Utilities: Public water; Public sewer
- Home design: Single-family residence; One and one-half stories; Ground-level entry with steps; Brick construction
- Construction: Built with brick exterior; Block foundation
- Exterior features: Porch; Back yard fencing (fenced); Asphalt roof
Interior
- Kitchen: Free-standing electric range; Free-standing refrigerator; Disposal
- Bedrooms: 5 total rooms (includes bedrooms and living spaces)
- Bathrooms: 1 full bathroom
- Heating & cooling: Central air conditioning; Forced air heating (natural gas)
- Interior features: Disposal; Awning(s); Lighting
- Laundry & utility: Dryer; Gas water heater; Unfinished basement with sump pump
Neighborhood map
What this means for you Summary
Snapshot
- This is a 3-bed/1.0-bath single-family listed at $215k.
Deal economics
- At list price, monthly cash flow is $-99 ($-1k/yr) — negative.
- To cash-flow at today's rent, offer at most $198k (8.1% below list).
- To meet the 1% rule (rent ≥ 1% of price), the offer needs to be $172k (20.0% below list).
- Recommended offer: $172k (20.0% below list) — sets the bar for 1% rule.
- Cap rate 5.7% vs local median 3.6% in Farmington — top-decile yield for the area; either an underpriced asset or a hidden risk that comps aren't pricing in. Stress-test before assuming the spread holds.
Location & tenants
- Location reads 92/100 on livability (#3 in MI, #40 nationally) — a professional / high-income tenant draw. Strengths: crime A+, amenities A+, commute A+.
- Farmington Public School District (urban): math 45% / reading 58% proficiency, ranked #78 of 540 in MI (top 14%) — acceptable for families but not a draw, mixed tenant base, ~2y average lease; only 19% free/reduced lunch — higher-income household profile.
- Market conditions: Rents rising fast (+10.8%/yr); 156 active listings in the ZIP; 4 comparable units currently listed for rent nearby; rentals leasing fast (median 11d on market — plan ~1-2 weeks tenant-placement turnaround); solid renter incomes; 2,614 units permitted in Oakland County in 2024 (721 in 5+ unit buildings).
Forward outlook
- Local home prices are declining (-3.0%/yr); year-one equity from $1k of loan paydown is wiped out by about $6k of value loss. Plan a longer hold.
- Oakland County population projected at +10% by 2050 — modest demand growth; plan on rents tracking national, not racing it.
Negotiation context
- Only 8 days on market — expect competitive offers; lowballing is unlikely to land.
- 4 sale attempts since 15y ago with the ask held roughly flat each time — persistent listings suggest the price (not the market) is what's stuck; bring a comps-based counter.
- Current owner paid $68k; list at $215k implies a 214% gain — meaningful room to come down on a strong offer.
Risks & watch-outs
- Watch-outs: built in 1949 — expect roof / HVAC / electrical / plumbing capex.
Questions for the listing agent
- What do current leases actually rent for vs. the listed asking? Can we see a recent rent roll and the last 12 months of T-12 income?
- Built in 1949 — when were the roof, HVAC, electrical panel, plumbing, and water heater last replaced?
- Is there a deadline driving the sale (1031 exchange, divorce, estate, relocation)? That informs how much negotiation room exists.
- Schools are A-rated — typically a magnet for longer-tenancy family renters. What's the average tenant stay here, and is there a school-zone premium baked into asking?
- The area grade is low — what's the realistic commute time and amenity access for the typical tenant pool here? Any planned neighborhood developments (good or bad) we should know about?
- What's the average days-on-market for RENTAL listings here right now (not sales)? A rising rental-DOM trend means longer vacancies and softer asking-rent achievability than the comps imply.
- What's the recent tenant-quality profile in this submarket — average credit score on applications, eviction rate, late-payment / NSF rate, and stable-employment percentage? A property-management company in the area should have these aggregated.
- How much new for-sale + rental construction is in the pipeline within 1–3 miles? Heavy new supply typically softens prices + rents 12–24 months out; constrained supply supports both.
Investment metrics
- 1% rule
- 0.80% ✗
- Cap rate
- 5.74%
- Cash-on-cash
- -1.97%
- DSCR
- 0.91
- GRM
- 10.4
CMA / ARV
- ARV (on-the-fly)
- $219,275
- Comps found
- 12
Show comp detail 12 sales within ~0.75 mi
| Address | Dist | Beds/Ba | Sqft | Sold | Price | $/sf | Match |
|---|---|---|---|---|---|---|---|
| 23069 Violet St | 0.01mi | 3/1.0 | 1,000 (+12%) | 12mo | $245,000 | $245 | 70 |
| 22481 Springbrook Ave | 0.45mi | 3/1.0 | 963 (+8%) | 1mo | $200,100 | $208 | 66 |
| 23158 Tuck Rd | 0.46mi | 3/1.0 | 918 (+3%) | 12mo | $240,000 | $261 | 64 |
| 23033 Hawthorne St | 0.18mi | 2/1.0 (-1) | 1,026 (+15%) | 1mo | $230,000 | $224 | 61 |
| 22601 Purdue Ave | 0.74mi | 3/1.0 | 914 (+2%) | 3mo | $230,000 | $252 | 59 |
| 22810 Lilac St | 0.14mi | 2/1.0 (-1) | 1,012 (+13%) | 12mo | $240,000 | $237 | 57 |
| 22800 Power Rd | 0.56mi | 3/1.0 | 1,000 (+12%) | 3mo | $115,000 | $115 | 52 |
| 22126 Cora Ave | 0.47mi | 3/1.0 | 768 (-14%) | 3mo | $207,000 | $270 | 52 |
| 22810 Power Rd | 0.54mi | 2/1.0 (-1) | 843 (-6%) | 10mo | $250,000 | $297 | 52 |
| 22621 Purdue Ave | 0.73mi | 3/1.0 | 840 (-6%) | 10mo | $127,500 | $152 | 47 |
| 22811 Purdue Ave | 0.71mi | 2/1.0 (-1) | 808 (-10%) | 1mo | $179,900 | $223 | 45 |
| 21784 Ruth Street St | 0.61mi | 2/2.0 (-1) | 954 (+7%) | 11mo | $249,000 | $261 | 42 |
Match score weights: distance 35% · size 25% · config 20% · recency 20%. Top-matched comps best support the ARV.
Projected returns pro-forma
-3.0% appreciation · 8.0% rent growth · sell at horizon
- IRR
- -14.2%
- Equity multiple
- 0.47×
- Total profit
- $-32,042
- Equity at exit
- $32,057
- IRR
- 1.0%
- Equity multiple
- 1.09×
- Total profit
- $5,388
- Equity at exit
- $18,589
Cash invested: $60,200 (down + closing). Projections, not guarantees.
Landlord ↔ Tenant lean methodology
- Overall (STATE)
- 62 Landlord-Friendly
- State Michigan
- 62 Landlord-Friendly · EVEN
- County
- — inherits STATE
- City
- — inherits STATE
ZIP-level market 48336
- Rents YoY
- 10.8%
- Active inventory
- 156
- Price-to-rent
- 10.4×
Monthly cashflow live
- Estimated rent
- $1,720 medium interval (Pro) →
- Mortgage (P&I)
- −$1,127
- Tax from tax record
- −$241 /mo · $2,886/yr
- Insurance
- −$90
- HOA
- −$0
- Vacancy / Maint / Mgmt
- −$361
- Net cashflow
- $-99
Break-even live
UW: 25.0% down · 7.5% · 30yr · 1.5% tax · 5.0% vac · 8.0% maint · 8.0% mgmt
Financing live
Cash to close
- Down payment
- $53,750
- Closing costs
- $6,450
- Reserves months
- —
- Total cash needed
- —
Loan-product check · same deal, 3 products live
Conventional
25% down · 7.5% · 30yr
- Down + closing
- —
- Monthly P&I
- —
- Monthly cashflow
- —
- DSCR
- —
- Eligible?
- —
Personal DTI + credit; lowest rate.
DSCR
20% down · 8.5% · 30yr
- Down + closing
- —
- Monthly P&I
- —
- Monthly cashflow
- —
- DSCR
- —
- Eligible?
- —
No personal income docs; deal must DSCR.
Hard money
10% down · 12.0% · 12mo
- Down + closing
- —
- Monthly P&I
- —
- Monthly cashflow
- —
- DSCR
- —
- Eligible?
- —
Short-term bridge; refi at stabilization.
Rent comps 4 comps
| Address | Beds | Baths | Sqft | Rent | $/sqft | DOM | Units | Dist |
|---|---|---|---|---|---|---|---|---|
| 23085 Floral St Farmington, MI | 2.0 | 1.0 | 950 | $1,495 | $1.57 | 10d | 1 | 0.14mi |
| 23611 Bicking Ct Farmington, MI | 3.0 | 1.0 | 1117 | $2,100 | $1.88 | 43d | 1 | 0.61mi |
| 23237 Tulane Ave Farmington Hills, MI | 3.0 | 1.5 | 1104 | $2,000 | $1.81 | 10d | 1 | 0.90mi |
| 33203 N Manor Dr Farmington, MI | 1.0–2.0 | 1.0 | 855 | $1,478 | $1.73 | 2d | 14 | 1.09mi |
Listing history 13 events
-
2026-06-07statusdays on market $215,000 Pending 8 DOM
-
2026-06-04days on market $215,000 Active 7 DOM
-
2026-06-02days on market $215,000 Active 5 DOM
-
2026-06-01days on market $215,000 Active 4 DOM
-
2026-05-31days on market $215,000 Active 3 DOM
-
2026-05-28$215,000 Active
Show marketing remark (951 chars)
Charming bungalow in the heart of Farmington offering move-in ready comfort with room to add your personal finishing touches! Beautiful hardwood flooring flows throughout the main level, while abundant natural light fills the home with warmth and charm. Perfect as a starter home or investment property, this home features a spacious kitchen with ample cabinet storage and room for a dining table. All appliances are included for an easy transition. The oversized upstairs bedroom offers wonderful built-in storage and flexible living space. Downstairs, the clean and well-maintained full basement includes a charming root cellar and additional storage opportunities. Step outside to enjoy the deep, fenced backyard - ideal for children, pets, gardening, or entertaining. Located within highly regarded Farmington schools and just minutes from downtown Farmington's shopping, dining, and community events, this home is full of opportunity and value!
-
2026-05-28$215,000 Active 951-char remark
Show marketing remark (951 chars)
Charming bungalow in the heart of Farmington offering move-in ready comfort with room to add your personal finishing touches! Beautiful hardwood flooring flows throughout the main level, while abundant natural light fills the home with warmth and charm. Perfect as a starter home or investment property, this home features a spacious kitchen with ample cabinet storage and room for a dining table. All appliances are included for an easy transition. The oversized upstairs bedroom offers wonderful built-in storage and flexible living space. Downstairs, the clean and well-maintained full basement includes a charming root cellar and additional storage opportunities. Step outside to enjoy the deep, fenced backyard - ideal for children, pets, gardening, or entertaining. Located within highly regarded Farmington schools and just minutes from downtown Farmington's shopping, dining, and community events, this home is full of opportunity and value!
-
2011-11-28soldstatus $68,500 309-char remark
Show marketing remark (309 chars)
LOCATION, LOCATION, LOCATION; 3 BR BUNGALOW, UPDATED AND EXTREMELY WELL MAINTAINED ON QUIET TREE LINED STREET WITH LARGE FENCED YARD. BASEMENT IS PARTIALLY FINISHED AFFORDING ALOT OF POTENTIAL LIVING SPACE IF DESIRED. CLOSE TO AWARD WINNING FARMINGTON SCHOOLS, THIS HOME MUST BE SEEN TO BE APPRECIATED. LATPAO
-
2011-11-28soldstatus $68,500
Show marketing remark (309 chars)
LOCATION, LOCATION, LOCATION; 3 BR BUNGALOW, UPDATED AND EXTREMELY WELL MAINTAINED ON QUIET TREE LINED STREET WITH LARGE FENCED YARD. BASEMENT IS PARTIALLY FINISHED AFFORDING ALOT OF POTENTIAL LIVING SPACE IF DESIRED. CLOSE TO AWARD WINNING FARMINGTON SCHOOLS, THIS HOME MUST BE SEEN TO BE APPRECIATED. LATPAO
-
2011-10-29historical 309-char remark
Show marketing remark (309 chars)
LOCATION, LOCATION, LOCATION; 3 BR BUNGALOW, UPDATED AND EXTREMELY WELL MAINTAINED ON QUIET TREE LINED STREET WITH LARGE FENCED YARD. BASEMENT IS PARTIALLY FINISHED AFFORDING ALOT OF POTENTIAL LIVING SPACE IF DESIRED. CLOSE TO AWARD WINNING FARMINGTON SCHOOLS, THIS HOME MUST BE SEEN TO BE APPRECIATED. LATPAO
-
2011-06-01$79,900 309-char remark
Show marketing remark (309 chars)
LOCATION, LOCATION, LOCATION; 3 BR BUNGALOW, UPDATED AND EXTREMELY WELL MAINTAINED ON QUIET TREE LINED STREET WITH LARGE FENCED YARD. BASEMENT IS PARTIALLY FINISHED AFFORDING ALOT OF POTENTIAL LIVING SPACE IF DESIRED. CLOSE TO AWARD WINNING FARMINGTON SCHOOLS, THIS HOME MUST BE SEEN TO BE APPRECIATED. LATPAO
-
2011-06-01$69,900
Show marketing remark (309 chars)
LOCATION, LOCATION, LOCATION; 3 BR BUNGALOW, UPDATED AND EXTREMELY WELL MAINTAINED ON QUIET TREE LINED STREET WITH LARGE FENCED YARD. BASEMENT IS PARTIALLY FINISHED AFFORDING ALOT OF POTENTIAL LIVING SPACE IF DESIRED. CLOSE TO AWARD WINNING FARMINGTON SCHOOLS, THIS HOME MUST BE SEEN TO BE APPRECIATED. LATPAO
-
1999-06-28soldstatus $119,000
ⓘ Source: listings_history table (triggers on properties + properties_extension) + one-shot
backfill from property_details.listing_events for pre-trigger history.
Tax reassessment forecast MI · Partial reset (capped growth)
- Current annual tax
- $2,886 · $241/mo
- Projected year-2 tax
- $3,099 · $258/mo
- Expected delta
- +$212/yr (+$18/mo · 7.4%)
ⓘ Screening estimate from a state-policy table — verify with the county assessor before closing.
Climate risk First Street
- Flood 1/10 Low FEMA zone X (unshaded) · 0% chance over 30 yrs
- Wildfire 1/10 Low
- Heat 3/10 Moderate 7 d/yr ≥97°F today · 15 d/yr by 30 yrs out
- Wind 2/10 Low
- Air quality 3/10 Moderate 2 unhealthy d/yr today · 4 by 30 yrs out
Nearby sold comps map
Loading sold comps map…
Walkable amenities ~0.75 mi
Loading nearby amenities…
Taxation est. · year 1
- Rental income
- $20,638
- − Mortgage interest
- −$12,043
- − Property taxes
- −$2,886
- − Insurance
- −$1,075
- − Repairs & maintenance
- −$1,651
- − Management
- −$1,651
- − Depreciation
- −$6,255
- Taxable loss
- −$4,923
- Est. tax savings @ 24.0%
- +$1,182
- After-tax cash flow
- $-5/yr
For passive investors: Depreciation is non-cash, so a rental often shows a tax loss while cash-flowing — sheltering income. Rental losses are passive: they offset passive income freely, and up to $25,000/yr can offset ordinary (W-2) income if you actively participate and your MAGI is under $100k (phasing out to $0 by $150k); unused losses carry forward. On sale, claimed depreciation is recaptured at up to 25%, and gains may owe capital-gains tax (a 1031 exchange can defer both). Figures are a year-1 estimate at your 24.0% rate — not tax advice; consult a CPA.
Schools (NCES district)
- District
- Farmington Public School District
- NCES district ID
- 2614070
- Math proficiency
- 45% ▼ -5.00%
- Reading proficiency
- 58% ▼ -1.00%
- Median HH income
- $72,846
- Composite
- 46.17/100
- National rank
- #2497
- State rank
- #78 of 540 in MI
Livability — Farmington
- Score
- 92/100
- State rank
- #3
- US rank
- #40
Category grades
Schools grade is shown separately in the Schools card above.
Census & demographics
- Census place
- Farmington, MI
- County
- Oakland County · 1,009,092 people
- City population
- 25,077
- Metro
- Detroit-Warren-Dearborn, MI
- Population (ZIP)
- 26,432
- Household income
- $88,938
- Rent vs Own
- Severe rent burden
- 733.0
Population outlook (Oakland County) Hauer SSP2
- Today (2025)
- 1,335,747 people
- By 2030
- 1,375,100 · +2.9%
- By 2040
- 1,435,385 · +7.5%
- By 2050
- 1,469,250 · +10.0%
- By 2075
- 1,531,946 · +14.7%
- By 2100
- 1,450,485 · +8.6%
Race, ethnicity, and origin ACS 2023
- Neighborhood character
- Predominantly White (71%)
- Race & ethnicity
- White 71% Black 13% Two or more races 7% Asian 6% Hispanic / Latino 4%
- Common ancestry
- Romanian 10% Slovak 3% Lithuanian 3%
- Foreign-born
- 12% · Canada, China, South Korea
- Languages at home
- 85% English-only · Other Indo-European 5% Arabic 2% Spanish 2%
Political lean MEDSL · Oakland
- 2024 margin
- D (+10.6) · D 54.4% · R 43.8% · Other 1.9%
- 2008→2024 swing
- -3.9pp toward R · 2008: 14.5pp · 2024: 10.6pp
- All cycles
- 2024: D+10.6 2020: D+14.1 2016: D+8.1 2012: D+8.1 2008: D+14.5
Not yet ingested
- Civics
- —
Market trends
- HPI YoY
- ▼ -273.86%
- Current HPI
- 177.4299
- Rent YoY
- ▲ 10.83%
- Metro
- Detroit-Warren-Dearborn, MI
- State GDP YoY
- ▲ 1.37%
- F500 in state
- 28
Industry mix (Fortune 500 HQ in MI)
| Industry | F500 HQs | Revenue |
|---|---|---|
| Automotive Parts | 3 | $48B |
|
||
| Automotive | 2 | $372B |
|
||
| Chemicals | 1 | $45B |
|
||
| Automotive Retail | 1 | $29B |
|
||
| Healthcare / Medical Devices | 1 | $23B |
|
||
| Automotive Technology | 1 | $20B |
|
||
Price history
+80.7% since first listed8 events — show timeline
- 2026-05-28 Listed $215,000 MiRealSource-MiMLS
- 2026-05-28 Listed $215,000 REALCOMP
- 2011-11-28 Sold (MLS) $68,500 REALCOMP
- 2011-11-28 Sold (MLS) $68,500 MiRealSource-MiMLS
- 2011-10-29 Listing Removed — MiRealSource-MiMLS
- 2011-06-01 Listed $69,900 REALCOMP
- 2011-06-01 Listed $79,900 MiRealSource-MiMLS
- 1999-06-28 Sold (Public Records) $119,000 Public Records
Property tax history
-0.4%/yrLatest (2025): $2,886 · +3.2% YoY. Source: county tax records.
Cash-flow waterfall
monthlySold comps — $/sqft
last 12 mo · ≤1 miLoading sold comps…