 🌊 Lakefront
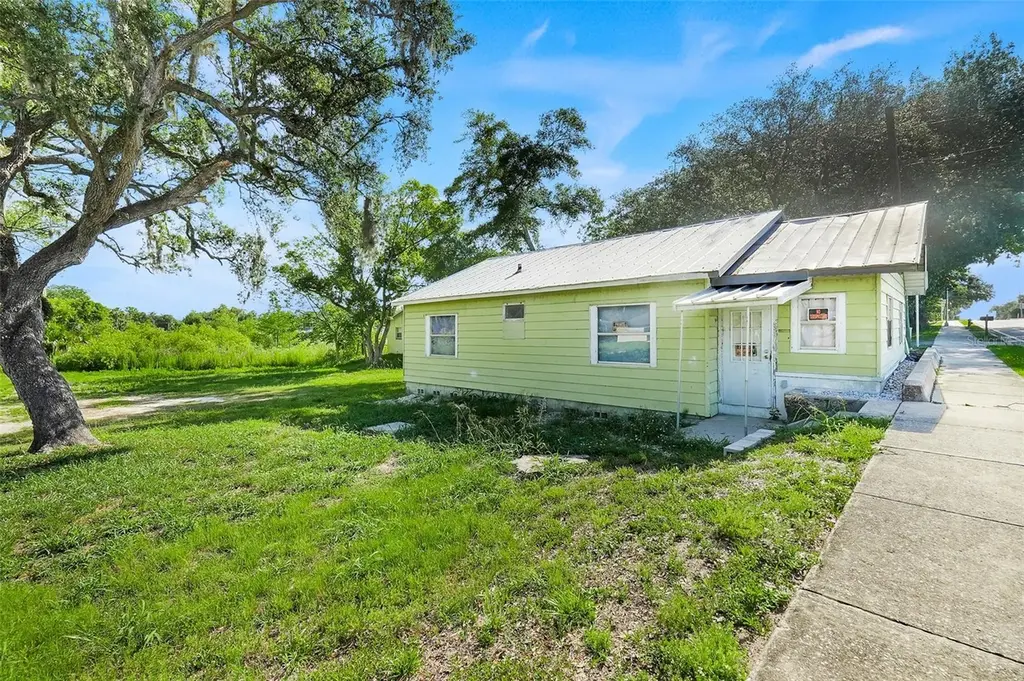
2104 South St · Leesburg, FL
Flood risk 1/10 · Minimal
- FEMA flood zone
- X (unshaded)
- Chance of flooding over 30 yrs
- 0.0%
- Est. flood insurance / yr
- $507 – $1,088
Fire risk 3/10 · Minor
- Est. fire insurance / yr
- $947 – $1,759
Heat risk 8/10 · Major
- Hot days now (above 108°F)
- 7 days/yr
- Hot days in 30 yrs
- 22 days/yr
Wind risk 9/10 · Severe
- Chance of severe wind over 30 yrs
- 99.0%
Air-quality risk 2/10 · Minimal
- Unhealthy air days now
- 1 days/yr
- Unhealthy air days in 30 yrs
- 1 days/yr
Risk factors via First Street. Map © Google.
Why this score? — see what drove the B- grade
The composite is a weighted blend of 9 inputs, each scored 0–100. Each bar is that input's sub-score; the figure is the points it added to the 100-point composite (weight × sub-score).
- Cash flow +30.0/30.0
- 1% rule +10.0/10.0
- DSCR +10.0/10.0
- ARV discount +7.5/15.0
- Schools +4.2/10.0
- Livability +3.1/5.0
- Condition / age +2.5/5.0
- Rent growth +2.3/5.0
- Appreciation +0.0/10.0
$59,990
🖨 Deal sheet 📄 Offer letter ✓ Due diligence
Listing remarks
Under contract-accepting backup offers. Don’t miss this exceptional investment opportunity in the heart of Leesburg. Ideally situated just west of the intersection of US 27 and South Street (SR 44), this 0.58-acre parcel offers outstanding potential for redevelopment or new construction. Zoned “Medium Density Residential” by the City of Leesburg, the property currently allows for up to two dwelling units, making it an excellent opportunity for duplex development or income-producing residential housing. Positioned near major roadways and regional employment hubs, the location is highly desirable for tenants seeking convenience and accessibility. Existing nearby utility conn
Key facts
- Duplex development
- 0.58-acre parcel
- Two dwelling units
Tags
Property features AI
Finance
- Other: Property type: Residential, single family; Zoning: R-2; Lot dimensions approximately 100 x 255 (0.59 acres); Road surface: Dirt
- Financial info: No investor or income/expense details provided
- HOA & community: No HOA
Exterior
- Parking: No parking information provided
- Security: No security features listed
- Utilities: Water: None listed (water available noted); Sewer: None listed; Utilities: Water available
- Home design: Single-family residence; One story; Faces south
- Construction: Frame and other construction materials; Metal and other roof; Pillar/Post/Pier foundation; Built on one level
- Exterior features: Other exterior features
Interior
- Kitchen: No appliances listed
- Bedrooms: 2 bedrooms
- Flooring: Other flooring
- Bathrooms: 1 full bathroom
- Heating & cooling: No heating; No cooling
- Interior features: No interior features listed
- Laundry & utility: No laundry facilities
Neighborhood map
What this means for you Summary
Snapshot
- This is a 2-bed/1.0-bath single-family listed at $60k.
Deal economics
- At list price, monthly cash flow is $651 ($8k/yr) — positive.
- The deal already cash-flows at list — no discount required.
- Meets the 1% rule at list price ($1k rent vs $60k).
- Cap rate 19.3% vs local median 4.5% in Leesburg — top-decile yield for the area; either an underpriced asset or a hidden risk that comps aren't pricing in. Stress-test before assuming the spread holds.
Location & tenants
- Location reads 62/100 on livability (#751 in FL) — a middle-class / working-renter tenant base. Strengths: cost of living A+, housing A+; Watch: schools D+, crime D, amenities F.
- Lake (suburban): math 49% / reading 50% proficiency, ranked #37 of 73 in FL (top 51%) — families likely to look elsewhere, expect single-tenant / working-renter base with shorter leases.
- Market conditions: Rents soft (-0.9%/yr); 783 active listings in the ZIP; 32 comparable units currently listed for rent nearby; rentals at typical pace (median 24d on market — plan ~3-4 weeks tenant-placement turnaround); 4,799 units permitted in Lake County in 2024 (814 in 5+ unit buildings).
- This rent runs 30% of the median local income ($58k/yr) — at the standard rent-burdened threshold; future hikes will face affordability resistance.
Forward outlook
- Local home prices are declining (-3.0%/yr); year-one equity from $414 of loan paydown is wiped out by about $2k of value loss. Plan a longer hold.
- Lake County population projected at +37% by 2050 — long-run rental-demand tailwind backs the buy-and-hold thesis.
- At projected returns (-3.0% appreciation + 0.0% rent growth), your $17k cash investment doubles in ~3 years — after that, you're playing with house money.
Negotiation context
- Only 3 days on market — expect competitive offers; lowballing is unlikely to land.
Risks & watch-outs
- Watch-outs: property tax is 3.3% of price; built in 1944 — expect roof / HVAC / electrical / plumbing capex.
- Climate carrying-cost: severe wind risk, 99% chance of damaging wind over 30y; extreme-heat days projected 7→22/yr by 2055 (HVAC capex compounding) — expect insurance premiums to compound above CPI over the hold.
Questions for the listing agent
- Built in 1944 — when were the roof, HVAC, electrical panel, plumbing, and water heater last replaced?
- Property tax is high relative to price — has the assessment been appealed recently, and will the sale trigger a re-assessment?
- Is there a deadline driving the sale (1031 exchange, divorce, estate, relocation)? That informs how much negotiation room exists.
- Schools are D-rated, which usually means shorter tenancies and higher turnover. Who's the typical renter profile here, and what's been the actual vacancy rate?
- Crime grade is D in this area — have there been break-ins, vandalism, or insurance claims at this property in the last 3 years? What carrier currently insures it and at what premium?
- This sits on a lake — are riparian / water-frontage rights deeded with the parcel? Any dock permits, shoreline easements, or HOA water-use restrictions?
- What's the documented flood / surge / shoreline-erosion history here (FEMA AND non-FEMA — e.g., storm surge, creek backup, septic-field saturation)?
- Any water-quality or seasonal algae-bloom issues that affect tenant satisfaction or short-term-rental demand?
- What's the average days-on-market for RENTAL listings here right now (not sales)? A rising rental-DOM trend means longer vacancies and softer asking-rent achievability than the comps imply.
- What's the recent tenant-quality profile in this submarket — average credit score on applications, eviction rate, late-payment / NSF rate, and stable-employment percentage? A property-management company in the area should have these aggregated.
- How much new for-sale + rental construction is in the pipeline within 1–3 miles? Heavy new supply typically softens prices + rents 12–24 months out; constrained supply supports both.
Investment metrics
- 1% rule
- 2.44% ✓
- Cap rate
- 19.32%
- Cash-on-cash
- 46.53%
- DSCR
- 3.07
- GRM
- 3.4
CMA / ARV
- ARV (on-the-fly)
- $193,900
- Comps found
- 11
Show comp detail 11 sales within ~0.75 mi
| Address | Dist | Beds/Ba | Sqft | Sold | Price | $/sf | Match |
|---|---|---|---|---|---|---|---|
| 2104 South St | 0.00mi | 2/1.0 | 1,108 (0%) | 0mo | $59,990 | $54 | 100 |
| 811 S Lone Oak Dr | 0.15mi | 3/1.0 (+1) | 1,104 (-0%) | 7mo | $190,000 | $172 | 81 |
| 2303 Mahoney Ave | 0.33mi | 2/2.0 | 1,196 (+8%) | 0mo | $225,000 | $188 | 67 |
| 726 Scenic St | 0.44mi | 3/2.0 (+1) | 1,075 (-3%) | 9mo | $230,000 | $214 | 58 |
| 2304 Vine St | 0.54mi | 3/1.0 (+1) | 1,181 (+7%) | 2mo | $172,000 | $146 | 57 |
| 1602 Sheffield Rd | 0.59mi | 3/1.5 (+1) | 1,094 (-1%) | 10mo | $209,300 | $191 | 55 |
| 1108 Flamingo Dr | 0.58mi | 3/1.0 (+1) | 1,155 (+4%) | 8mo | $153,000 | $132 | 54 |
| 1315 Braebury Dr | 0.39mi | 3/1.5 (+1) | 1,240 (+12%) | 3mo | $217,000 | $175 | 52 |
| 1409 Braebury Dr | 0.50mi | 3/2.0 (+1) | 1,102 (-0%) | 18mo | $224,900 | $204 | 52 |
| 108 N Oakland St | 0.70mi | 3/1.0 (+1) | 1,056 (-5%) | 18mo | $160,000 | $152 | 40 |
| 2202 Butler St | 0.58mi | 3/1.0 (+1) | 951 (-14%) | 11mo | $198,000 | $208 | 36 |
Match score weights: distance 35% · size 25% · config 20% · recency 20%. Top-matched comps best support the ARV.
Projected returns pro-forma
-3.0% appreciation · 0.0% rent growth · sell at horizon
- IRR
- 40.1%
- Equity multiple
- 2.64×
- Total profit
- $27,557
- Equity at exit
- $8,945
- IRR
- 44.9%
- Equity multiple
- 4.64×
- Total profit
- $61,175
- Equity at exit
- $5,187
Cash invested: $16,797 (down + closing). Projections, not guarantees.
Landlord ↔ Tenant lean methodology
- Overall (STATE)
- 87 Strongly Landlord-Friendly
- State Florida
- 87 Strongly Landlord-Friendly · R+3
- County
- — inherits STATE
- City
- — inherits STATE
ZIP-level market 34748
- Home prices YoY
- -25.3%
- Rents YoY
- -0.9%
- Active inventory
- 783
- Price-to-rent
- 3.4×
Monthly cashflow live
- Estimated rent
- $1,461 high interval (Pro) →
- Mortgage (P&I)
- −$315
- Tax from tax record
- −$163 /mo · $1,961/yr
- Insurance
- −$25
- HOA
- −$0
- Vacancy / Maint / Mgmt
- −$307
- Net cashflow
- $651
Break-even live
UW: 25.0% down · 7.5% · 30yr · 1.5% tax · 5.0% vac · 8.0% maint · 8.0% mgmt
Financing live
Cash to close
- Down payment
- $14,998
- Closing costs
- $1,800
- Reserves months
- —
- Total cash needed
- —
Loan-product check · same deal, 3 products live
Conventional
25% down · 7.5% · 30yr
- Down + closing
- —
- Monthly P&I
- —
- Monthly cashflow
- —
- DSCR
- —
- Eligible?
- —
Personal DTI + credit; lowest rate.
DSCR
20% down · 8.5% · 30yr
- Down + closing
- —
- Monthly P&I
- —
- Monthly cashflow
- —
- DSCR
- —
- Eligible?
- —
No personal income docs; deal must DSCR.
Hard money
10% down · 12.0% · 12mo
- Down + closing
- —
- Monthly P&I
- —
- Monthly cashflow
- —
- DSCR
- —
- Eligible?
- —
Short-term bridge; refi at stabilization.
Rent comps 32 comps
| Address | Beds | Baths | Sqft | Rent | $/sqft | DOM | Units | Dist |
|---|---|---|---|---|---|---|---|---|
| 822 S Lone Oak Dr Unit B Leesburg, FL | 2.0 | 1.0 | 900 | $1,195 | $1.33 | 24d | 1 | 0.12mi |
| 1604 Woodlyn Dr Leesburg, FL | 3.0 | 1.5 | 1088 | $1,500 | $1.38 | 24d | 1 | 0.41mi |
| 1317 Cambridge Dr Leesburg, FL | 3.0 | 1.5 | 1240 | $1,600 | $1.29 | 24d | 1 | 0.49mi |
| 2602 Houston Pl Leesburg, FL | 2.0 | 2.0 | 960 | $1,895 | $1.97 | 5d | 1 | 0.60mi |
| 200 S Moss St Leesburg, FL | 3.0 | 2.0 | 968 | $1,500 | $1.55 | 24d | 1 | 0.62mi |
| 114 N Chester St Leesburg, FL | 1.0 | 1.0 | 702 | $850 | $1.21 | 5d | 1 | 0.69mi |
| 1220 W Dixie Ave Leesburg, FL | 3.0 | 2.0 | 1304 | $1,600 | $1.23 | 5d | 1 | 0.74mi |
| 513 Old Colony Rd Leesburg, FL | 3.0 | 2.0 | 1198 | $1,699 | $1.42 | 5d | 1 | 0.80mi |
| 502 Old Colony Rd Leesburg, FL | 3.0 | 2.0 | 1456 | $1,299 | $0.89 | 24d | 1 | 0.80mi |
| 1401 Floradel Ave Leesburg, FL | 2.0 | 1.0 | 1190 | $1,495 | $1.26 | 3d | 1 | 0.85mi |
| 210 N Lone Oak Dr Unit 1 Leesburg, FL | 2.0 | 1.0 | 912 | $1,250 | $1.37 | 15d | 1 | 0.87mi |
| 1801 Center St Unit 2 Leesburg, FL | 2.0 | 1.0 | 754 | $1,300 | $1.72 | 24d | 1 | 0.88mi |
| 1004 Royal Oak Blvd Unit 1004 Leesburg, FL | 2.0 | 2.5 | 1244 | $1,550 | $1.25 | 4d | 1 | 0.93mi |
| 2920 Pecan Ave Leesburg, FL | 2.0 | 2.5 | 1288 | $1,700 | $1.32 | 24d | 1 | 0.94mi |
| 1403 Old Harbor Blvd Leesburg, FL | 1.0–4.0 | 1.0–3.0 | 1079 | $1,366 | $1.27 | 3d | 9 | 0.97mi |
| 716 Marietta St Leesburg, FL | 3.0 | 2.0 | 1250 | $1,600 | $1.28 | 24d | 1 | 0.97mi |
| 2940 Peach St Leesburg, FL | 2.0 | 2.5 | 1288 | $1,750 | $1.36 | 18d | 1 | 0.98mi |
| 301 S 11th St Leesburg, FL | 2.0 | 1.0 | 816 | $1,450 | $1.78 | 24d | 1 | 1.02mi |
| 913 Sumter St Unit 102 Leesburg, FL | 2.0 | 2.0 | 1080 | $1,395 | $1.29 | 18d | 1 | 1.05mi |
| 200 S 11th St Unit 102 Leesburg, FL | 2.0 | 2.5 | 1379 | $1,675 | $1.21 | 24d | 1 | 1.07mi |
| 200 S 11th St Leesburg, FL | 2.0 | 2.0 | 1379 | $1,675 | $1.21 | 24d | 1 | 1.07mi |
| 813 S 9th St Leesburg, FL | 2.0 | 2.0 | 1400 | $2,000 | $1.43 | 24d | 1 | 1.11mi |
| 1112 W Main St Unit B-5 Leesburg, FL | 2.0 | 2.0 | 1000 | $1,400 | $1.40 | 24d | 1 | 1.12mi |
| 400 S 6th St Leesburg, FL | 2.0 | 1.0 | 700 | $1,250 | $1.79 | 24d | 1 | 1.26mi |
| 306 Perkins St Leesburg, FL | 1.0 | 1.0 | 750 | $999 | $1.33 | 24d | 1 | 1.27mi |
| 325 S 2nd St Unit 206 Leesburg, FL | 2.0 | 2.0 | 1000 | $1,700 | $1.70 | 5d | 1 | 1.34mi |
| 1009 Nebraska St Leesburg, FL | 3.0 | 1.0 | 864 | $1,850 | $2.14 | 12d | 1 | 1.44mi |
| 1009 McCormack St Leesburg, FL | 2.0 | 1.0 | 1400 | $1,025 | $0.73 | 24d | 1 | 1.44mi |
| 1013 Beecher St Unit 1 Leesburg, FL | 3.0 | 1.0 | 900 | $1,250 | $1.39 | 22d | 1 | 1.45mi |
| 1015 Beecher St Unit 1 Leesburg, FL | 2.0 | 1.0 | 853 | $1,100 | $1.29 | 24d | 1 | 1.45mi |
| 1001 Crawford St Unit 1 Leesburg, FL | 3.0 | 1.0 | 800 | $1,100 | $1.38 | 15d | 1 | 1.47mi |
| 1001 Crawford St Leesburg, FL | 3.0 | 1.0 | 800 | $1,100 | $1.38 | 11d | 1 | 1.47mi |
Listing history 1 events
-
2026-05-23$59,990 Active
ⓘ Source: listings_history table (triggers on properties + properties_extension) + one-shot
backfill from property_details.listing_events for pre-trigger history.
Tax reassessment forecast FL · Resets to sale price
- Current annual tax
- $1,961 · $163/mo
- Projected year-2 tax
- $1,961 · $163/mo
- Expected delta
- $0/yr ($0/mo · 0.0%)
ⓘ Screening estimate from a state-policy table — verify with the county assessor before closing.
Climate risk First Street
- Flood 1/10 Low FEMA zone X (unshaded) · 0% chance over 30 yrs
- Wildfire 3/10 Moderate
- Heat 8/10 Severe 7 d/yr ≥108°F today · 22 d/yr by 30 yrs out
- Wind 9/10 Extreme 99% chance of damaging wind over 30 yrs
- Air quality 2/10 Low 1 unhealthy d/yr today · 1 by 30 yrs out
Nearby sold comps map
Loading sold comps map…
Walkable amenities ~0.75 mi
Loading nearby amenities…
Taxation est. · year 1
- Rental income
- $17,535
- − Mortgage interest
- −$3,360
- − Property taxes
- −$1,961
- − Insurance
- −$300
- − Repairs & maintenance
- −$1,403
- − Management
- −$1,403
- − Depreciation
- −$1,745
- Taxable income
- $7,362
- Est. tax owed @ 24.0%
- −$1,767
- After-tax cash flow
- $6,049/yr
For passive investors: Depreciation is non-cash, so a rental often shows a tax loss while cash-flowing — sheltering income. Rental losses are passive: they offset passive income freely, and up to $25,000/yr can offset ordinary (W-2) income if you actively participate and your MAGI is under $100k (phasing out to $0 by $150k); unused losses carry forward. On sale, claimed depreciation is recaptured at up to 25%, and gains may owe capital-gains tax (a 1031 exchange can defer both). Figures are a year-1 estimate at your 24.0% rate — not tax advice; consult a CPA.
Schools (NCES district)
- District
- Lake
- NCES district ID
- 1201050
- Math proficiency
- 49% ▼ -7.00%
- Reading proficiency
- 50% ▼ -4.00%
- Median HH income
- $46,632
- Composite
- 42.05/100
- National rank
- #3327
- State rank
- #37 of 73 in FL
Livability — Leesburg
- Score
- 62/100
- State rank
- #751
- US rank
- #16429
Category grades
Schools grade is shown separately in the Schools card above.
Census & demographics
- Census place
- Leesburg, FL
- County
- Lake County · 364,602 people
- City population
- 70,232
- Metro
- Orlando-Kissimmee-Sanford, FL
- Population (ZIP)
- 48,095
- Household income
- $58,192
- Rent vs Own
- Severe rent burden
- 1745.0
Population outlook (Lake County) Hauer SSP2
- Today (2025)
- 386,640 people
- By 2030
- 417,107 · +7.9%
- By 2040
- 476,676 · +23.3%
- By 2050
- 531,296 · +37.4%
- By 2075
- 648,303 · +67.7%
- By 2100
- 698,530 · +80.7%
Race, ethnicity, and origin ACS 2023
- Neighborhood character
- Majority White (64%)
- Race & ethnicity
- White 64% Black 16% Hispanic / Latino 15% Two or more races 9% Asian 1%
- Hispanic origin (detail)
- Mexican 4% Puerto Rican 5% Cuban 3%
- Common ancestry
- Romanian 3% Lithuanian 3% Slovak 2%
- Foreign-born
- 9% · Canada, Vietnam, Jamaica
- Languages at home
- 88% English-only · Spanish 10% French/Haitian/Cajun 1%
Political lean MEDSL · Lake
- 2024 margin
- Strong R (+24.7) · D 37.3% · R 62.0%
- 2008→2024 swing
- -11.2pp toward R · 2008: -13.5pp · 2024: -24.7pp
- All cycles
- 2024: R+24.7 2020: R+20.0 2016: R+23.1 2012: R+17.1 2008: R+13.5
Not yet ingested
- Civics
- —
Market trends
- HPI YoY
- ▼ -88.97%
- Current HPI
- 262.1766
- Rent YoY
- ▼ -0.95%
- Metro
- Orlando-Kissimmee-Sanford, FL
- State GDP YoY
- ▲ 3.28%
- F500 in state
- 36
Industry mix (Fortune 500 HQ in FL)
| Industry | F500 HQs | Revenue |
|---|---|---|
| Industrial Technology | 2 | $29B |
|
||
| Insurance | 2 | $17B |
|
||
| Retail | 1 | $60B |
|
||
| Technology Distribution | 1 | $58B |
|
||
| Homebuilding | 1 | $35B |
|
||
| Technology Manufacturing | 1 | $35B |
|
||
Price history
1 event — show timeline
- 2026-05-23 Listed $59,990 Stellar MLS as Distributed by MLS Grid
Property tax history
+22.8%/yrLatest (2025): $1,961 · +8.0% YoY. Source: county tax records.
Cash-flow waterfall
monthlySold comps — $/sqft
last 12 mo · ≤1 miLoading sold comps…