 Multi-family
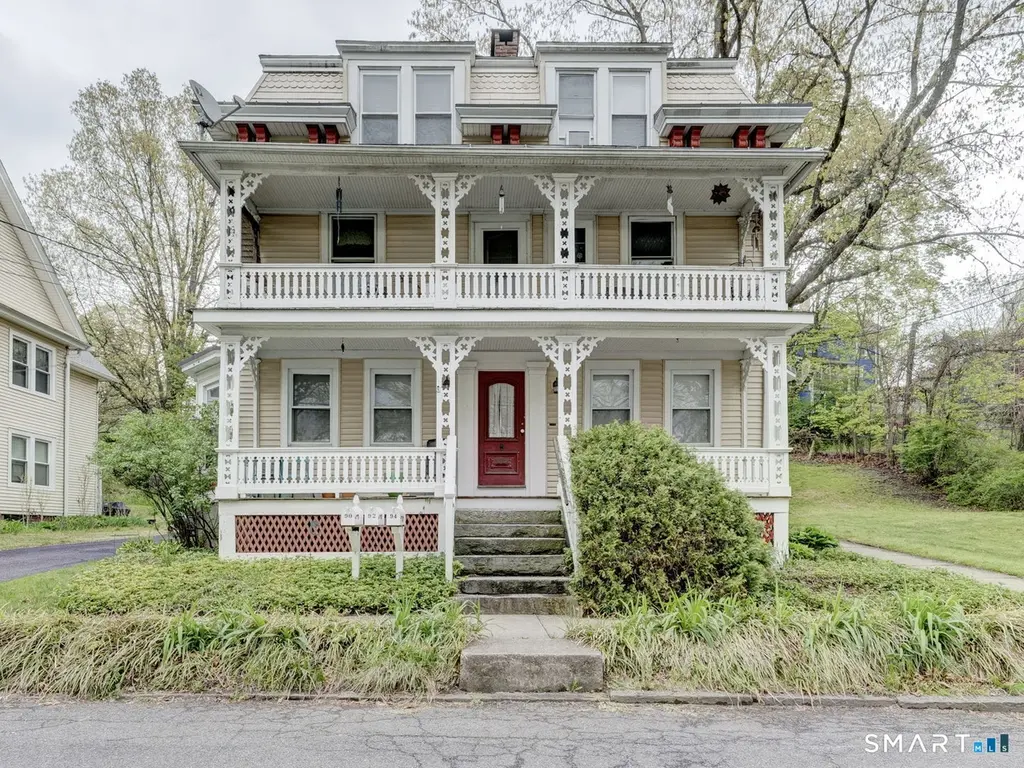
90 Humphrey St · Ansonia, CT
Flood risk 1/10 · Minimal
- FEMA flood zone
- X (unshaded)
- Chance of flooding over 30 yrs
- 0.0%
- Est. flood insurance / yr
- $473 – $860
Fire risk 1/10 · Minimal
- Est. fire insurance / yr
- $829 – $1,539
Heat risk 6/10 · Moderate
- Hot days now (above 97°F)
- 7 days/yr
- Hot days in 30 yrs
- 17 days/yr
Wind risk 6/10 · Moderate
- Chance of severe wind over 30 yrs
- 27.0%
Air-quality risk 3/10 · Minor
- Unhealthy air days now
- 3 days/yr
- Unhealthy air days in 30 yrs
- 4 days/yr
Risk factors via First Street. Map © Google.
Why this score? — see what drove the A- grade
The composite is a weighted blend of 9 inputs, each scored 0–100. Each bar is that input's sub-score; the figure is the points it added to the 100-point composite (weight × sub-score).
- Cash flow +30.0/30.0
- ARV discount +15.0/15.0
- DSCR +10.0/10.0
- 1% rule +8.9/10.0
- Appreciation +3.8/10.0
- Schools +3.8/10.0
- Livability +3.6/5.0
- Rent growth +2.5/5.0
- Condition / age +2.5/5.0
$399,900
🖨 Deal sheet 📄 Offer letter ✓ Due diligence
Multi-family units
County records classify this as Multi-Family (2-4 Unit). Listing-text estimate: 1 unit. estimate disagrees with records
Listing remarks MLS
Lg 3 Fm Home In Quiet Resid Area Of Seymour Great Investment Or Owner Occupied Let Tenants Pay Your Morgage Needs Some Cosmetics Over 2500 Sq Ft
Key facts
- 7,405 sq ft lot
- Built 1900
- Listed 5 days
Property features AI
Finance
- Financial info: Assessed value listed (public record)
Exterior
- Utilities: Public water connected; Public sewer connected
- Home design: Multi-family property (3-family)
- Construction: Frame construction; Asphalt shingle roof; Concrete and stone foundation; Built living area per public record: 2612
- Exterior features: City views; Located in a historic district; Vinyl siding
Interior
- Kitchen: No specific kitchen appliance list provided
- Bedrooms: 6 bedrooms
- Bathrooms: 3 full bathrooms
- Heating & cooling: Window AC units; Baseboard and hot air heating; Hot water by electric (30 and 40 gallon tanks) and oil; fuel tank located in basement
- Interior features: 18 total rooms; Full, unfinished basement with interior access and hatchway
- Laundry & utility: Each unit has its own washer and dryer hookups (Hook-up in Unit 1, Unit 2, Unit 3)
Neighborhood map
What this means for you Summary
Snapshot
- This is a 5-bed/3.0-bath multifamily listed at $400k.
Deal economics
- At list price, monthly cash flow is $2k ($19k/yr) — positive.
- The deal already cash-flows at list — no discount required.
- Meets the 1% rule at list price ($6k rent vs $400k).
- Cap rate 11.0% vs local median 3.8% in Ansonia — top-decile yield for the area; either an underpriced asset or a hidden risk that comps aren't pricing in. Stress-test before assuming the spread holds.
Location & tenants
- Location reads 71/100 on livability (#87 in CT) — a middle-class / working-renter tenant base. Strengths: crime A+, health & safety A+, housing A-; Watch: employment C-, schools F, amenities F.
- Seymour School District (suburban): math 34% / reading 50% proficiency, ranked #93 of 153 in CT (top 61%) — families likely to look elsewhere, expect single-tenant / working-renter base with shorter leases; only 19% free/reduced lunch — higher-income household profile.
- Market conditions: 55 active listings in the ZIP; 1 comparable units currently listed for rent nearby; solid renter incomes; 502 units permitted in Naugatuck Valley Planning Region in 2024 (171 in 5+ unit buildings).
- At $5,547/mo this rent would consume 62% of the median local household income ($108k/yr) (locally 221% of renters already pay >50% of income on rent) — very limited rent-growth headroom before tenants either downsize or default.
Forward outlook
- Local home prices are declining (-2.4%/yr); year-one equity from $3k of loan paydown is wiped out by about $10k of value loss. Plan a longer hold.
- At projected returns (-2.4% appreciation + 3.0% rent growth), your $112k cash investment doubles in ~7 years — after that, you're playing with house money.
Negotiation context
- Only 5 days on market — expect competitive offers; lowballing is unlikely to land.
- 2 sale attempts since 23y ago with the ask held roughly flat each time — persistent listings suggest the price (not the market) is what's stuck; bring a comps-based counter.
- Current owner paid $200k; list at $400k implies a 100% gain — meaningful room to come down on a strong offer.
Risks & watch-outs
- Watch-outs: built in 1900 — expect roof / HVAC / electrical / plumbing capex.
- Climate carrying-cost: major wind risk, 27% chance of damaging wind over 30y; extreme-heat days projected 7→17/yr by 2055 (HVAC capex compounding) — expect insurance premiums to compound above CPI over the hold.
Questions for the listing agent
- Built in 1900 — when were the roof, HVAC, electrical panel, plumbing, and water heater last replaced?
- Is there a deadline driving the sale (1031 exchange, divorce, estate, relocation)? That informs how much negotiation room exists.
- Schools are F-rated, which usually means shorter tenancies and higher turnover. Who's the typical renter profile here, and what's been the actual vacancy rate?
- What's the average days-on-market for RENTAL listings here right now (not sales)? A rising rental-DOM trend means longer vacancies and softer asking-rent achievability than the comps imply.
- What's the recent tenant-quality profile in this submarket — average credit score on applications, eviction rate, late-payment / NSF rate, and stable-employment percentage? A property-management company in the area should have these aggregated.
- How much new apartment / multifamily construction is in the pipeline within 1–3 miles? Heavy new supply (>2% of stock underway) typically softens rents 12–24 months out; light construction supports rent growth.
Investment metrics
- 1% rule
- 1.39% ✓
- Cap rate
- 11.03%
- Cash-on-cash
- 16.91%
- DSCR
- 1.75
- GRM
- 6.0
CMA / ARV
- ARV (median comp)
- $482,246
- List price
- $399,900
- Delta
- -17.08%
- Verdict
- UNDERPRICED
- Comps
- 20 within 1.0 mi
Show comp detail 7 sales within ~0.75 mi
| Address | Dist | Beds/Ba | Sqft | Sold | Price | $/sf | Match |
|---|---|---|---|---|---|---|---|
| 87 Washington Ave | 0.09mi | 5/2.5 | 2,784 (+9%) | 12mo | $635,000 | $228 | 69 |
| 77 Washington Ave | 0.12mi | 6/3.0 (+1) | 2,800 (+10%) | 11mo | $565,000 | $202 | 64 |
| 202 W Church St | 0.65mi | 4/3.0 (-1) | 2,560 (+0%) | 7mo | $568,000 | $222 | 58 |
| 14 Washington Ave | 0.31mi | 5/2.5 | 2,194 (-14%) | 9mo | $435,000 | $198 | 53 |
| 22 Hull Pl | 0.38mi | 6/3.0 (+1) | 2,838 (+11%) | 12mo | $460,000 | $162 | 49 |
| 79 Meadow St | 0.50mi | 5/2.0 | 2,336 (-8%) | 14mo | $355,100 | $152 | 47 |
| 32-34 Maple St | 0.41mi | 6/2.5 (+1) | 2,250 (-12%) | 10mo | $514,000 | $228 | 46 |
Match score weights: distance 35% · size 25% · config 20% · recency 20%. Top-matched comps best support the ARV.
Projected returns pro-forma
-2.41% appreciation · 3.0% rent growth · sell at horizon
- IRR
- 10.0%
- Equity multiple
- 1.41×
- Total profit
- $45,719
- Equity at exit
- $70,169
- IRR
- 18.1%
- Equity multiple
- 2.59×
- Total profit
- $178,317
- Equity at exit
- $52,961
Cash invested: $111,972 (down + closing). Projections, not guarantees.
Landlord ↔ Tenant lean methodology
- Overall (STATE)
- 27 Tenant-Leaning
- State Connecticut
- 27 Tenant-Leaning · D+7
- County
- — inherits STATE
- City
- — inherits STATE
ZIP-level market 06483
- Home prices YoY
- -0.8%
- Active inventory
- 55
- Price-to-rent
- 18.0×
Monthly cashflow live
- Estimated rent
- $5,547 high interval (Pro) →
- Mortgage (P&I)
- −$2,097
- Tax from tax record
- −$540 /mo · $6,485/yr
- Insurance
- −$167
- HOA
- −$0
- Vacancy / Maint / Mgmt
- −$1,165
- Net cashflow
- $1,578
Break-even live
3-unit breakdown (identical units grouped — click to expand)
| Units | Beds | Baths | Est. rent |
|---|---|---|---|
| 3× units | 2 | 1 | $5,547 |
| #1 | 2 | 1 | $1,849 |
| #2 | 2 | 1 | $1,849 |
| #3 | 2 | 1 | $1,849 |
| Total (3 units) | $5,547 | ||
UW: 25.0% down · 7.5% · 30yr · 1.5% tax · 5.0% vac · 8.0% maint · 8.0% mgmt
Financing live
Cash to close
- Down payment
- $99,975
- Closing costs
- $11,997
- Reserves months
- —
- Total cash needed
- —
Loan-product check · same deal, 3 products live
Conventional
25% down · 7.5% · 30yr
- Down + closing
- —
- Monthly P&I
- —
- Monthly cashflow
- —
- DSCR
- —
- Eligible?
- —
Personal DTI + credit; lowest rate.
DSCR
20% down · 8.5% · 30yr
- Down + closing
- —
- Monthly P&I
- —
- Monthly cashflow
- —
- DSCR
- —
- Eligible?
- —
No personal income docs; deal must DSCR.
Hard money
10% down · 12.0% · 12mo
- Down + closing
- —
- Monthly P&I
- —
- Monthly cashflow
- —
- DSCR
- —
- Eligible?
- —
Short-term bridge; refi at stabilization.
Rent comps 1 comps
| Address | Beds | Baths | Sqft | Rent | $/sqft | DOM | Units | Dist |
|---|---|---|---|---|---|---|---|---|
| 11 Skokorat St Seymour, CT | 5.0 | 3.5 | 2589 | $4,000 | $1.54 | 2d | 1 | 0.82mi |
Listing history 6 events
-
2026-05-13status Under Contract 679-char remark
-
2026-05-09$399,900 Active 679-char remark
-
2026-05-06historical $399,900 679-char remark
-
2003-06-20soldstatus $200,000 150-char remark
Show marketing remark (150 chars)
Lg 3 Fm Home In Quiet Resid Area Of Seymour Great Investment Or Owner Occupied Let Tenants Pay Your Morgage Needs Some Cosmetics Over 2500 Sq Ft
-
2003-05-19$225,000 150-char remark
Show marketing remark (150 chars)
Lg 3 Fm Home In Quiet Resid Area Of Seymour Great Investment Or Owner Occupied Let Tenants Pay Your Morgage Needs Some Cosmetics Over 2500 Sq Ft
-
1992-11-02soldstatus $138,500
ⓘ Source: listings_history table (triggers on properties + properties_extension) + one-shot
backfill from property_details.listing_events for pre-trigger history.
Tax reassessment forecast CT · Partial reset (capped growth)
- Current annual tax
- $6,485 · $540/mo
- Projected year-2 tax
- $7,521 · $627/mo
- Expected delta
- +$1,036/yr (+$86/mo · 16.0%)
ⓘ Screening estimate from a state-policy table — verify with the county assessor before closing.
Climate risk First Street
- Flood 1/10 Low FEMA zone X (unshaded) · 0% chance over 30 yrs
- Wildfire 1/10 Low
- Heat 6/10 Major 7 d/yr ≥97°F today · 17 d/yr by 30 yrs out
- Wind 6/10 Major 27% chance of damaging wind over 30 yrs
- Air quality 3/10 Moderate 3 unhealthy d/yr today · 4 by 30 yrs out
Nearby sold comps map
Loading sold comps map…
Walkable amenities ~0.75 mi
Loading nearby amenities…
Taxation est. · year 1
- Rental income
- $66,564
- − Mortgage interest
- −$22,401
- − Property taxes
- −$6,485
- − Insurance
- −$2,000
- − Repairs & maintenance
- −$5,325
- − Management
- −$5,325
- − Depreciation
- −$11,633
- Taxable income
- $13,395
- Est. tax owed @ 24.0%
- −$3,215
- After-tax cash flow
- $15,721/yr
For passive investors: Depreciation is non-cash, so a rental often shows a tax loss while cash-flowing — sheltering income. Rental losses are passive: they offset passive income freely, and up to $25,000/yr can offset ordinary (W-2) income if you actively participate and your MAGI is under $100k (phasing out to $0 by $150k); unused losses carry forward. On sale, claimed depreciation is recaptured at up to 25%, and gains may owe capital-gains tax (a 1031 exchange can defer both). Figures are a year-1 estimate at your 24.0% rate — not tax advice; consult a CPA.
Schools (NCES district)
- District
- Seymour School District
- NCES district ID
- 0903990
- Math proficiency
- 34% ▼ -13.00%
- Reading proficiency
- 50% ▼ -5.00%
- Median HH income
- $71,700
- Composite
- 38.17/100
- National rank
- #4263
- State rank
- #93 of 153 in CT
Livability — Ansonia
- Score
- 71/100
- State rank
- #87
- US rank
- #6938
Category grades
Schools grade is shown separately in the Schools card above.
Census & demographics
- County
- New Haven County · 688,236 people
- City population
- 19,315
- Metro
- New Haven-Milford, CT
- Population (ZIP)
- 16,889
- Household income
- $107,708
- Rent vs Own
- Severe rent burden
- 221.0
Population outlook (Naugatuck Valley County) Hauer SSP2
- By 2040
- 496,846
Race, ethnicity, and origin ACS 2023
- Neighborhood character
- Predominantly White (67%)
- Race & ethnicity
- White 67% Hispanic / Latino 19% Two or more races 16% Black 7% Asian 2%
- Hispanic origin (detail)
- Mexican 2% Puerto Rican 12%
- Common ancestry
- Romanian 9% Scotch-Irish 3% Lithuanian 2%
- Foreign-born
- 11% · Canada, Dominican Republic
- Languages at home
- 83% English-only · Spanish 10% Russian/Polish/Slavic 3% Other Indo-European 3%
Political lean MEDSL · Naugatuck Valley
- 2024 margin
- Lean R (+7.4) · D 45.6% · R 53.0% · Other 1.4%
- All cycles
- 2024: R+7.4
Not yet ingested
- Civics
- —
Market trends
- HPI YoY
- ▼ -2.41%
- Current HPI
- 294.2705
- Rent YoY
- —
- Metro
- New Haven-Milford, CT
- State GDP YoY
- ▲ 1.06%
- F500 in state
- 38
Industry mix (Fortune 500 HQ in CT)
| Industry | F500 HQs | Revenue |
|---|---|---|
| Industrial Machinery | 4 | $38B |
|
||
| Insurance | 3 | $71B |
|
||
| Financial Services | 2 | $25B |
|
||
| Transportation / Logistics | 2 | $18B |
|
||
| Healthcare | 1 | $247B |
|
||
| Telecommunications | 1 | $55B |
|
||
Price history
+188.7% since first listed6 events — show timeline
- 2026-05-13 Pending — Smart MLS
- 2026-05-09 Listed $399,900 Smart MLS
- 2026-05-06 Coming Soon $399,900 Smart MLS
- 2003-06-20 Sold (MLS) $200,000 Smart MLS
- 2003-05-19 Listed $225,000 Smart MLS
- 1992-11-02 Sold (Public Records) $138,500 Public Records
Property tax history
+1.7%/yrLatest (2023): $6,485 · +1.1% YoY. Source: county tax records.
Cash-flow waterfall
monthlySold comps — $/sqft
last 12 mo · ≤1 miLoading sold comps…