2415 Kruse Loop · Avilla, AR
Flood risk 1/10 · Minimal
- FEMA flood zone
- X (unshaded)
- Chance of flooding over 30 yrs
- 0.0%
- Est. flood insurance / yr
- $507 – $1,088
Fire risk 6/10 · Moderate
- Est. fire insurance / yr
- $1,499 – $2,785
Heat risk 6/10 · Moderate
- Hot days now (above 111°F)
- 7 days/yr
- Hot days in 30 yrs
- 19 days/yr
Wind risk 4/10 · Minor
- Chance of severe wind over 30 yrs
- 10.0%
Air-quality risk 2/10 · Minimal
- Unhealthy air days now
- 0 days/yr
- Unhealthy air days in 30 yrs
- 1 days/yr
Risk factors via First Street. Map © Google.
Why this score? — see what drove the B- grade
The composite is a weighted blend of 9 inputs, each scored 0–100. Each bar is that input's sub-score; the figure is the points it added to the 100-point composite (weight × sub-score).
- Cash flow +29.1/30.0
- DSCR +10.0/10.0
- ARV discount +7.5/15.0
- 1% rule +6.9/10.0
- Schools +4.2/10.0
- Livability +3.2/5.0
- Rent growth +2.5/5.0
- Condition / age +2.5/5.0
- Appreciation +0.0/10.0
$149,900
🖨 Deal sheet (PDF) 📄 Offer letter ✓ Due diligence
Listing remarks
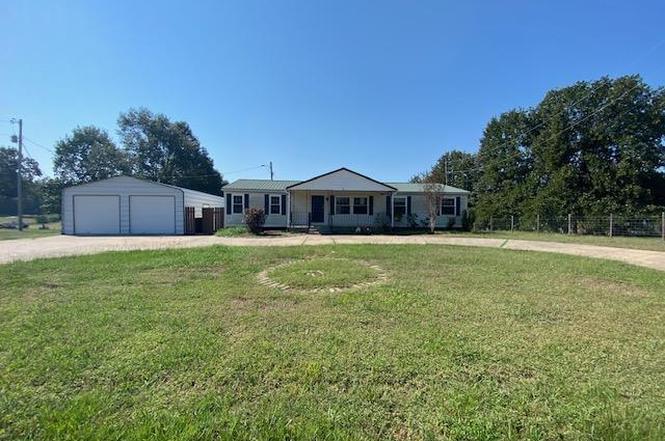
Large spacious 4 bedroom 3 bathroom home with formal dining, 2 living areas with decorative fireplace and huge 24x45 shop with basement under home. 2 primary bedrooms with full baths. Plenty of room to entertain guest with huge living room with large deck off double doors. See Agent remarks before showing.
Key facts
- 0.4 acre lot
- Built 2004
- Listed 238 days
Property features AI
Finance
- Financial info: Financing options may include conventional loans, cash, or other methods (see remarks)
Exterior
- Parking: Parking pads
- Utilities: Public water; Municipal electric service; Propane gas; Insulated windows; Insulated doors; Other utilities (see remarks)
- Home design: Manufactured home; Metal/vinyl siding
- Construction: Metal roof; Crawl space foundation
- Exterior features: Patio; Deck; Porch; Shop; Paved road access; Sloped lot
Interior
- Kitchen: Free-standing stove; Microwave; Dishwasher
- Flooring: Carpet; Vinyl
- Bathrooms: 3 full bathrooms
- Heating & cooling: Central electric heat; Central electric cooling
- Interior features: Walk-in closets; Ceiling fans; Decorative/non-functional fireplace
Neighborhood map
What this means for you Summary
Snapshot
- This is a 4-bed/3.0-bath manufactured listed at $150k.
Deal economics
- At list price, monthly cash flow is $516 ($6k/yr) — positive.
- The deal already cash-flows at list — no discount required.
- Meets the 1% rule at list price ($2k rent vs $150k).
- Recommended offer: $132k (12.0% below list) — sets the bar for market timing.
- Cap rate 10.4% vs local median 2.6% in Avilla — top-decile yield for the area; either an underpriced asset or a hidden risk that comps aren't pricing in. Stress-test before assuming the spread holds.
Location & tenants
- Location reads 65/100 on livability (#146 in AR) — a middle-class / working-renter tenant base. Strengths: crime A+, employment A+, housing A+; Watch: schools D, amenities F, commute F.
- Bryant School District (suburban): math 49% / reading 48% proficiency, ranked #16 of 238 in AR (top 7%) — families likely to look elsewhere, expect single-tenant / working-renter base with shorter leases.
- Market conditions: 184 active listings in the ZIP; 446 units permitted in Saline County in 2024 (0 in 5+ unit buildings).
Forward outlook
- Local home prices are declining (-3.0%/yr); year-one equity from $1k of loan paydown is wiped out by about $4k of value loss. Plan a longer hold.
- Saline County population projected at +39% by 2050 — long-run rental-demand tailwind backs the buy-and-hold thesis.
- At projected returns (-3.0% appreciation + 3.0% rent growth), your $42k cash investment doubles in ~8 years — after that, you're playing with house money.
Negotiation context
- It's been on market 238 days — a 12% lower offer ($132k) is reasonable based on typical stale-listing flexibility.
- 6 sale attempts since 9y ago; this cycle's ask has dropped $50k (25%) from the opening price — seller is motivated, your offer sets the floor, not the list.
Risks & watch-outs
- Climate carrying-cost: major wildfire risk; extreme-heat days projected 7→19/yr by 2055 (HVAC capex compounding) — expect insurance premiums to compound above CPI over the hold.
Questions for the listing agent
- It's been on market 238 days. Have you received any prior offers? Is the seller open to a 12% concession, seller financing, or rate buy-down credit?
- Why hasn't it sold? Are there any deal-killer items the seller is aware of (foundation, flood, title, zoning, code violations)?
- Is there a deadline driving the sale (1031 exchange, divorce, estate, relocation)? That informs how much negotiation room exists.
- Schools are D-rated, which usually means shorter tenancies and higher turnover. Who's the typical renter profile here, and what's been the actual vacancy rate?
- What's the average days-on-market for RENTAL listings here right now (not sales)? A rising rental-DOM trend means longer vacancies and softer asking-rent achievability than the comps imply.
- What's the recent tenant-quality profile in this submarket — average credit score on applications, eviction rate, late-payment / NSF rate, and stable-employment percentage? A property-management company in the area should have these aggregated.
- How much new for-sale + rental construction is in the pipeline within 1–3 miles? Heavy new supply typically softens prices + rents 12–24 months out; constrained supply supports both.
Investment metrics
- 1% rule
- 1.19% ✓
- Cap rate
- 10.43%
- Cash-on-cash
- 14.76%
- DSCR
- 1.66
- GRM
- 7.0
CMA / ARV
No comps found within radius.
Projected returns pro-forma
-3.0% appreciation · 3.0% rent growth · sell at horizon
- IRR
- 5.2%
- Equity multiple
- 1.20×
- Total profit
- $8,526
- Equity at exit
- $22,351
- IRR
- 14.6%
- Equity multiple
- 2.18×
- Total profit
- $49,507
- Equity at exit
- $12,961
Cash invested: $41,972 (down + closing). Projections, not guarantees.
Landlord ↔ Tenant lean methodology
- Overall (STATE)
- 92 Strongly Landlord-Friendly
- State Arkansas
- 92 Strongly Landlord-Friendly · R+14
- County
- — inherits STATE
- City
- — inherits STATE
ZIP-level market 72002
- Home prices YoY
- -11.0%
- Active inventory
- 184
- Price-to-rent
- 7.0×
Monthly cashflow live
- Estimated rent
- $1,781 medium interval (Pro) →
- Mortgage (P&I)
- −$786
- Tax from tax record
- −$42 /mo · $509/yr
- Insurance
- −$62
- HOA
- −$0
- Vacancy / Maint / Mgmt
- −$374
- Net cashflow
- $516
Break-even live
Sensitivity live
| Price | -10% $601 | -5% $559 | +0% $516 | +5% $474 | +10% $431 |
|---|---|---|---|---|---|
| Rent | -10% $376 | -5% $446 | +0% $516 | +5% $587 | +10% $657 |
| Rate | -1.0pp $592 | -0.5pp $554 | base $516 | +0.5pp $477 | +1.0pp $438 |
UW: 25.0% down · 7.5% · 30yr · 1.5% tax · 5.0% vac · 8.0% maint · 8.0% mgmt
Financing live
Cash to close
- Down payment
- $37,475
- Closing costs
- $4,497
- Reserves months
- —
- Total cash needed
- —
Loan-product check · same deal, 3 products live
Conventional
25% down · 7.5% · 30yr
- Down + closing
- —
- Monthly P&I
- —
- Monthly cashflow
- —
- DSCR
- —
- Eligible?
- —
Personal DTI + credit; lowest rate.
DSCR
20% down · 8.5% · 30yr
- Down + closing
- —
- Monthly P&I
- —
- Monthly cashflow
- —
- DSCR
- —
- Eligible?
- —
No personal income docs; deal must DSCR.
Hard money
10% down · 12.0% · 12mo
- Down + closing
- —
- Monthly P&I
- —
- Monthly cashflow
- —
- DSCR
- —
- Eligible?
- —
Short-term bridge; refi at stabilization.
Listing history 32 events
-
2026-06-18days on market $149,900 Active 238 DOM
-
2026-06-17days on market $149,900 Active 237 DOM
-
2026-06-16days on market $149,900 Active 236 DOM
-
2026-06-15days on market $149,900 Active 235 DOM
-
2026-06-14days on market $149,900 Active 233 DOM
-
2026-06-13days on market $149,900 Active 232 DOM
-
2026-06-10statusdays on market $149,900 Active 230 DOM
-
2026-06-09days on market $149,900 Price Change 229 DOM
-
2026-06-08days on market $149,900 Price Change 228 DOM
-
2026-06-07days on market $149,900 Price Change 227 DOM
-
2026-06-05days on market $149,900 Price Change 224 DOM
-
2026-06-03pricestatus $149,900 Price Change 223 DOM
-
2026-05-31days on market $174,500 Active 223 DOM
-
2026-05-31days on market $174,500 Active 222 DOM
-
2026-01-10price $174,500
-
2025-10-20historical
-
2025-10-20$179,900 New Listing
-
2025-10-20historical
-
2025-10-20$199,900 Price Change
-
2025-10-19$199,900 New Listing
-
2022-01-14soldstatus $183,500
-
2022-01-07soldstatus $183,500 Sold
-
2021-11-20status Under Contract
-
2021-11-08$179,900 New Listing
-
2018-05-24status Under Contract
-
2018-05-02soldstatus $132,600
-
2018-04-30soldstatus $132,600 Sold
-
2018-03-22historical Take Backups
-
2018-01-20$138,500 New Listing
-
2018-01-06historical
-
2017-11-09price $155,000
-
2017-10-06$164,900 New Listing
ⓘ Source: listings_history table (triggers on properties + properties_extension) + one-shot
backfill from property_details.listing_events for pre-trigger history.
Tax reassessment forecast AR · Resets to sale price
- Current annual tax
- $509 · $42/mo
- Projected year-2 tax
- $959 · $80/mo
- Expected delta
- +$451/yr (+$38/mo · 88.6%)
ⓘ Screening estimate from a state-policy table — verify with the county assessor before closing.
Climate risk First Street
- Flood 1/10 Low FEMA zone X (unshaded) · 0% chance over 30 yrs
- Wildfire 6/10 Major
- Heat 6/10 Major 7 d/yr ≥111°F today · 19 d/yr by 30 yrs out
- Wind 4/10 Moderate 10% chance of damaging wind over 30 yrs
- Air quality 2/10 Low 0 unhealthy d/yr today · 1 by 30 yrs out
Nearby sold comps map
Loading sold comps map…
Walkable amenities ~0.75 mi
Loading nearby amenities…
Taxation est. · year 1
- Rental income
- $21,375
- − Mortgage interest
- −$8,397
- − Property taxes
- −$509
- − Insurance
- −$750
- − Repairs & maintenance
- −$1,710
- − Management
- −$1,710
- − Depreciation
- −$4,361
- Taxable income
- $3,939
- Est. tax owed @ 24.0%
- −$945
- After-tax cash flow
- $5,249/yr
For passive investors: Depreciation is non-cash, so a rental often shows a tax loss while cash-flowing — sheltering income. Rental losses are passive: they offset passive income freely, and up to $25,000/yr can offset ordinary (W-2) income if you actively participate and your MAGI is under $100k (phasing out to $0 by $150k); unused losses carry forward. On sale, claimed depreciation is recaptured at up to 25%, and gains may owe capital-gains tax (a 1031 exchange can defer both). Figures are a year-1 estimate at your 24.0% rate — not tax advice; consult a CPA.
Schools (NCES district)
- District
- Bryant School District
- NCES district ID
- 0503690
- Math proficiency
- 49% ▼ -13.00%
- Reading proficiency
- 48% ▼ -8.00%
- Median HH income
- $57,578
- Composite
- 42.28/100
- National rank
- #3266
- State rank
- #16 of 238 in AR
Livability — Avilla
- Score
- 65/100
- State rank
- #146
- US rank
- #12711
Category grades
Schools grade is shown separately in the Schools card above.
Census & demographics
- Population (ZIP)
- 21,386
Population outlook (Saline County) Hauer SSP2
- Today (2025)
- 140,141 people
- By 2030
- 151,233 · +7.9%
- By 2040
- 173,100 · +23.5%
- By 2050
- 194,368 · +38.7%
- By 2075
- 245,295 · +75.0%
- By 2100
- 279,117 · +99.2%
Race, ethnicity, and origin ACS 2023
- Neighborhood character
- Majority White (65%)
- Race & ethnicity
- White 65% Black 20% Hispanic / Latino 10% Two or more races 7%
- Hispanic origin (detail)
- Mexican 5%
- Common ancestry
- Slovak 3% Lithuanian 2% Serbian 1%
- Foreign-born
- 6% · Canada
- Languages at home
- 91% English-only · Spanish 8%
Political lean MEDSL · Saline
- 2024 margin
- Solid R (+40.1) · D 28.8% · R 69.0% · Other 2.2%
- 2008→2024 swing
- +0.8pp no change · 2008: -41.0pp · 2024: -40.1pp
- All cycles
- 2024: R+40.1 2020: R+41.2 2016: R+43.5 2012: R+42.7 2008: R+41.0
Not yet ingested
- Civics
- —
Market trends
- HPI YoY
- ▼ -27.89%
- Current HPI
- 226.2889
- Rent YoY
- —
- Metro
- —
- State GDP YoY
- ▲ 3.80%
- F500 in state
- 10
Industry mix (Fortune 500 HQ in AR)
| Industry | F500 HQs | Revenue |
|---|---|---|
| Retail | 1 | $681B |
|
||
| Food / Agriculture | 1 | $53B |
|
||
| Retail / Energy | 1 | $22B |
|
||
| Transportation / Logistics | 1 | $12B |
|
||
| Energy | 1 | $4B |
|
||
Price history
+5.8% since first listed18 events — show timeline
- 2026-01-10 Price Changed $174,500 CARMLS
- 2025-10-20 Listed $199,900 CARMLS
- 2025-10-20 Listing Removed — CARMLS
- 2025-10-20 Listed $179,900 CARMLS
- 2025-10-20 Listing Removed — CARMLS
- 2025-10-19 Listed $199,900 CARMLS
- 2022-01-14 Sold (Public Records) $183,500 Public Records
- 2022-01-07 Sold (MLS) $183,500 CARMLS
- 2021-11-20 Pending — CARMLS
- 2021-11-08 Listed $179,900 CARMLS
- 2018-05-24 Pending — CARMLS
- 2018-05-02 Sold (Public Records) $132,600 Public Records
- 2018-04-30 Sold (MLS) $132,600 CARMLS
- 2018-03-22 Contingent — CARMLS
- 2018-01-20 Listed $138,500 CARMLS
- 2018-01-06 Listing Removed — CARMLS
- 2017-11-09 Price Changed $155,000 CARMLS
- 2017-10-06 Listed $164,900 CARMLS
Property tax history
+0.6%/yrLatest (2025): $509 · -16.4% YoY. Source: county tax records.
Cash-flow waterfall
monthlySold comps — $/sqft
last 12 mo · ≤1 miLoading sold comps…