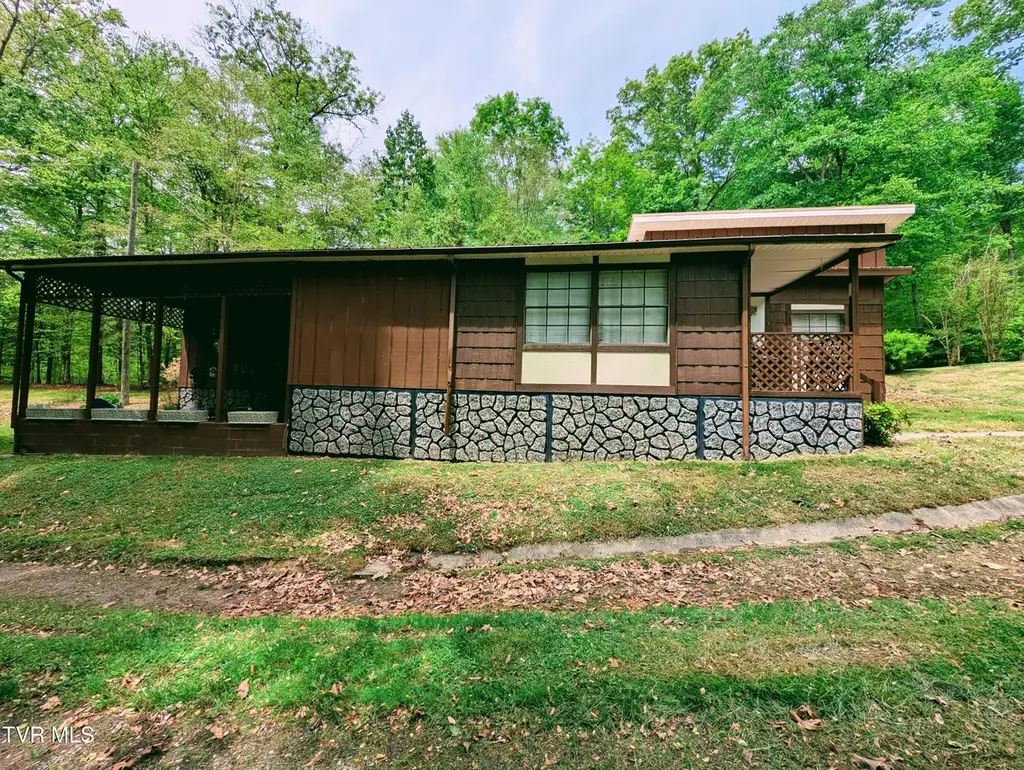
380 Hospital Dr · Clintwood, VA
Flood risk No data
- FEMA flood zone
- —
- Chance of flooding over 30 yrs
- —
- Est. flood insurance / yr
- —
Fire risk No data
- Est. fire insurance / yr
- —
Heat risk No data
- Hot days now (above threshold)
- —
- Hot days in 30 yrs
- —
Wind risk No data
- Chance of severe wind over 30 yrs
- —
Air-quality risk No data
- Unhealthy air days now
- —
- Unhealthy air days in 30 yrs
- —
Risk factors via First Street. Map © Google.
Why this score? — see what drove the B grade
The composite is a weighted blend of 9 inputs, each scored 0–100. Each bar is that input's sub-score; the figure is the points it added to the 100-point composite (weight × sub-score).
- Cash flow +25.8/30.0
- ARV discount +9.6/15.0
- DSCR +8.6/10.0
- Appreciation +7.2/10.0
- 1% rule +5.6/10.0
- Schools +5.1/10.0
- Livability +3.8/5.0
- Rent growth +2.5/5.0
- Condition / age +2.5/5.0
$98,500
🖨 Deal sheet 📄 Offer letter ✓ Due diligence
Listing remarks
Check out this beautifully maintained 3 bedroom, 2 bath home situated on a private 3.5 acre parcel just minutes from town and conveniently located above the local hospital. Offering the perfect combination of privacy and convenience, this property provides a peaceful setting while remaining close to everyday amenities. The home has been exceptionally well cared for and is truly move-in ready. Even better, the property will convey fully furnished, making this an outstanding turnkey opportunity for a primary residence, vacation home, or investment property. All information to be verified by all buyers and buyer's agents as it was gathered from public records. Subject to Errors and Omissions.
Key facts
- 3.5 acre lot
- Built 1975
- Listed 6 days
Property features AI
Finance
- Other: Lot approximately 3.5 acres; Zoned residential
Exterior
- Utilities: Public water; Septic tank sewer
- Home design: Manufactured house (single wide); Residential single-family property
- Construction: Metal roof; Manufactured construction
- Exterior features: Metal roof; Cleared, level, mountainous and sloped terrain
Interior
- Kitchen: Range; Refrigerator; Dishwasher not listed
- Bathrooms: 2 full bathrooms
- Heating & cooling: Electric heating; Window unit cooling
- Interior features: Dryer, Washer, Range, Refrigerator; 6 total rooms
- Laundry & utility: Washer and Dryer
Neighborhood map
What this means for you Summary
Snapshot
- This is a 3-bed/2.0-bath single-family listed at $98k.
Deal economics
- At list price, monthly cash flow is $238 ($3k/yr) — positive.
- The deal already cash-flows at list — no discount required.
- Meets the 1% rule at list price ($1k rent vs $98k).
Location & tenants
- Location reads 75/100 on livability (#131 in VA, #4,220 nationally) — a middle-class / working-renter tenant base. Strengths: crime A+, cost of living A+, housing A; Watch: amenities F, commute F, employment F.
- Dickenson County Public School District (rural): math 59% / reading 66% proficiency, ranked #58 of 131 in VA (top 44%) — acceptable for families but not a draw, mixed tenant base, ~2y average lease.
- Zoned schools: Ridgeview Middle (math 57% / reading 72%, grade A-, #123 of 342 statewide, top 37%, 440 students, 89% FRL); Ridgeview High (math 62% / reading 72%, grade B, #185 of 319 statewide, top 61%, 592 students, 89% FRL) — zoned schools average 89% FRL vs 52% district-wide (37 pts higher); higher-poverty schools than district average — tighter screening recommended.
- Market conditions: 34 active listings in the ZIP; 11 units permitted in Dickenson County in 2024 (0 in 5+ unit buildings).
Forward outlook
- In year one you build about $5k of equity ($681 loan paydown + $4k appreciation (4.3% local appreciation)).
- Dickenson County population projected at -30% by 2050 — secular population decline; favor cash flow + early exit over multi-decade hold.
- At projected returns (4.3% appreciation + 3.0% rent growth), your $28k cash investment doubles in ~4 years — after that, you're playing with house money.
- By year 7, paydown + projected appreciation supports a ~$31k cash-out refi (75% LTV) — recoverable capital for the next deal without selling this one.
Negotiation context
- Only 6 days on market — expect competitive offers; lowballing is unlikely to land.
Questions for the listing agent
- Built in 1975 — when were the roof, HVAC, electrical panel, plumbing, and water heater last replaced?
- Is there a deadline driving the sale (1031 exchange, divorce, estate, relocation)? That informs how much negotiation room exists.
- Schools are B-rated — typically a magnet for longer-tenancy family renters. What's the average tenant stay here, and is there a school-zone premium baked into asking?
- What's the average days-on-market for RENTAL listings here right now (not sales)? A rising rental-DOM trend means longer vacancies and softer asking-rent achievability than the comps imply.
- What's the recent tenant-quality profile in this submarket — average credit score on applications, eviction rate, late-payment / NSF rate, and stable-employment percentage? A property-management company in the area should have these aggregated.
- How much new for-sale + rental construction is in the pipeline within 1–3 miles? Heavy new supply typically softens prices + rents 12–24 months out; constrained supply supports both.
Investment metrics
- 1% rule
- 1.06% ✓
- Cap rate
- 9.19%
- Cash-on-cash
- 10.33%
- DSCR
- 1.46
- GRM
- 7.9
CMA / ARV
- ARV (median comp)
- $103,310
- List price
- $98,500
- Delta
- -4.66%
- Verdict
- FAIR
- Comps
- 9 within 1.0 mi
Show comp detail 2 sales within ~0.75 mi
| Address | Dist | Beds/Ba | Sqft | Sold | Price | $/sf | Match |
|---|---|---|---|---|---|---|---|
| 800 Main St | 0.57mi | 2/1.0 (-1) | 1,198 (-7%) | 2mo | $125,000 | $104 | 52 |
| 220 Friend St | 0.66mi | 3/1.5 | 1,397 (+9%) | 19mo | $163,000 | $117 | 37 |
Match score weights: distance 35% · size 25% · config 20% · recency 20%. Top-matched comps best support the ARV.
Projected returns pro-forma
4.31% appreciation · 3.0% rent growth · sell at horizon
- IRR
- 20.2%
- Equity multiple
- 2.23×
- Total profit
- $33,960
- Equity at exit
- $51,747
- IRR
- 20.4%
- Equity multiple
- 4.32×
- Total profit
- $91,483
- Equity at exit
- $86,109
Cash invested: $27,580 (down + closing). Projections, not guarantees.
Landlord ↔ Tenant lean methodology
- Overall (STATE)
- 55 Moderately Landlord-Leaning
- State Virginia
- 55 Moderately Landlord-Leaning · D+2
- County
- — inherits STATE
- City
- — inherits STATE
ZIP-level market 24228
- Home prices YoY
- 3.2%
- Active inventory
- 34
- Price-to-rent
- 7.9×
Monthly cashflow live
- Estimated rent
- $1,044 medium interval (Pro) →
- Mortgage (P&I)
- −$517
- Tax from tax record
- −$30 /mo · $356/yr
- Insurance
- −$41
- HOA
- −$0
- Vacancy / Maint / Mgmt
- −$219
- Net cashflow
- $238
Break-even live
UW: 25.0% down · 7.5% · 30yr · 1.5% tax · 5.0% vac · 8.0% maint · 8.0% mgmt
Financing live
Cash to close
- Down payment
- $24,625
- Closing costs
- $2,955
- Reserves months
- —
- Total cash needed
- —
Loan-product check · same deal, 3 products live
Conventional
25% down · 7.5% · 30yr
- Down + closing
- —
- Monthly P&I
- —
- Monthly cashflow
- —
- DSCR
- —
- Eligible?
- —
Personal DTI + credit; lowest rate.
DSCR
20% down · 8.5% · 30yr
- Down + closing
- —
- Monthly P&I
- —
- Monthly cashflow
- —
- DSCR
- —
- Eligible?
- —
No personal income docs; deal must DSCR.
Hard money
10% down · 12.0% · 12mo
- Down + closing
- —
- Monthly P&I
- —
- Monthly cashflow
- —
- DSCR
- —
- Eligible?
- —
Short-term bridge; refi at stabilization.
Listing history 2 events
-
2026-05-13status Pending 698-char remark
-
2026-05-06$98,500 Active 698-char remark
ⓘ Source: listings_history table (triggers on properties + properties_extension) + one-shot
backfill from property_details.listing_events for pre-trigger history.
Tax reassessment forecast VA · Resets to sale price
- Current annual tax
- $356 · $30/mo
- Projected year-2 tax
- $808 · $67/mo
- Expected delta
- +$452/yr (+$38/mo · 126.8%)
ⓘ Screening estimate from a state-policy table — verify with the county assessor before closing.
Nearby sold comps map
Loading sold comps map…
Walkable amenities ~0.75 mi
Loading nearby amenities…
Taxation est. · year 1
- Rental income
- $12,528
- − Mortgage interest
- −$5,518
- − Property taxes
- −$356
- − Insurance
- −$492
- − Repairs & maintenance
- −$1,002
- − Management
- −$1,002
- − Depreciation
- −$2,865
- Taxable income
- $1,292
- Est. tax owed @ 24.0%
- −$310
- After-tax cash flow
- $2,540/yr
For passive investors: Depreciation is non-cash, so a rental often shows a tax loss while cash-flowing — sheltering income. Rental losses are passive: they offset passive income freely, and up to $25,000/yr can offset ordinary (W-2) income if you actively participate and your MAGI is under $100k (phasing out to $0 by $150k); unused losses carry forward. On sale, claimed depreciation is recaptured at up to 25%, and gains may owe capital-gains tax (a 1031 exchange can defer both). Figures are a year-1 estimate at your 24.0% rate — not tax advice; consult a CPA.
Schools (NCES district)
- District
- Dickenson County Public School District
- NCES district ID
- 5101140
- Math proficiency
- 59% ▼ -31.00%
- Reading proficiency
- 66% ▼ -17.00%
- Median HH income
- $30,649
- Composite
- 51.28/100
- National rank
- #1749
- State rank
- #58 of 131 in VA
Livability — Clintwood
- Score
- 75/100
- State rank
- #131
- US rank
- #4220
Category grades
Schools grade is shown separately in the Schools card above.
Census & demographics
- Population (ZIP)
- 6,336
Population outlook (Dickenson County) Hauer SSP2
- Today (2025)
- 13,554 people
- By 2030
- 12,680 · -6.4%
- By 2040
- 11,016 · -18.7%
- By 2050
- 9,562 · -29.5%
- By 2075
- 6,712 · -50.5%
- By 2100
- 4,554 · -66.4%
Race, ethnicity, and origin ACS 2023
- Neighborhood character
- Predominantly White (98%)
- Race & ethnicity
- White 98% Black 1%
- Common ancestry
- Serbian 3% Italian 2% Slovak 1%
- Foreign-born
- 0% · Canada
Political lean MEDSL · Dickenson
- 2024 margin
- Solid R (+62.2) · D 18.7% · R 80.9%
- 2008→2024 swing
- -61.5pp toward R · 2008: -0.7pp · 2024: -62.2pp
- All cycles
- 2024: R+62.2 2020: R+58.1 2016: R+56.2 2012: R+26.2 2008: R+0.7
Not yet ingested
- Civics
- —
Market trends
- HPI YoY
- ▲ 4.31%
- Current HPI
- 140.6944
- Rent YoY
- —
- Metro
- —
- State GDP YoY
- ▲ 2.40%
- F500 in state
- 50
Industry mix (Fortune 500 HQ in VA)
| Industry | F500 HQs | Revenue |
|---|---|---|
| Aerospace / Defense | 4 | $236B |
|
||
| Technology / Defense | 3 | $32B |
|
||
| Financial Services | 2 | $176B |
|
||
| Utilities | 2 | $27B |
|
||
| Insurance | 2 | $25B |
|
||
| Technology | 2 | $15B |
|
||
Price history
2 events — show timeline
- 2026-05-13 Pending — TVRMLS
- 2026-05-06 Listed $98,500 TVRMLS
Property tax history
+1.6%/yrLatest (2026): $356 · +0.0% YoY. Source: county tax records.
Cash-flow waterfall
monthlySold comps — $/sqft
last 12 mo · ≤1 miLoading sold comps…