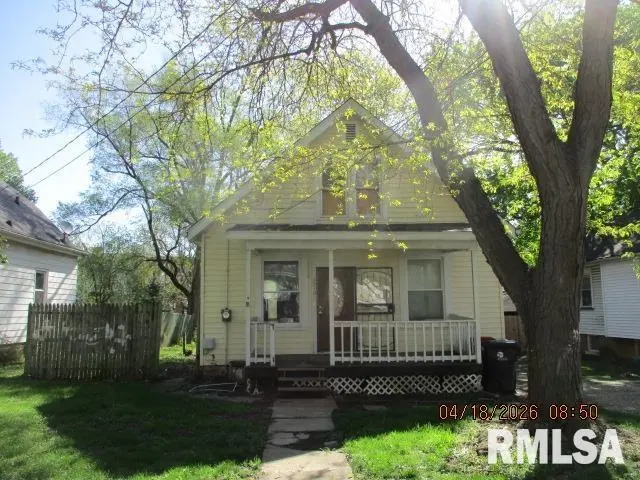
2710 N California Ave · Peoria, IL
Flood risk 3/10 · Minor
- FEMA flood zone
- X
- Chance of flooding over 30 yrs
- 0.1%
- Est. flood insurance / yr
- $473 – $860
Fire risk 1/10 · Minimal
- Est. fire insurance / yr
- $804 – $1,492
Heat risk 3/10 · Minor
- Hot days now (above 105°F)
- 7 days/yr
- Hot days in 30 yrs
- 18 days/yr
Wind risk 2/10 · Minimal
- Chance of severe wind over 30 yrs
- 1.0%
Air-quality risk 3/10 · Minor
- Unhealthy air days now
- 1 days/yr
- Unhealthy air days in 30 yrs
- 3 days/yr
Risk factors via First Street. Map © Google.
Why this score? — see what drove the C- grade
The composite is a weighted blend of 9 inputs, each scored 0–100. Each bar is that input's sub-score; the figure is the points it added to the 100-point composite (weight × sub-score).
- Cash flow +15.0/30.0
- ARV discount +15.0/15.0
- 1% rule +5.0/10.0
- DSCR +5.0/10.0
- Livability +3.7/5.0
- Rent growth +3.4/5.0
- Condition / age +2.5/5.0
- Schools +1.1/10.0
- Appreciation +0.0/10.0
$24,900
🖨 Deal sheet 📄 Offer letter ✓ Due diligence
Listing remarks MLS
Two bedroom one bath Bungalow. Have to walk through main floor bedroom to get the upstairs bedroom. All information is considered estimated taken from tax records or prior MLS she. Property being sold as is what you see is what you get. EMD 10% cash 1% Financed or 1k minimum whichever is greater. Please be advised the Seller has verbally accepted an offer on this property.
Key facts
- 6,400 sq ft lot
- Parking
- Built 1930
Neighborhood map
What this means for you Summary
Snapshot
- This is a 2-bed/1.0-bath single-family listed at $25k.
Deal economics
- At list price, monthly cash flow is $609 ($7k/yr) — positive.
- The deal already cash-flows at list — no discount required.
- Meets the 1% rule at list price ($1k rent vs $25k).
- Recommended offer: $25k (1.5% below list) — sets the bar for market timing.
- Cap rate 35.6% vs local median 5.6% in Peoria — top-decile yield for the area; either an underpriced asset or a hidden risk that comps aren't pricing in. Stress-test before assuming the spread holds.
Location & tenants
- Location reads 73/100 on livability (#270 in IL) — a middle-class / working-renter tenant base. Strengths: commute A+, cost of living A+, housing A+; Watch: employment D+, schools F, crime F.
- Peoria SD 150 (urban): math 11% / reading 14% proficiency, ranked #554 of 620 in IL (top 89%) — low school quality limits family demand, transient renter base, plan for 1-2y turnover; 70% free/reduced lunch — lower-income household profile, screen leases tightly.
- Market conditions: Rents rising (+3.5%/yr); 104 active listings in the ZIP; 24 comparable units currently listed for rent nearby; rentals leasing fast (median 13d on market — plan ~1-2 weeks tenant-placement turnaround); lower-income renter base — watch delinquency; 73 units permitted in Peoria County in 2024 (0 in 5+ unit buildings).
- This rent runs 30% of the median local income ($42k/yr) — at the standard rent-burdened threshold; future hikes will face affordability resistance.
Forward outlook
- Local home prices are declining (-3.0%/yr); year-one equity from $172 of loan paydown is wiped out by about $747 of value loss. Plan a longer hold.
- Peoria County population projected at -11% by 2050 — secular population decline; favor cash flow + early exit over multi-decade hold.
- At projected returns (-3.0% appreciation + 3.5% rent growth), your $7k cash investment doubles in ~2 years — after that, you're playing with house money.
Negotiation context
- It's been on market 19 days — a 2% lower offer ($25k) is reasonable based on typical stale-listing flexibility.
- 3 sale attempts since 20y ago with the ask held roughly flat each time — persistent listings suggest the price (not the market) is what's stuck; bring a comps-based counter.
Risks & watch-outs
- Watch-outs: property tax is 3.6% of price; built in 1930 — expect roof / HVAC / electrical / plumbing capex.
Questions for the listing agent
- Built in 1930 — when were the roof, HVAC, electrical panel, plumbing, and water heater last replaced?
- Property tax is high relative to price — has the assessment been appealed recently, and will the sale trigger a re-assessment?
- Is there a deadline driving the sale (1031 exchange, divorce, estate, relocation)? That informs how much negotiation room exists.
- Schools are F-rated, which usually means shorter tenancies and higher turnover. Who's the typical renter profile here, and what's been the actual vacancy rate?
- Crime grade is F in this area — have there been break-ins, vandalism, or insurance claims at this property in the last 3 years? What carrier currently insures it and at what premium?
- What's the average days-on-market for RENTAL listings here right now (not sales)? A rising rental-DOM trend means longer vacancies and softer asking-rent achievability than the comps imply.
- What's the recent tenant-quality profile in this submarket — average credit score on applications, eviction rate, late-payment / NSF rate, and stable-employment percentage? A property-management company in the area should have these aggregated.
- How much new for-sale + rental construction is in the pipeline within 1–3 miles? Heavy new supply typically softens prices + rents 12–24 months out; constrained supply supports both.
Investment metrics
- 1% rule
- 4.19% ✓
- Cap rate
- 35.63%
- Cash-on-cash
- 104.79%
- DSCR
- 5.66
- GRM
- 2.0
CMA / ARV
- ARV (median comp)
- $43,419
- List price
- $24,900
- Delta
- -42.65%
- Verdict
- UNDERPRICED
- Comps
- 20 within 1.0 mi
Show comp detail 12 sales within ~0.75 mi
| Address | Dist | Beds/Ba | Sqft | Sold | Price | $/sf | Match |
|---|---|---|---|---|---|---|---|
| 2804 N Peoria Ave | 0.13mi | 2/1.0 | 768 (-1%) | 3mo | $60,000 | $78 | 89 |
| 516 E Maywood Ave | 0.15mi | 3/1.0 (+1) | 768 (-1%) | 7mo | $37,500 | $49 | 80 |
| 2809 N California Ave | 0.06mi | 1/1.0 (-1) | 856 (+10%) | 3mo | $25,000 | $29 | 73 |
| 600 E Virginia Ave | 0.18mi | 1/1.0 (-1) | 720 (-7%) | 4mo | $59,900 | $83 | 71 |
| 720 E Gift Ave | 0.21mi | 2/1.0 | 700 (-10%) | 6mo | $72,500 | $104 | 68 |
| 713 E Gift Ave | 0.17mi | 2/1.0 | 676 (-13%) | 7mo | $56,500 | $84 | 65 |
| 2318 N Flora Ave | 0.71mi | 2/1.0 | 768 (-1%) | 2mo | $90,000 | $117 | 63 |
| 1217 E Melbourne Ave | 0.68mi | 2/1.0 | 760 (-2%) | 8mo | $62,500 | $82 | 58 |
| 511 E Pasadena Ave | 0.49mi | 2/1.0 | 840 (+8%) | 6mo | $83,000 | $99 | 58 |
| 209 E Corrington Ave | 0.20mi | 3/1.0 (+1) | 884 (+14%) | 7mo | $72,100 | $82 | 57 |
| 1004 E Gift Ave | 0.44mi | 2/1.0 | 872 (+12%) | 8mo | $25,000 | $29 | 53 |
| 400 W Corrington Ave | 0.53mi | 2/1.0 | 888 (+14%) | 4mo | $43,000 | $48 | 48 |
Match score weights: distance 35% · size 25% · config 20% · recency 20%. Top-matched comps best support the ARV.
Projected returns pro-forma
-3.0% appreciation · 3.49% rent growth · sell at horizon
- IRR
- —
- Equity multiple
- 6.06×
- Total profit
- $35,301
- Equity at exit
- $3,713
- IRR
- —
- Equity multiple
- 12.90×
- Total profit
- $82,986
- Equity at exit
- $2,153
Cash invested: $6,972 (down + closing). Projections, not guarantees.
Landlord ↔ Tenant lean methodology
- Overall (STATE)
- 43 Moderately Tenant-Leaning
- State Illinois
- 43 Moderately Tenant-Leaning · D+7
- County
- — inherits STATE
- City
- — inherits STATE
ZIP-level market 61603
- Home prices YoY
- -31.8%
- Rents YoY
- 3.5%
- Active inventory
- 104
- Price-to-rent
- 2.0×
Monthly cashflow live
- Estimated rent
- $1,044 high interval (Pro) →
- Mortgage (P&I)
- −$131
- Tax from tax record
- −$75 /mo · $900/yr
- Insurance
- −$10
- HOA
- −$0
- Vacancy / Maint / Mgmt
- −$219
- Net cashflow
- $609
Break-even live
UW: 25.0% down · 7.5% · 30yr · 1.5% tax · 5.0% vac · 8.0% maint · 8.0% mgmt
Financing live
Cash to close
- Down payment
- $6,225
- Closing costs
- $747
- Reserves months
- —
- Total cash needed
- —
Loan-product check · same deal, 3 products live
Conventional
25% down · 7.5% · 30yr
- Down + closing
- —
- Monthly P&I
- —
- Monthly cashflow
- —
- DSCR
- —
- Eligible?
- —
Personal DTI + credit; lowest rate.
DSCR
20% down · 8.5% · 30yr
- Down + closing
- —
- Monthly P&I
- —
- Monthly cashflow
- —
- DSCR
- —
- Eligible?
- —
No personal income docs; deal must DSCR.
Hard money
10% down · 12.0% · 12mo
- Down + closing
- —
- Monthly P&I
- —
- Monthly cashflow
- —
- DSCR
- —
- Eligible?
- —
Short-term bridge; refi at stabilization.
Rent comps 24 comps
| Address | Beds | Baths | Sqft | Rent | $/sqft | DOM | Units | Dist |
|---|---|---|---|---|---|---|---|---|
| 737 E Gift Ave Unit 737 Peoria, IL | 2.0 | 1.0 | 800 | $1,125 | $1.41 | 43d | 1 | 0.26mi |
| 2121 N Prospect Rd Peoria, IL | 3.0 | 1.0 | 946 | $802 | $0.85 | 13d | 1 | 0.80mi |
| 2207 N Ellis St Peoria, IL | 2.0 | 1.0 | 864 | $999 | $1.16 | 13d | 1 | 0.84mi |
| 812 W Macqueen Ave Peoria, IL | 2.0 | 1.0 | 822 | $795 | $0.97 | 43d | 1 | 0.92mi |
| 905 W Thrush Ave Peoria, IL | 2.0 | 1.0 | 750 | $950 | $1.27 | 20d | 1 | 1.03mi |
| 903 W Brons Ave Peoria, IL | 3.0 | 1.0 | 971 | $995 | $1.02 | 43d | 1 | 1.05mi |
| 1505 N Peoria Ave Peoria, IL | 1.0 | 1.0 | 525 | $1,006 | $1.92 | 13d | 4 | 1.09mi |
| 3108 N Parish Ave Peoria, IL | 3.0 | 1.5 | 967 | $1,750 | $1.81 | 43d | 1 | 1.11mi |
| 901 NE Glen Oak Ave Unit 2 Peoria, IL | 3.0 | 1.0 | 1120 | $1,200 | $1.07 | 20d | 1 | 1.14mi |
| 2214 N Linsley St Peoria, IL | 2.0 | 1.0 | 575 | $550 | $0.96 | 43d | 1 | 1.17mi |
| 3912 N Atlantic Ave Peoria Heights, IL | 2.0 | 1.0 | 825 | $1,100 | $1.33 | 43d | 1 | 1.17mi |
| 126 E Lake Ave Peoria, IL | 2.0 | 1.0 | 950 | $1,050 | $1.11 | 13d | 9 | 1.26mi |
| W Crestwood Dr Peoria, IL | 1.0–2.0 | 1.0 | 800 | $975 | $1.22 | 13d | 4 | 1.30mi |
| 2023 N Underhill St Peoria, IL | 3.0 | 1.0 | 1050 | $1,200 | $1.14 | 13d | 1 | 1.32mi |
| 506 Caroline St Unit B Peoria, IL | 2.0 | 1.0 | 1000 | $900 | $0.90 | 13d | 1 | 1.33mi |
| 228 E Oak Cliff Ct Unit A2 Peoria, IL | 2.0 | 1.0 | 1000 | $1,050 | $1.05 | 13d | 1 | 1.33mi |
| 811 E Lake Ave Peoria Heights, IL | 2.0 | 1.0 | 576 | $875 | $1.52 | 13d | 1 | 1.34mi |
| 811 W Purtscher Dr Peoria, IL | 3.0 | 1.0 | 864 | $1,100 | $1.27 | 43d | 1 | 1.36mi |
| 2302 NE Monroe St Peoria, IL | 3.0 | 1.0 | 1100 | $875 | $0.80 | 13d | 1 | 1.38mi |
| 813 E Sciota Ave Peoria Heights, IL | 2.0 | 2.0 | 800 | $1,400 | $1.75 | 13d | 1 | 1.41mi |
| 249 E Oak Cliff Ct Unit 4 Peoria, IL | 2.0 | 1.0 | 600 | $800 | $1.33 | 13d | 1 | 1.42mi |
| 511 W Elizabeth St Unit A Peoria, IL | 1.0 | 1.0 | 850 | $800 | $0.94 | 43d | 1 | 1.45mi |
| 1703 N Valley Ave Peoria, IL | 2.0 | 1.0 | 676 | $1,200 | $1.78 | 13d | 1 | 1.46mi |
| 4020 N Bryer Pl Peoria, IL | 2.0 | 1.0 | 720 | $1,250 | $1.74 | 20d | 1 | 1.49mi |
Listing history 8 events
-
2026-05-11status Pending 375-char remark
Show marketing remark (375 chars)
Two bedroom one bath Bungalow. Have to walk through main floor bedroom to get the upstairs bedroom. All information is considered estimated taken from tax records or prior MLS she. Property being sold as is what you see is what you get. EMD 10% cash 1% Financed or 1k minimum whichever is greater. Please be advised the Seller has verbally accepted an offer on this property.
-
2026-04-21$24,900 Active 375-char remark
Show marketing remark (375 chars)
Two bedroom one bath Bungalow. Have to walk through main floor bedroom to get the upstairs bedroom. All information is considered estimated taken from tax records or prior MLS she. Property being sold as is what you see is what you get. EMD 10% cash 1% Financed or 1k minimum whichever is greater. Please be advised the Seller has verbally accepted an offer on this property.
-
2023-09-20historical
-
2023-08-04Active
-
2006-09-27soldstatus $68,000
-
2006-09-25soldstatus $68,000
-
2006-08-16$65,000
-
2005-06-14soldstatus $54,000
ⓘ Source: listings_history table (triggers on properties + properties_extension) + one-shot
backfill from property_details.listing_events for pre-trigger history.
Tax reassessment forecast IL · Partial reset (capped growth)
- Current annual tax
- $900 · $75/mo
- Projected year-2 tax
- $900 · $75/mo
- Expected delta
- $0/yr ($0/mo · 0.0%)
ⓘ Screening estimate from a state-policy table — verify with the county assessor before closing.
Climate risk First Street
- Flood 3/10 Moderate FEMA zone X · 10% chance over 30 yrs
- Wildfire 1/10 Low
- Heat 3/10 Moderate 7 d/yr ≥105°F today · 18 d/yr by 30 yrs out
- Wind 2/10 Low 100% chance of damaging wind over 30 yrs
- Air quality 3/10 Moderate 1 unhealthy d/yr today · 3 by 30 yrs out
Nearby sold comps map
Loading sold comps map…
Walkable amenities ~0.75 mi
Loading nearby amenities…
Taxation est. · year 1
- Rental income
- $12,528
- − Mortgage interest
- −$1,395
- − Property taxes
- −$900
- − Insurance
- −$124
- − Repairs & maintenance
- −$1,002
- − Management
- −$1,002
- − Depreciation
- −$724
- Taxable income
- $7,380
- Est. tax owed @ 24.0%
- −$1,771
- After-tax cash flow
- $5,535/yr
For passive investors: Depreciation is non-cash, so a rental often shows a tax loss while cash-flowing — sheltering income. Rental losses are passive: they offset passive income freely, and up to $25,000/yr can offset ordinary (W-2) income if you actively participate and your MAGI is under $100k (phasing out to $0 by $150k); unused losses carry forward. On sale, claimed depreciation is recaptured at up to 25%, and gains may owe capital-gains tax (a 1031 exchange can defer both). Figures are a year-1 estimate at your 24.0% rate — not tax advice; consult a CPA.
Schools (NCES district)
- District
- Peoria SD 150
- NCES district ID
- 1731230
- Math proficiency
- 11% ▼ -5.00%
- Reading proficiency
- 14% ▼ -4.00%
- Median HH income
- $41,951
- Composite
- 10.92/100
- National rank
- #9751
- State rank
- #554 of 620 in IL
Livability — Peoria
- Score
- 73/100
- State rank
- #270
- US rank
- #5096
Category grades
Schools grade is shown separately in the Schools card above.
Census & demographics
- Census place
- Peoria, IL
- County
- Peoria County · 120,495 people
- City population
- 114,670
- Metro
- Peoria, IL
- Population (ZIP)
- 15,356
- Household income
- $41,618
- Rent vs Own
- Severe rent burden
- 849.0
Population outlook (Peoria County) Hauer SSP2
- Today (2025)
- 183,007 people
- By 2030
- 179,643 · -1.8%
- By 2040
- 171,782 · -6.1%
- By 2050
- 163,508 · -10.7%
- By 2075
- 140,178 · -23.4%
- By 2100
- 114,493 · -37.4%
Race, ethnicity, and origin ACS 2023
- Neighborhood character
- Diverse neighborhood (Simpson 0.68)
- Race & ethnicity
- Black 43% White 36% Two or more races 12% Hispanic / Latino 10% Asian 1%
- Hispanic origin (detail)
- Mexican 7%
- Common ancestry
- Italian 2% Slovak 1% Lithuanian 1%
- Foreign-born
- 7% · Canada
- Languages at home
- 91% English-only · Spanish 6% Tagalog/Filipino 1%
Political lean MEDSL · Peoria
- 2024 margin
- Toss-up / Even · D 51.5% · R 46.9% · Other 1.6%
- 2008→2024 swing
- -9.2pp toward R · 2008: 13.9pp · 2024: 4.7pp
- All cycles
- 2024: D+4.7 2020: D+6.3 2016: D+2.8 2012: D+4.4 2008: D+13.9
Not yet ingested
- Civics
- —
Market trends
- HPI YoY
- ▼ -65.98%
- Current HPI
- 141.5343
- Rent YoY
- ▲ 3.49%
- Metro
- Peoria, IL
- State GDP YoY
- ▲ 1.59%
- F500 in state
- 60
Industry mix (Fortune 500 HQ in IL)
| Industry | F500 HQs | Revenue |
|---|---|---|
| Insurance | 4 | $201B |
|
||
| Consumer Goods | 4 | $87B |
|
||
| Industrial Machinery | 3 | $64B |
|
||
| Healthcare | 2 | $55B |
|
||
| Retail / Pharmacy | 1 | $148B |
|
||
| Agriculture / Food | 1 | $86B |
|
||
Price history
-53.9% since first listed8 events — show timeline
- 2026-05-11 Pending — RMLSA as Distributed by MLS Grid
- 2026-04-21 Listed $24,900 RMLSA as Distributed by MLS Grid
- 2023-09-20 Listing Removed — RMLSA as Distributed by MLS Grid
- 2023-08-04 Listed — RMLSA as Distributed by MLS Grid
- 2006-09-27 Sold (Public Records) $68,000 Public Records
- 2006-09-25 Sold (MLS) $68,000 RMLSA as Distributed by MLS Grid
- 2006-08-16 Listed $65,000 RMLSA as Distributed by MLS Grid
- 2005-06-14 Sold (Public Records) $54,000 Public Records
Property tax history
-1.3%/yrLatest (2024): $900 · +10.7% YoY. Source: county tax records.
Cash-flow waterfall
monthlySold comps — $/sqft
last 12 mo · ≤1 miLoading sold comps…