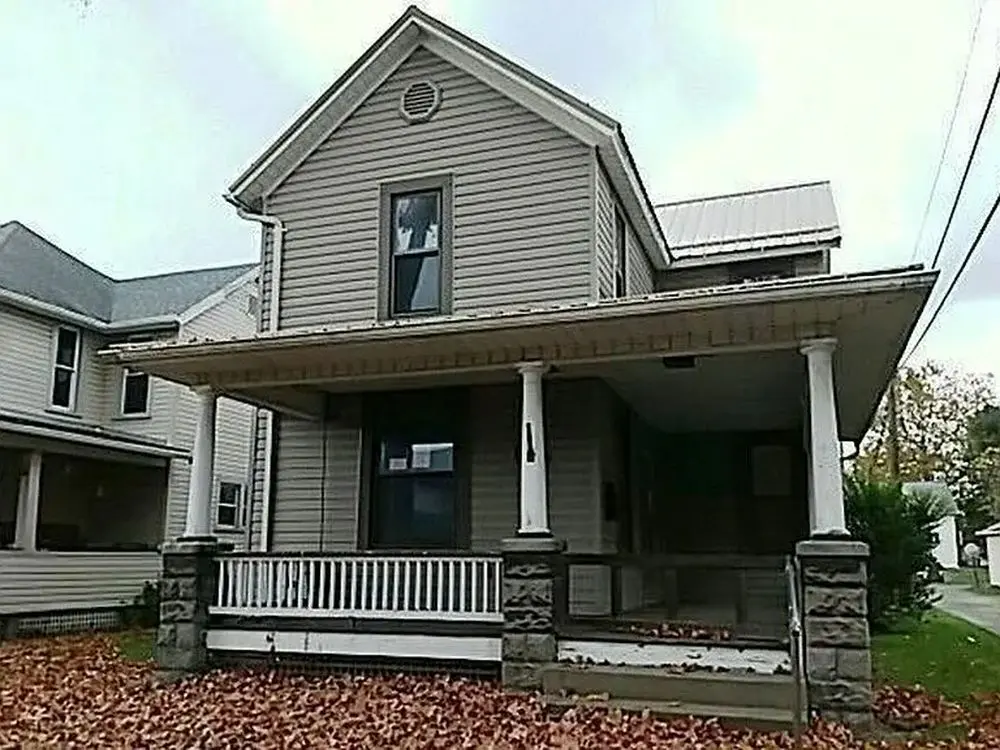
349 N 9th St · Coshocton, OH
Flood risk 1/10 · Minimal
- FEMA flood zone
- X (unshaded)
- Chance of flooding over 30 yrs
- 0.0%
- Est. flood insurance / yr
- $473 – $860
Fire risk 2/10 · Minimal
- Est. fire insurance / yr
- $713 – $1,323
Heat risk 3/10 · Minor
- Hot days now (above 98°F)
- 7 days/yr
- Hot days in 30 yrs
- 18 days/yr
Wind risk 2/10 · Minimal
- Chance of severe wind over 30 yrs
- 0.0%
Air-quality risk 2/10 · Minimal
- Unhealthy air days now
- 1 days/yr
- Unhealthy air days in 30 yrs
- 3 days/yr
Risk factors via First Street. Map © Google.
Why this score? — see what drove the B- grade
The composite is a weighted blend of 9 inputs, each scored 0–100. Each bar is that input's sub-score; the figure is the points it added to the 100-point composite (weight × sub-score).
- Cash flow +25.5/30.0
- ARV discount +15.0/15.0
- DSCR +8.5/10.0
- 1% rule +6.5/10.0
- Schools +3.6/10.0
- Livability +3.5/5.0
- Rent growth +2.5/5.0
- Condition / age +2.5/5.0
- Appreciation +0.0/10.0
$79,500
🖨 Deal sheet 📄 Offer letter ✓ Due diligence
Listing remarks
FOR SALE - Flexible Purchase Option Available - Easy to Own Your Home! Looking for a home but not quite ready for traditional financing? This could be a great opportunity. This home is available as a Lease with Option to Purchase for qualified buyers. 349 S 9th St. , Coshocton, OH 43812 3 Bedrooms | 2 Bathrooms Purchase Price: $79,500 (future purchase price is locked in today!) Requirements: 10% down (non-refundable option fee, will be applied to purchase price at closing). Must be able to qualify for financing within 12 years. Monthly Lease Payment: Only $495! DESIGNED FOR: Those that have the money but not the credit Buyers rebuilding credit Buyers who want a house now but need time
Key facts
- 6,258 sq ft lot
- Built 1920
- Listed 14 days
Property features AI
Exterior
- Home design: House
- Exterior features: Lot approximately 6,258 sq ft
Neighborhood map
What this means for you Summary
Snapshot
- This is a 3-bed/1.0-bath single-family listed at $80k.
Deal economics
- At list price, monthly cash flow is $186 ($2k/yr) — positive.
- The deal already cash-flows at list — no discount required.
- Meets the 1% rule at list price ($915 rent vs $80k).
- Cap rate 9.1% vs local median 3.8% in Coshocton — top-decile yield for the area; either an underpriced asset or a hidden risk that comps aren't pricing in. Stress-test before assuming the spread holds.
Location & tenants
- Location reads 69/100 on livability (#526 in OH) — a middle-class / working-renter tenant base. Strengths: cost of living A+, housing A+, health & safety B+; Watch: crime C-, amenities F, commute F.
- Coshocton City (town): math 39% / reading 49% proficiency, ranked #518 of 656 in OH (top 79%) — families likely to look elsewhere, expect single-tenant / working-renter base with shorter leases; 62% free/reduced lunch — lower-income household profile, screen leases tightly.
- Market conditions: 116 active listings in the ZIP; 2 comparable units currently listed for rent nearby; 7 units permitted in Coshocton County in 2024 (0 in 5+ unit buildings).
Forward outlook
- Local home prices are declining (-3.0%/yr); year-one equity from $550 of loan paydown is wiped out by about $2k of value loss. Plan a longer hold.
- Coshocton County population projected at -18% by 2050 — secular population decline; favor cash flow + early exit over multi-decade hold.
Negotiation context
- Only 14 days on market — expect competitive offers; lowballing is unlikely to land.
- 3 sale attempts since 26y ago with the ask held roughly flat each time — persistent listings suggest the price (not the market) is what's stuck; bring a comps-based counter.
Risks & watch-outs
- Watch-outs: built in 1920 — expect roof / HVAC / electrical / plumbing capex.
Questions for the listing agent
- Built in 1920 — when were the roof, HVAC, electrical panel, plumbing, and water heater last replaced?
- Is there a deadline driving the sale (1031 exchange, divorce, estate, relocation)? That informs how much negotiation room exists.
- What's the average days-on-market for RENTAL listings here right now (not sales)? A rising rental-DOM trend means longer vacancies and softer asking-rent achievability than the comps imply.
- What's the recent tenant-quality profile in this submarket — average credit score on applications, eviction rate, late-payment / NSF rate, and stable-employment percentage? A property-management company in the area should have these aggregated.
- How much new for-sale + rental construction is in the pipeline within 1–3 miles? Heavy new supply typically softens prices + rents 12–24 months out; constrained supply supports both.
Investment metrics
- 1% rule
- 1.15% ✓
- Cap rate
- 9.10%
- Cash-on-cash
- 10.01%
- DSCR
- 1.45
- GRM
- 7.2
CMA / ARV
- ARV (on-the-fly)
- $139,040
- Comps found
- 12
Show comp detail 12 sales within ~0.75 mi
| Address | Dist | Beds/Ba | Sqft | Sold | Price | $/sf | Match |
|---|---|---|---|---|---|---|---|
| 307 N 8th St | 0.13mi | 3/1.0 | 1,585 (+0%) | 10mo | $144,000 | $91 | 85 |
| 935 Orchard St | 0.27mi | 3/1.5 | 1,548 (-2%) | 6mo | $115,500 | $75 | 77 |
| 128 N 12th St | 0.31mi | 3/1.5 | 1,524 (-4%) | 2mo | $98,500 | $65 | 76 |
| 333 S 9th St | 0.51mi | 3/1.0 | 1,588 (+0%) | 2mo | $167,500 | $105 | 73 |
| 1005 Adams St | 0.33mi | 4/2.0 (+1) | 1,588 (+0%) | 4mo | $132,600 | $84 | 71 |
| 349 N 11th St | 0.16mi | 2/1.0 (-1) | 1,479 (-6%) | 7mo | $129,900 | $88 | 70 |
| 336 N 11th St | 0.19mi | 3/1.5 | 1,478 (-6%) | 10mo | $82,400 | $56 | 70 |
| 760 Elm St | 0.54mi | 3/2.0 | 1,648 (+4%) | 7mo | $73,500 | $45 | 58 |
| 391 S 10th St | 0.61mi | 4/1.0 (+1) | 1,498 (-5%) | 1mo | $160,000 | $107 | 57 |
| 1421 Chestnut St | 0.47mi | 4/2.5 (+1) | 1,676 (+6%) | 3mo | $156,000 | $93 | 54 |
| 540 Cambridge Rd | 0.67mi | 4/2.5 (+1) | 1,556 (-2%) | 6mo | $230,000 | $148 | 50 |
| 421 S 7th St | 0.55mi | 3/1.5 | 1,428 (-10%) | 8mo | $39,900 | $28 | 50 |
Match score weights: distance 35% · size 25% · config 20% · recency 20%. Top-matched comps best support the ARV.
Projected returns pro-forma
-3.0% appreciation · 3.0% rent growth · sell at horizon
- IRR
- -1.2%
- Equity multiple
- 0.95×
- Total profit
- $-1,048
- Equity at exit
- $11,854
- IRR
- 8.4%
- Equity multiple
- 1.64×
- Total profit
- $14,342
- Equity at exit
- $6,874
Cash invested: $22,260 (down + closing). Projections, not guarantees.
Landlord ↔ Tenant lean methodology
- Overall (STATE)
- 73 Landlord-Friendly
- State Ohio
- 73 Landlord-Friendly · R+6
- County
- — inherits STATE
- City
- — inherits STATE
ZIP-level market 43812
- Active inventory
- 116
- Price-to-rent
- 7.2×
Monthly cashflow live
- Estimated rent
- $915 medium interval (Pro) →
- Mortgage (P&I)
- −$417
- Tax from tax record
- −$87 /mo · $1,044/yr
- Insurance
- −$33
- HOA
- −$0
- Vacancy / Maint / Mgmt
- −$192
- Net cashflow
- $186
Break-even live
UW: 25.0% down · 7.5% · 30yr · 1.5% tax · 5.0% vac · 8.0% maint · 8.0% mgmt
Financing live
Cash to close
- Down payment
- $19,875
- Closing costs
- $2,385
- Reserves months
- —
- Total cash needed
- —
Loan-product check · same deal, 3 products live
Conventional
25% down · 7.5% · 30yr
- Down + closing
- —
- Monthly P&I
- —
- Monthly cashflow
- —
- DSCR
- —
- Eligible?
- —
Personal DTI + credit; lowest rate.
DSCR
20% down · 8.5% · 30yr
- Down + closing
- —
- Monthly P&I
- —
- Monthly cashflow
- —
- DSCR
- —
- Eligible?
- —
No personal income docs; deal must DSCR.
Hard money
10% down · 12.0% · 12mo
- Down + closing
- —
- Monthly P&I
- —
- Monthly cashflow
- —
- DSCR
- —
- Eligible?
- —
Short-term bridge; refi at stabilization.
Rent comps 2 comps
| Address | Beds | Baths | Sqft | Rent | $/sqft | DOM | Units | Dist |
|---|---|---|---|---|---|---|---|---|
| 925 Walnut St Coshocton, OH | 2.0 | 1.0 | 1096 | $800 | $0.73 | 15d | 1 | 0.38mi |
| 611 Pine St Coshocton, OH | 3.0 | 1.0 | 1277 | $1,100 | $0.86 | 15d | 1 | 0.71mi |
Listing history 11 events
-
2026-06-18days on market $79,500 Active 14 DOM
-
2026-06-17days on market $79,500 Active 13 DOM
-
2026-06-16days on market $79,500 Active 12 DOM
-
2026-06-15days on market $79,500 Active 11 DOM
-
2026-06-13days on market $79,500 Active 9 DOM
-
2026-06-12days on market $79,500 Active 8 DOM
-
2026-06-09days on market $79,500 Active 5 DOM
-
2026-06-08days on market $79,500 Active 4 DOM
-
2026-06-08days on market $79,500 Active 3 DOM
-
2026-06-07remarks 699-char remark
-
2026-06-07$79,500 Active 2 DOM
ⓘ Source: listings_history table (triggers on properties + properties_extension) + one-shot
backfill from property_details.listing_events for pre-trigger history.
Tax reassessment forecast OH · Partial reset (capped growth)
- Current annual tax
- $1,044 · $87/mo
- Projected year-2 tax
- $1,142 · $95/mo
- Expected delta
- +$98/yr (+$8/mo · 9.4%)
ⓘ Screening estimate from a state-policy table — verify with the county assessor before closing.
Climate risk First Street
- Flood 1/10 Low FEMA zone X (unshaded) · 0% chance over 30 yrs
- Wildfire 2/10 Low
- Heat 3/10 Moderate 7 d/yr ≥98°F today · 18 d/yr by 30 yrs out
- Wind 2/10 Low 0% chance of damaging wind over 30 yrs
- Air quality 2/10 Low 1 unhealthy d/yr today · 3 by 30 yrs out
Nearby sold comps map
Loading sold comps map…
Walkable amenities ~0.75 mi
Loading nearby amenities…
Taxation est. · year 1
- Rental income
- $10,979
- − Mortgage interest
- −$4,453
- − Property taxes
- −$1,044
- − Insurance
- −$398
- − Repairs & maintenance
- −$878
- − Management
- −$878
- − Depreciation
- −$2,313
- Taxable income
- $1,014
- Est. tax owed @ 24.0%
- −$243
- After-tax cash flow
- $1,985/yr
For passive investors: Depreciation is non-cash, so a rental often shows a tax loss while cash-flowing — sheltering income. Rental losses are passive: they offset passive income freely, and up to $25,000/yr can offset ordinary (W-2) income if you actively participate and your MAGI is under $100k (phasing out to $0 by $150k); unused losses carry forward. On sale, claimed depreciation is recaptured at up to 25%, and gains may owe capital-gains tax (a 1031 exchange can defer both). Figures are a year-1 estimate at your 24.0% rate — not tax advice; consult a CPA.
Schools (NCES district)
- District
- Coshocton City
- NCES district ID
- 3904382
- Math proficiency
- 39% ▼ -22.00%
- Reading proficiency
- 49% ▼ -10.00%
- Median HH income
- $33,758
- Composite
- 36.22/100
- National rank
- #4726
- State rank
- #518 of 656 in OH
Livability — Coshocton
- Score
- 69/100
- State rank
- #526
- US rank
- #8938
Category grades
Schools grade is shown separately in the Schools card above.
Census & demographics
- Census place
- Coshocton, OH
- County
- Coshocton · 37,075 people
- Population (ZIP)
- 18,716
- Household income
- $51,930
- Rent vs Own
- Severe rent burden
- 7.2
Population outlook (Coshocton County) Hauer SSP2
- Today (2025)
- 35,193 people
- By 2030
- 34,112 · -3.1%
- By 2040
- 31,670 · -10.0%
- By 2050
- 29,033 · -17.5%
- By 2075
- 22,827 · -35.1%
- By 2100
- 16,421 · -53.3%
Race, ethnicity, and origin ACS 2023
- Neighborhood character
- Predominantly White (93%)
- Race & ethnicity
- White 93% Two or more races 5%
- Common ancestry
- Iranian 2% Lithuanian 2% Slovak 2%
- Foreign-born
- 1%
- Languages at home
- 98% English-only · German/W. Germanic 1%
Political lean MEDSL · Coshocton
- 2024 margin
- Solid R (+52.2) · D 23.5% · R 75.7%
- 2008→2024 swing
- -46.4pp toward R · 2008: -5.8pp · 2024: -52.2pp
- All cycles
- 2024: R+52.2 2020: R+49.0 2016: R+43.3 2012: R+9.5 2008: R+5.8
Not yet ingested
- Civics
- —
Market trends
- HPI YoY
- ▼ -188.33%
- Current HPI
- 216.5142
- Rent YoY
- —
- Metro
- —
- State GDP YoY
- ▲ 1.98%
- F500 in state
- 48
Industry mix (Fortune 500 HQ in OH)
| Industry | F500 HQs | Revenue |
|---|---|---|
| Insurance | 3 | $145B |
|
||
| Industrial Machinery | 3 | $49B |
|
||
| Financial Services | 3 | $24B |
|
||
| Consumer Goods | 2 | $93B |
|
||
| Aerospace / Defense | 2 | $47B |
|
||
| Utilities | 2 | $33B |
|
||
Price history
+26.4% since first listed5 events — show timeline
- 2026-06-04 Listed $79,500 ForSaleByOwner.com
- 2002-02-12 Listing Removed — MLSNOW
- 2001-08-14 Listed $57,000 MLSNOW
- 2001-02-05 Listing Removed — MLSNOW
- 2000-07-05 Listed $62,900 MLSNOW
Property tax history
+2.8%/yrLatest (2025): $1,044 · -6.0% YoY. Source: county tax records.
Cash-flow waterfall
monthlySold comps — $/sqft
last 12 mo · ≤1 miLoading sold comps…