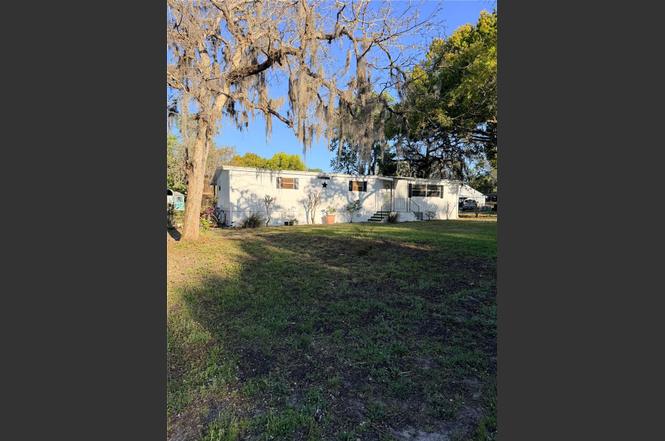
17222 Dansville Dr · Shady Hills, FL
Flood risk 1/10 · Minimal
- FEMA flood zone
- X (unshaded)
- Chance of flooding over 30 yrs
- 0.0%
- Est. flood insurance / yr
- $507 – $1,088
Fire risk 4/10 · Minor
- Est. fire insurance / yr
- $947 – $1,759
Heat risk 10/10 · Severe
- Hot days now (above 108°F)
- 7 days/yr
- Hot days in 30 yrs
- 26 days/yr
Wind risk 10/10 · Severe
- Chance of severe wind over 30 yrs
- 99.0%
Air-quality risk 2/10 · Minimal
- Unhealthy air days now
- 1 days/yr
- Unhealthy air days in 30 yrs
- 2 days/yr
Risk factors via First Street. Map © Google.
Why this score? — see what drove the B- grade
The composite is a weighted blend of 9 inputs, each scored 0–100. Each bar is that input's sub-score; the figure is the points it added to the 100-point composite (weight × sub-score).
- Cash flow +25.9/30.0
- ARV discount +15.0/15.0
- DSCR +8.7/10.0
- 1% rule +5.5/10.0
- Schools +4.3/10.0
- Livability +3.5/5.0
- Rent growth +2.5/5.0
- Condition / age +2.5/5.0
- Appreciation +0.0/10.0
$210,000
🖨 Deal sheet 📄 Offer letter ✓ Due diligence
Listing remarks
Imagine coming home to your own private acre in Spring Hill, complete with a sparkling in-ground pool, soothing spa, and screened enclosure perfect for Florida living. This spacious 3-bedroom, 2-bath offers room to spread out inside and out, plus multiple sheds, a carport, and plenty of outdoor space for hobbies, toys, or even a garden. Inside, enjoy a bright layout with a comfortable living area, roomy kitchen, and inviting bedrooms. Tucked away in a peaceful setting yet close to shops, dining, and schools — this property gives you the best of both worlds. The home was built in 1975. There are some lenders that will finance older mobiles you will have to do your research or it will h
Key facts
- Multiple sheds
- In-ground pool
- Private acre
Tags
Property features AI
Finance
- Other: Lot is approximately 1 acre (dirt road access)
Exterior
- Parking: Carport with 2 spaces
- Utilities: Well water; Septic tank; Electricity connected; Water connected
- Home design: Residential mobile home (double wide); Single-story; Faces west; Homesteaded
- Construction: Other construction materials; Other roof; Slab/other foundation; Building area approximately 2,016 sq ft
- Exterior features: In-ground private pool with spa; Other exterior features
Interior
- Kitchen: Convection oven; Refrigerator
- Bedrooms: 3 bedrooms
- Flooring: Vinyl flooring
- Bathrooms: 2 full bathrooms
- Heating & cooling: Central heating; Central air conditioning
- Interior features: Ceiling fans
- Laundry & utility: Dedicated laundry room
Neighborhood map
What this means for you Summary
Snapshot
- This is a 3-bed/2.0-bath manufactured listed at $210k.
Deal economics
- At list price, monthly cash flow is $513 ($6k/yr) — positive.
- The deal already cash-flows at list — no discount required.
- Meets the 1% rule at list price ($2k rent vs $210k).
- Recommended offer: $185k (12.0% below list) — sets the bar for market timing.
- Cap rate 9.2% vs local median 3.5% in Shady Hills — top-decile yield for the area; either an underpriced asset or a hidden risk that comps aren't pricing in. Stress-test before assuming the spread holds.
Location & tenants
- Location reads 69/100 on livability (#467 in FL) — a middle-class / working-renter tenant base. Strengths: cost of living A+, housing A+; Watch: employment C-, health & safety C-, commute D+.
- Pasco (suburban): math 50% / reading 52% proficiency, ranked #32 of 73 in FL (top 44%) — acceptable for families but not a draw, mixed tenant base, ~2y average lease.
- Market conditions: 252 active listings in the ZIP; 6,765 units permitted in Pasco County in 2024 (1,250 in 5+ unit buildings).
Forward outlook
- Local home prices are declining (-3.0%/yr); year-one equity from $1k of loan paydown is wiped out by about $6k of value loss. Plan a longer hold.
- Pasco County population projected at +29% by 2050 — long-run rental-demand tailwind backs the buy-and-hold thesis.
Negotiation context
- It's been on market 303 days — a 12% lower offer ($185k) is reasonable based on typical stale-listing flexibility.
- 2 sale attempts; this cycle's ask has dropped $145k (41%) from the opening price — seller is motivated, your offer sets the floor, not the list.
Risks & watch-outs
- Climate carrying-cost: severe wind risk, 99% chance of damaging wind over 30y; extreme-heat days projected 7→26/yr by 2055 (HVAC capex compounding) — expect insurance premiums to compound above CPI over the hold.
Questions for the listing agent
- It's been on market 303 days. Have you received any prior offers? Is the seller open to a 12% concession, seller financing, or rate buy-down credit?
- Built in 1975 — when were the roof, HVAC, electrical panel, plumbing, and water heater last replaced?
- Why hasn't it sold? Are there any deal-killer items the seller is aware of (foundation, flood, title, zoning, code violations)?
- Is there a deadline driving the sale (1031 exchange, divorce, estate, relocation)? That informs how much negotiation room exists.
- Schools are F-rated, which usually means shorter tenancies and higher turnover. Who's the typical renter profile here, and what's been the actual vacancy rate?
- What's the average days-on-market for RENTAL listings here right now (not sales)? A rising rental-DOM trend means longer vacancies and softer asking-rent achievability than the comps imply.
- What's the recent tenant-quality profile in this submarket — average credit score on applications, eviction rate, late-payment / NSF rate, and stable-employment percentage? A property-management company in the area should have these aggregated.
- How much new for-sale + rental construction is in the pipeline within 1–3 miles? Heavy new supply typically softens prices + rents 12–24 months out; constrained supply supports both.
Investment metrics
- 1% rule
- 1.05% ✓
- Cap rate
- 9.23%
- Cash-on-cash
- 10.47%
- DSCR
- 1.47
- GRM
- 7.9
CMA / ARV
- ARV (on-the-fly)
- $293,760
- Comps found
- 2
Show comp detail 2 sales within ~0.75 mi
| Address | Dist | Beds/Ba | Sqft | Sold | Price | $/sf | Match |
|---|---|---|---|---|---|---|---|
| 16549 Bosley Dr | 0.46mi | 3/2.0 | 1,296 (-10%) | 12mo | $265,000 | $204 | 51 |
| 16821 Bosley Dr | 0.67mi | 3/2.0 | 1,344 (-7%) | 17mo | $180,000 | $134 | 44 |
Match score weights: distance 35% · size 25% · config 20% · recency 20%. Top-matched comps best support the ARV.
Projected returns pro-forma
-3.0% appreciation · 3.0% rent growth · sell at horizon
- IRR
- -0.6%
- Equity multiple
- 0.98×
- Total profit
- $-1,445
- Equity at exit
- $31,312
- IRR
- 9.0%
- Equity multiple
- 1.69×
- Total profit
- $40,418
- Equity at exit
- $18,157
Cash invested: $58,800 (down + closing). Projections, not guarantees.
Landlord ↔ Tenant lean methodology
- Overall (STATE)
- 87 Strongly Landlord-Friendly
- State Florida
- 87 Strongly Landlord-Friendly · R+3
- County
- — inherits STATE
- City
- — inherits STATE
ZIP-level market 34610
- Home prices YoY
- -13.8%
- Active inventory
- 252
- Price-to-rent
- 7.9×
Monthly cashflow live
- Estimated rent
- $2,210 medium interval (Pro) →
- Mortgage (P&I)
- −$1,101
- Tax from tax record
- −$44 /mo · $526/yr
- Insurance
- −$88
- HOA
- −$0
- Vacancy / Maint / Mgmt
- −$464
- Net cashflow
- $513
Break-even live
UW: 25.0% down · 7.5% · 30yr · 1.5% tax · 5.0% vac · 8.0% maint · 8.0% mgmt
Financing live
Cash to close
- Down payment
- $52,500
- Closing costs
- $6,300
- Reserves months
- —
- Total cash needed
- —
Loan-product check · same deal, 3 products live
Conventional
25% down · 7.5% · 30yr
- Down + closing
- —
- Monthly P&I
- —
- Monthly cashflow
- —
- DSCR
- —
- Eligible?
- —
Personal DTI + credit; lowest rate.
DSCR
20% down · 8.5% · 30yr
- Down + closing
- —
- Monthly P&I
- —
- Monthly cashflow
- —
- DSCR
- —
- Eligible?
- —
No personal income docs; deal must DSCR.
Hard money
10% down · 12.0% · 12mo
- Down + closing
- —
- Monthly P&I
- —
- Monthly cashflow
- —
- DSCR
- —
- Eligible?
- —
Short-term bridge; refi at stabilization.
Listing history 19 events
-
2026-06-18days on market $210,000 Active 303 DOM
-
2026-06-17days on market $210,000 Active 302 DOM
-
2026-06-16days on market $210,000 Active 301 DOM
-
2026-06-15days on market $210,000 Active 300 DOM
-
2026-06-13days on market $210,000 Active 298 DOM
-
2026-06-09days on market $210,000 Active 294 DOM
-
2026-06-08days on market $210,000 Active 293 DOM
-
2026-06-07days on market $210,000 Active 292 DOM
-
2026-06-04days on market $210,000 Active 289 DOM
-
2026-06-03days on market $210,000 Active 288 DOM
-
2026-06-02days on market $210,000 Active 287 DOM
-
2026-06-01days on market $210,000 Active 286 DOM
-
2026-05-31days on market $210,000 Active 285 DOM
-
2026-05-22price $210,000
-
2026-04-11price $225,000
-
2026-01-21status Active
-
2026-01-19status Pending
-
2025-10-11price $250,000
-
2025-08-16$355,000 Active
ⓘ Source: listings_history table (triggers on properties + properties_extension) + one-shot
backfill from property_details.listing_events for pre-trigger history.
Tax reassessment forecast FL · Resets to sale price
- Current annual tax
- $526 · $44/mo
- Projected year-2 tax
- $1,743 · $145/mo
- Expected delta
- +$1,217/yr (+$101/mo · 231.4%)
ⓘ Screening estimate from a state-policy table — verify with the county assessor before closing.
Climate risk First Street
- Flood 1/10 Low FEMA zone X (unshaded) · 0% chance over 30 yrs
- Wildfire 4/10 Moderate
- Heat 10/10 Extreme 7 d/yr ≥108°F today · 26 d/yr by 30 yrs out
- Wind 10/10 Extreme 99% chance of damaging wind over 30 yrs
- Air quality 2/10 Low 1 unhealthy d/yr today · 2 by 30 yrs out
Nearby sold comps map
Loading sold comps map…
Walkable amenities ~0.75 mi
Loading nearby amenities…
Taxation est. · year 1
- Rental income
- $26,518
- − Mortgage interest
- −$11,763
- − Property taxes
- −$526
- − Insurance
- −$1,050
- − Repairs & maintenance
- −$2,121
- − Management
- −$2,121
- − Depreciation
- −$6,109
- Taxable income
- $2,827
- Est. tax owed @ 24.0%
- −$678
- After-tax cash flow
- $5,480/yr
For passive investors: Depreciation is non-cash, so a rental often shows a tax loss while cash-flowing — sheltering income. Rental losses are passive: they offset passive income freely, and up to $25,000/yr can offset ordinary (W-2) income if you actively participate and your MAGI is under $100k (phasing out to $0 by $150k); unused losses carry forward. On sale, claimed depreciation is recaptured at up to 25%, and gains may owe capital-gains tax (a 1031 exchange can defer both). Figures are a year-1 estimate at your 24.0% rate — not tax advice; consult a CPA.
Schools (NCES district)
- District
- Pasco
- NCES district ID
- 1201530
- Math proficiency
- 50% ▼ -10.00%
- Reading proficiency
- 52% ▼ -5.00%
- Median HH income
- $45,039
- Composite
- 43.14/100
- National rank
- #3074
- State rank
- #32 of 73 in FL
Livability — Shady Hills
- Score
- 69/100
- State rank
- #467
- US rank
- #8437
Category grades
Schools grade is shown separately in the Schools card above.
Census & demographics
- Census place
- Shady Hills, FL
- Population (ZIP)
- 16,544
Population outlook (Pasco County) Hauer SSP2
- Today (2025)
- 570,045 people
- By 2030
- 605,844 · +6.3%
- By 2040
- 674,806 · +18.4%
- By 2050
- 736,022 · +29.1%
- By 2075
- 862,900 · +51.4%
- By 2100
- 906,364 · +59.0%
Race, ethnicity, and origin ACS 2023
- Neighborhood character
- Predominantly White (76%)
- Race & ethnicity
- White 76% Hispanic / Latino 17% Two or more races 12% Asian 2% Black 2%
- Hispanic origin (detail)
- Mexican 2% Puerto Rican 4% Cuban 3%
- Common ancestry
- Romanian 3% Serbian 2% Slovak 2%
- Foreign-born
- 11% · Canada, Jamaica, Vietnam
- Languages at home
- 85% English-only · Spanish 12% Other Indo-European 1% Vietnamese 1%
Political lean MEDSL · Pasco
- 2024 margin
- Strong R (+25.2) · D 36.9% · R 62.1% · Other 1.0%
- 2008→2024 swing
- -21.6pp toward R · 2008: -3.6pp · 2024: -25.2pp
- All cycles
- 2024: R+25.2 2020: R+20.1 2016: R+21.6 2012: R+6.7 2008: R+3.6
Not yet ingested
- Civics
- —
Market trends
- HPI YoY
- ▼ -55.13%
- Current HPI
- 342.8714
- Rent YoY
- —
- Metro
- —
- State GDP YoY
- ▲ 3.28%
- F500 in state
- 36
Industry mix (Fortune 500 HQ in FL)
| Industry | F500 HQs | Revenue |
|---|---|---|
| Industrial Technology | 2 | $29B |
|
||
| Insurance | 2 | $17B |
|
||
| Retail | 1 | $60B |
|
||
| Technology Distribution | 1 | $58B |
|
||
| Homebuilding | 1 | $35B |
|
||
| Technology Manufacturing | 1 | $35B |
|
||
Price history
-40.8% since first listed6 events — show timeline
- 2026-05-22 Price Changed $210,000 Stellar MLS as Distributed by MLS Grid
- 2026-04-11 Price Changed $225,000 Stellar MLS as Distributed by MLS Grid
- 2026-01-21 Relisted — Stellar MLS as Distributed by MLS Grid
- 2026-01-19 Pending — Stellar MLS as Distributed by MLS Grid
- 2025-10-11 Price Changed $250,000 Stellar MLS as Distributed by MLS Grid
- 2025-08-16 Listed $355,000 Stellar MLS as Distributed by MLS Grid
Property tax history
+4.2%/yrLatest (2025): $526 · +5.1% YoY. Source: county tax records.
Cash-flow waterfall
monthlySold comps — $/sqft
last 12 mo · ≤1 miLoading sold comps…