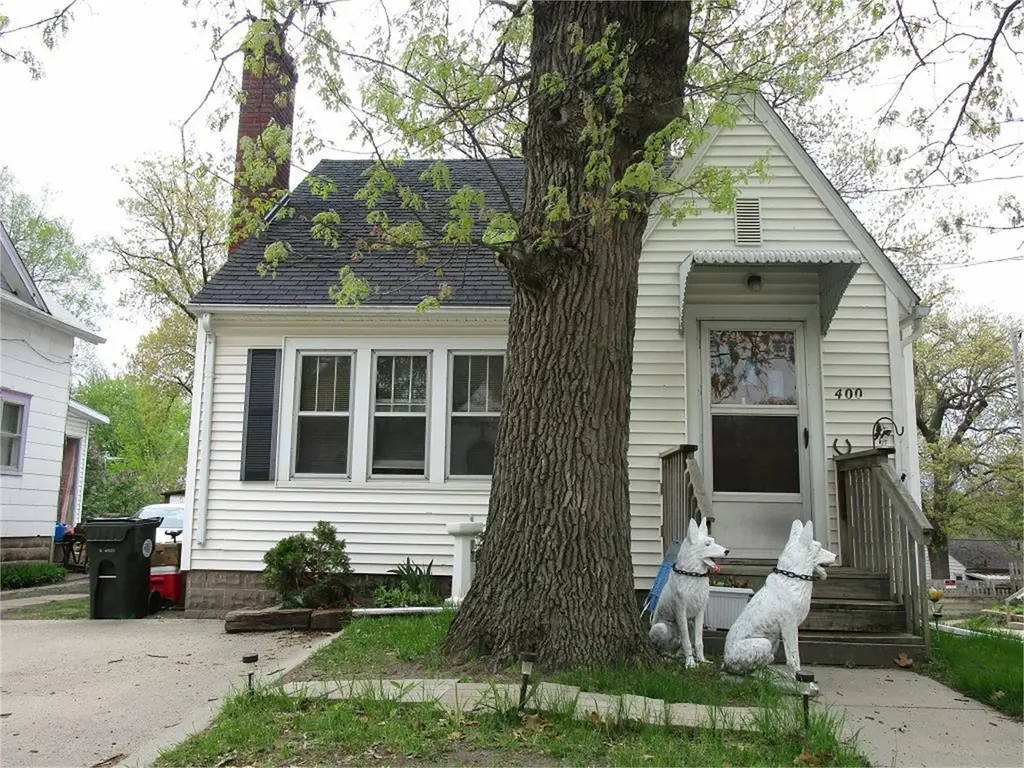
400 Poplar Ave Ave · Waterloo, IA
Flood risk 1/10 · Minimal
- FEMA flood zone
- X
- Chance of flooding over 30 yrs
- 0.0%
- Est. flood insurance / yr
- $473 – $860
Fire risk 2/10 · Minimal
- Est. fire insurance / yr
- $902 – $1,676
Heat risk 3/10 · Minor
- Hot days now (above 101°F)
- 7 days/yr
- Hot days in 30 yrs
- 15 days/yr
Wind risk 2/10 · Minimal
- Chance of severe wind over 30 yrs
- —
Air-quality risk 1/10 · Minimal
- Unhealthy air days now
- 0 days/yr
- Unhealthy air days in 30 yrs
- 0 days/yr
Risk factors via First Street. Map © Google.
Why this score? — see what drove the B grade
The composite is a weighted blend of 9 inputs, each scored 0–100. Each bar is that input's sub-score; the figure is the points it added to the 100-point composite (weight × sub-score).
- Cash flow +25.2/30.0
- ARV discount +15.0/15.0
- DSCR +8.3/10.0
- 1% rule +7.3/10.0
- Schools +4.4/10.0
- Rent growth +4.2/5.0
- Livability +4.0/5.0
- Condition / age +2.5/5.0
- Appreciation +0.0/10.0
$69,900
🖨 Deal sheet 📄 Offer letter ✓ Due diligence
Listing remarks
Whether you’re looking for your first home or a smart investment property, this well-maintained 1 bedroom, 1 bathroom home is full of potential. This charming home offers the perfect blend of comfort, simplicity, and value. Don’t miss your chance to own an affordable property with plenty of possibilities!
Key facts
- 3,200 sq ft lot
- Built 1937
- Listed 7 days
Property features AI
Exterior
- Parking: No designated parking
- Utilities: Public water; Public sewer
- Home design: Single-family residence; One-story
- Construction: Vinyl siding; Asphalt roof; Below-grade finished area (~300)
- Exterior features: Concrete road access; 40 x 80 lot dimensions; Zoned R-1
Interior
- Bathrooms: 1 full bathroom
- Heating & cooling: Central air conditioning; Electric heating
- Interior features: Masonry fireplace; Block basement (finished area below grade)
Neighborhood map
What this means for you Summary
Snapshot
- This is a 1-bed/1.0-bath single-family listed at $70k.
Deal economics
- At list price, monthly cash flow is $156 ($2k/yr) — positive.
- The deal already cash-flows at list — no discount required.
- Meets the 1% rule at list price ($860 rent vs $70k).
- Cap rate 9.0% vs local median 4.2% in Waterloo — top-decile yield for the area; either an underpriced asset or a hidden risk that comps aren't pricing in. Stress-test before assuming the spread holds.
Location & tenants
- Location reads 81/100 on livability (#74 in IA, #1,589 nationally) — a professional / high-income tenant draw. Strengths: commute A+, cost of living A+, housing A+; Watch: crime F, employment D-.
- Waterloo Community School District (urban): math 50% / reading 54% proficiency, ranked #276 of 289 in IA (top 96%) — acceptable for families but not a draw, mixed tenant base, ~2y average lease.
- Zoned schools: Lincoln Elementary School (math 38% / reading 42%, grade F, #576 of 616 statewide, top 94%, 471 students, 86% FRL); George Washington Carver Academy (math 36% / reading 43%, grade F, #240 of 246 statewide, top 98%, 442 students, 91% FRL); East High School (math 39% / reading 58%, grade D, #317 of 336 statewide, top 94%, 1,022 students, 73% FRL) — zoned schools average 83% FRL vs 58% district-wide (25 pts higher); higher-poverty schools than district average — tighter screening recommended.
- Market conditions: Rents rising fast (+6.7%/yr); 98 active listings in the ZIP; 20 comparable units currently listed for rent nearby; rentals lingering (median 44d on market — plan ~5-8 weeks vacancy on turnover, expect pricing pressure); 50% of comp listings sitting > 30 days — soft ceiling on asking rent; 287 units permitted in Black Hawk County in 2024 (67 in 5+ unit buildings).
Forward outlook
- Local home prices are declining (-3.0%/yr); year-one equity from $483 of loan paydown is wiped out by about $2k of value loss. Plan a longer hold.
- Black Hawk County population projected at +10% by 2050 — modest demand growth; plan on rents tracking national, not racing it.
- At projected returns (-3.0% appreciation + 6.7% rent growth), your $20k cash investment doubles in ~8 years — after that, you're playing with house money.
Negotiation context
- Only 8 days on market — expect competitive offers; lowballing is unlikely to land.
- Current owner paid $46k; list at $70k implies a 52% gain — meaningful room to come down on a strong offer.
Risks & watch-outs
- Watch-outs: built in 1937 — expect roof / HVAC / electrical / plumbing capex.
Questions for the listing agent
- Built in 1937 — when were the roof, HVAC, electrical panel, plumbing, and water heater last replaced?
- Is there a deadline driving the sale (1031 exchange, divorce, estate, relocation)? That informs how much negotiation room exists.
- Crime grade is F in this area — have there been break-ins, vandalism, or insurance claims at this property in the last 3 years? What carrier currently insures it and at what premium?
- What's the average days-on-market for RENTAL listings here right now (not sales)? A rising rental-DOM trend means longer vacancies and softer asking-rent achievability than the comps imply.
- What's the recent tenant-quality profile in this submarket — average credit score on applications, eviction rate, late-payment / NSF rate, and stable-employment percentage? A property-management company in the area should have these aggregated.
- How much new for-sale + rental construction is in the pipeline within 1–3 miles? Heavy new supply typically softens prices + rents 12–24 months out; constrained supply supports both.
Investment metrics
- 1% rule
- 1.23% ✓
- Cap rate
- 8.98%
- Cash-on-cash
- 9.58%
- DSCR
- 1.43
- GRM
- 6.8
CMA / ARV
- ARV (on-the-fly)
- $89,864
- Comps found
- 9
Show comp detail 9 sales within ~0.75 mi
| Address | Dist | Beds/Ba | Sqft | Sold | Price | $/sf | Match |
|---|---|---|---|---|---|---|---|
| 1162 Kern Street St | 0.09mi | 2/1.0 (+1) | 941 (-2%) | 4mo | $97,900 | $104 | 85 |
| 1035 Newton St | 0.26mi | 2/1.5 (+1) | 963 (+1%) | 8mo | $95,000 | $99 | 73 |
| 1128 Newton St | 0.18mi | 2/1.0 (+1) | 906 (-5%) | 7mo | $85,000 | $94 | 72 |
| 748 Conger St | 0.58mi | 2/1.0 (+1) | 864 (-10%) | 5mo | $60,000 | $69 | 48 |
| 929 Kern St | 0.37mi | 2/1.0 (+1) | 886 (-7%) | 22mo | $58,000 | $65 | 47 |
| 714 Conger St | 0.66mi | 2/1.0 (+1) | 918 (-4%) | 19mo | $100,000 | $109 | 42 |
| 1111 Burton Ave | 0.33mi | 2/1.0 (+1) | 812 (-15%) | 19mo | $73,500 | $91 | 39 |
| 713 Riehl St | 0.65mi | 2/2.0 (+1) | 836 (-13%) | 1mo | $78,500 | $94 | 39 |
| 725 Riehl St St | 0.63mi | 2/1.0 (+1) | 868 (-9%) | 15mo | $99,900 | $115 | 38 |
Match score weights: distance 35% · size 25% · config 20% · recency 20%. Top-matched comps best support the ARV.
Projected returns pro-forma
-3.0% appreciation · 6.67% rent growth · sell at horizon
- IRR
- 2.5%
- Equity multiple
- 1.10×
- Total profit
- $1,955
- Equity at exit
- $10,422
- IRR
- 15.5%
- Equity multiple
- 2.49×
- Total profit
- $29,243
- Equity at exit
- $6,044
Cash invested: $19,572 (down + closing). Projections, not guarantees.
Landlord ↔ Tenant lean methodology
- Overall (STATE)
- 83 Strongly Landlord-Friendly
- State Iowa
- 83 Strongly Landlord-Friendly · R+6
- County
- — inherits STATE
- City
- — inherits STATE
ZIP-level market 50703
- Rents YoY
- 6.7%
- Active inventory
- 98
- Price-to-rent
- 6.8×
Monthly cashflow live
- Estimated rent
- $860 high interval (Pro) →
- Mortgage (P&I)
- −$367
- Tax from tax record
- −$128 /mo · $1,530/yr
- Insurance
- −$29
- HOA
- −$0
- Vacancy / Maint / Mgmt
- −$181
- Net cashflow
- $156
Break-even live
UW: 25.0% down · 7.5% · 30yr · 1.5% tax · 5.0% vac · 8.0% maint · 8.0% mgmt
Financing live
Cash to close
- Down payment
- $17,475
- Closing costs
- $2,097
- Reserves months
- —
- Total cash needed
- —
Loan-product check · same deal, 3 products live
Conventional
25% down · 7.5% · 30yr
- Down + closing
- —
- Monthly P&I
- —
- Monthly cashflow
- —
- DSCR
- —
- Eligible?
- —
Personal DTI + credit; lowest rate.
DSCR
20% down · 8.5% · 30yr
- Down + closing
- —
- Monthly P&I
- —
- Monthly cashflow
- —
- DSCR
- —
- Eligible?
- —
No personal income docs; deal must DSCR.
Hard money
10% down · 12.0% · 12mo
- Down + closing
- —
- Monthly P&I
- —
- Monthly cashflow
- —
- DSCR
- —
- Eligible?
- —
Short-term bridge; refi at stabilization.
Rent comps 20 comps
| Address | Beds | Baths | Sqft | Rent | $/sqft | DOM | Units | Dist |
|---|---|---|---|---|---|---|---|---|
| 1124 Kern St Waterloo, IA | 2.0 | 1.0 | 740 | $950 | $1.28 | 44d | 1 | 0.13mi |
| 661 Dawson St Waterloo, IA | 2.0 | 1.0 | 704 | $895 | $1.27 | 21d | 1 | 0.66mi |
| 657 Dawson St Waterloo, IA | 2.0 | 1.0 | 692 | $810 | $1.17 | 44d | 1 | 0.67mi |
| 1132 Ackermant St Waterloo, IA | 2.0 | 1.0 | 685 | $825 | $1.20 | 44d | 1 | 1.02mi |
| 1137 Columbia St Waterloo, IA | 1.0 | 1.0 | 588 | $725 | $1.23 | 21d | 1 | 1.06mi |
| 314 Conger St Waterloo, IA | 2.0 | 1.0 | 840 | $875 | $1.04 | 44d | 1 | 1.08mi |
| 1148 Columbia St Waterloo, IA | 2.0 | 1.0 | 816 | $850 | $1.04 | 44d | 1 | 1.08mi |
| 307 Riehl St Waterloo, IA | 2.0 | 1.0 | 640 | $825 | $1.29 | 21d | 1 | 1.09mi |
| 136 Janney Ave Waterloo, IA | 2.0 | 2.0 | 901 | $1,325 | $1.47 | 44d | 1 | 1.12mi |
| 405 W Donald St Waterloo, IA | 2.0–3.0 | 1.0 | 880 | $900 | $1.02 | 21d | 4 | 1.30mi |
| 118 Harrison St Waterloo, IA | 2.0 | 1.0 | 600 | $500 | $0.83 | 44d | 1 | 1.33mi |
| 45 W Jefferson St Waterloo, IA | 1.0–2.0 | 1.0–2.0 | 1062 | $1,102 | $1.04 | 21d | 9 | 1.34mi |
| 21 W Jefferson St Waterloo, IA | 1.0 | 1.0 | 711 | $1,410 | $1.98 | 21d | 6 | 1.39mi |
| 1254 W Mullan Ave Unit 1254 Waterloo, IA | 2.0 | 1.0 | 864 | $775 | $0.90 | 21d | 1 | 1.44mi |
| W Mullan Ave Waterloo, IA | 2.0 | 1.0 | 918 | $710 | $0.77 | 44d | 2 | 1.45mi |
| 1653 Carriage Hill Dr #1 Waterloo, IA | 2.0 | 1.0 | 721 | $795 | $1.10 | 21d | 1 | 1.46mi |
| 1272 W Mullan Ave Unit 1272 Waterloo, IA | 2.0 | 1.0 | 864 | $825 | $0.95 | 21d | 1 | 1.46mi |
| 102 1/2 South St Waterloo, IA | 1.0 | 1.0 | 668 | $550 | $0.82 | 21d | 1 | 1.48mi |
| 211 W Wellington St Unit 211 1/2 Wellington Waterloo, IA | 1.0 | 1.0 | 600 | $600 | $1.00 | 44d | 1 | 1.49mi |
| 401 Argyle St Waterloo, IA | 2.0 | 1.0 | 800 | $800 | $1.00 | 44d | 1 | 1.50mi |
Listing history 8 events
-
2026-06-19days on market $69,900 Active 8 DOM
-
2026-06-18days on market $69,900 Active 7 DOM
-
2026-06-17days on market $69,900 Active 6 DOM
-
2026-06-16days on market $69,900 Active 5 DOM
-
2026-06-15days on market $69,900 Active 4 DOM
-
2026-06-14days on market $69,900 Active 2 DOM
-
2026-06-13remarks 306-char remark
-
2026-06-13$69,900 Active 1 DOM
ⓘ Source: listings_history table (triggers on properties + properties_extension) + one-shot
backfill from property_details.listing_events for pre-trigger history.
Tax reassessment forecast IA · Partial reset (capped growth)
- Current annual tax
- $1,530 · $128/mo
- Projected year-2 tax
- $1,530 · $128/mo
- Expected delta
- $0/yr ($0/mo · 0.0%)
ⓘ Screening estimate from a state-policy table — verify with the county assessor before closing.
Climate risk First Street
- Flood 1/10 Low FEMA zone X · 0% chance over 30 yrs
- Wildfire 2/10 Low
- Heat 3/10 Moderate 7 d/yr ≥101°F today · 15 d/yr by 30 yrs out
- Wind 2/10 Low
- Air quality 1/10 Low 0 unhealthy d/yr today · 0 by 30 yrs out
Nearby sold comps map
Loading sold comps map…
Walkable amenities ~0.75 mi
Loading nearby amenities…
Taxation est. · year 1
- Rental income
- $10,321
- − Mortgage interest
- −$3,915
- − Property taxes
- −$1,530
- − Insurance
- −$350
- − Repairs & maintenance
- −$826
- − Management
- −$826
- − Depreciation
- −$2,033
- Taxable income
- $841
- Est. tax owed @ 24.0%
- −$202
- After-tax cash flow
- $1,673/yr
For passive investors: Depreciation is non-cash, so a rental often shows a tax loss while cash-flowing — sheltering income. Rental losses are passive: they offset passive income freely, and up to $25,000/yr can offset ordinary (W-2) income if you actively participate and your MAGI is under $100k (phasing out to $0 by $150k); unused losses carry forward. On sale, claimed depreciation is recaptured at up to 25%, and gains may owe capital-gains tax (a 1031 exchange can defer both). Figures are a year-1 estimate at your 24.0% rate — not tax advice; consult a CPA.
Schools (NCES district)
- District
- Waterloo Community School District
- NCES district ID
- 1930480
- Math proficiency
- 50% ▼ -4.00%
- Reading proficiency
- 54% ▲ 1.00%
- Median HH income
- $42,545
- Composite
- 43.72/100
- National rank
- #2950
- State rank
- #276 of 289 in IA
Livability — Waterloo
- Score
- 81/100
- State rank
- #74
- US rank
- #1589
Category grades
Schools grade is shown separately in the Schools card above.
Census & demographics
- Census place
- Waterloo, IA
- County
- Black Hawk County · 112,933 people
- City population
- 69,066
- Metro
- Waterloo-Cedar Falls, IA
- Population (ZIP)
- 17,952
- Household income
- $50,060
- Rent vs Own
- Severe rent burden
- 871.0
Population outlook (Black Hawk County) Hauer SSP2
- Today (2025)
- 139,716 people
- By 2030
- 142,853 · +2.2%
- By 2040
- 147,843 · +5.8%
- By 2050
- 153,247 · +9.7%
- By 2075
- 167,977 · +20.2%
- By 2100
- 177,320 · +26.9%
Race, ethnicity, and origin ACS 2023
- Neighborhood character
- Diverse neighborhood (Simpson 0.62)
- Race & ethnicity
- White 55% Black 26% Hispanic / Latino 10% Two or more races 7% Asian 2%
- Hispanic origin (detail)
- Mexican 6%
- Common ancestry
- Iranian 1% Portuguese 1% Lithuanian 1%
- Foreign-born
- 7% · Canada, Philippines, China
- Languages at home
- 89% English-only · Spanish 7% Other Asian/Pacific 2% Russian/Polish/Slavic 1%
Political lean MEDSL · Black Hawk
- 2024 margin
- Toss-up / Even · D 50.0% · R 48.8% · Other 1.2%
- 2008→2024 swing
- -21.3pp toward R · 2008: 22.4pp · 2024: 1.2pp
- All cycles
- 2024: D+1.2 2020: D+9.0 2016: D+7.3 2012: D+20.0 2008: D+22.4
Not yet ingested
- Civics
- —
Market trends
- HPI YoY
- ▼ -117.18%
- Current HPI
- 132.9478
- Rent YoY
- ▲ 6.67%
- Metro
- Waterloo-Cedar Falls, IA
- State GDP YoY
- ▲ 2.48%
- F500 in state
- 4
Industry mix (Fortune 500 HQ in IA)
| Industry | F500 HQs | Revenue |
|---|---|---|
| Financial Services | 1 | $16B |
|
||
| Retail / Convenience | 1 | $15B |
|
||
Price history
+52.0% since first listed2 events — show timeline
- 2026-06-11 Listed $69,900 NEIRBR as distributed by MLS GRID
- 2013-09-10 Sold (Public Records) $46,000 Public Records
Property tax history
+3.6%/yrLatest (2025): $1,530 · +8.5% YoY. Source: county tax records.
Cash-flow waterfall
monthlySold comps — $/sqft
last 12 mo · ≤1 miLoading sold comps…