 Duplex
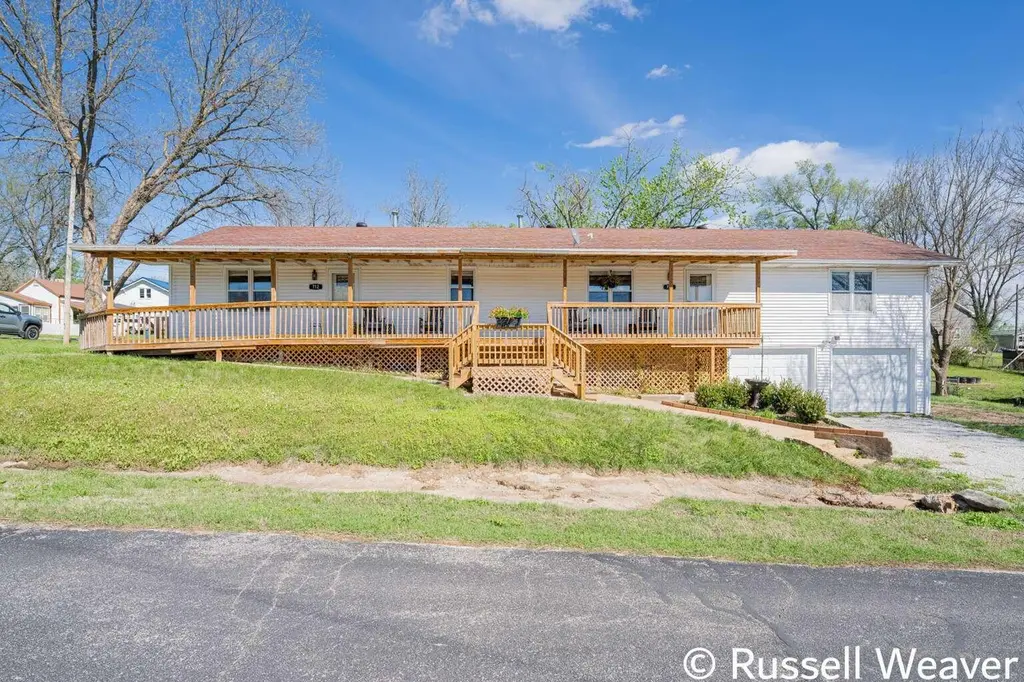
712 - 714 Arcadia St · Warsaw, MO
Flood risk 1/10 · Minimal
- FEMA flood zone
- X (unshaded)
- Chance of flooding over 30 yrs
- 0.0%
- Est. flood insurance / yr
- $473 – $860
Fire risk 1/10 · Minimal
- Est. fire insurance / yr
- $1,054 – $1,958
Heat risk 5/10 · Moderate
- Hot days now (above 108°F)
- 7 days/yr
- Hot days in 30 yrs
- 18 days/yr
Wind risk 2/10 · Minimal
- Chance of severe wind over 30 yrs
- 1.0%
Air-quality risk 2/10 · Minimal
- Unhealthy air days now
- 1 days/yr
- Unhealthy air days in 30 yrs
- 1 days/yr
Risk factors via First Street. Map © Google.
Why this score? — see what drove the F grade
The composite is a weighted blend of 9 inputs, each scored 0–100. Each bar is that input's sub-score; the figure is the points it added to the 100-point composite (weight × sub-score).
- Appreciation +7.7/10.0
- Cash flow +7.3/30.0
- Livability +3.2/5.0
- Schools +3.0/10.0
- Rent growth +2.5/5.0
- Condition / age +2.5/5.0
- DSCR +1.4/10.0
- 1% rule +1.0/10.0
- ARV discount +0.6/15.0
$319,999
🖨 Deal sheet (PDF) 📄 Offer letter ✓ Due diligence
Multi-family units
County records classify this as Multi-Family (2-4 Unit). Listing-text estimate: 2 units. confirmed
Listing remarks
Rare Turnkey Duplex - Walk to Harbor & Downtown | Warsaw, MOOpportunities like this don't come along often. Located at 712-714 Arcadia Street, this fully updated duplex combines prime location, flexible living, and strong income potential--all just a short walk to the harbor and downtown Warsaw's shops, dining, and local attractions. 🏡 Two Units, Multiple Opportunities Unit 1: 2 bedrooms, 1.5 bathrooms with full basement access Unit 2: 2 bedrooms, 1 bathroom Live in one unit and rent the other, or rent both for maximum income. Perfect for investors, house-hackers, or future retirees looking for a second home. 🔨 Fully Updated - Move-In Ready Brand new heat pumps for b
Key facts
- 9,583 sq ft lot
- 2 garage spots
- Built 1987
Neighborhood map
What this means for you Summary
Snapshot
- This is a 1×2.0bd/1.5ba + 1×2.0bd/1.0ba units multifamily listed at $320k.
Deal economics
- At list price, monthly cash flow is $-429 ($-5k/yr) — negative. Per door: $-214/mo.
- To cash-flow at today's rent, offer at most $244k (23.7% below list).
- To meet the 1% rule (rent ≥ 1% of price), the offer needs to be $192k (40.0% below list).
- Recommended offer: $192k (40.0% below list) — sets the bar for 1% rule.
- Cap rate 4.7% vs local median 3.4% in Warsaw — top-decile yield for the area; either an underpriced asset or a hidden risk that comps aren't pricing in. Stress-test before assuming the spread holds.
Location & tenants
- Location reads 63/100 on livability (#332 in MO) — a middle-class / working-renter tenant base. Strengths: cost of living A+, housing A+; Watch: crime D-, amenities F, commute F.
- Warsaw R-IX (rural): math 30% / reading 42% proficiency, ranked #222 of 324 in MO (top 68%) — families likely to look elsewhere, expect single-tenant / working-renter base with shorter leases; 61% free/reduced lunch — lower-income household profile, screen leases tightly.
- Zoned schools: John Boise Middle School (math 37% / reading 40%, grade F, #202 of 391 statewide, top 54%, 278 students, 99% FRL); Warsaw High School (math 27% / reading 52%, grade F, #247 of 521 statewide, top 55%, 403 students, 99% FRL) — zoned schools average 99% FRL vs 61% district-wide (38 pts higher); higher-poverty schools than district average — tighter screening recommended.
- Market conditions: 275 active listings in the ZIP; 9 units permitted in Benton County in 2024 (0 in 5+ unit buildings).
Forward outlook
- In year one you build about $20k of equity ($2k loan paydown + $17k appreciation (5.5% local appreciation)).
- Benton County population projected at -21% by 2050 — secular population decline; favor cash flow + early exit over multi-decade hold.
- By year 2, paydown + projected appreciation supports a ~$31k cash-out refi (75% LTV) — recoverable capital for the next deal without selling this one.
Negotiation context
- It's been on market 66 days — a 6% lower offer ($301k) is reasonable based on typical stale-listing flexibility.
- 2 sale attempts with the ask held roughly flat each time — persistent listings suggest the price (not the market) is what's stuck; bring a comps-based counter.
Risks & watch-outs
- Climate carrying-cost: extreme-heat days projected 7→18/yr by 2055 (HVAC capex compounding) — expect insurance premiums to compound above CPI over the hold.
Questions for the listing agent
- What do current leases actually rent for vs. the listed asking? Can we see a recent rent roll and the last 12 months of T-12 income?
- It's been on market 66 days. Have you received any prior offers? Is the seller open to a 40% concession, seller financing, or rate buy-down credit?
- Can we see the unit-by-unit rent roll, current vacancy, and any below-market leases? What's the average tenancy length?
- What capital expenditures (roof, boiler, parking lot, exteriors) have been made in the last 5 years, and what's planned in the next 2?
- Why hasn't it sold? Are there any deal-killer items the seller is aware of (foundation, flood, title, zoning, code violations)?
- Is there a deadline driving the sale (1031 exchange, divorce, estate, relocation)? That informs how much negotiation room exists.
- Schools are F-rated, which usually means shorter tenancies and higher turnover. Who's the typical renter profile here, and what's been the actual vacancy rate?
- Crime grade is D in this area — have there been break-ins, vandalism, or insurance claims at this property in the last 3 years? What carrier currently insures it and at what premium?
- The area grade is low — what's the realistic commute time and amenity access for the typical tenant pool here? Any planned neighborhood developments (good or bad) we should know about?
- What's the average days-on-market for RENTAL listings here right now (not sales)? A rising rental-DOM trend means longer vacancies and softer asking-rent achievability than the comps imply.
- What's the recent tenant-quality profile in this submarket — average credit score on applications, eviction rate, late-payment / NSF rate, and stable-employment percentage? A property-management company in the area should have these aggregated.
- How much new apartment / multifamily construction is in the pipeline within 1–3 miles? Heavy new supply (>2% of stock underway) typically softens rents 12–24 months out; light construction supports rent growth.
Investment metrics
- 1% rule
- 0.60% ✗
- Cap rate
- 4.68%
- Cash-on-cash
- -5.74%
- DSCR
- 0.74
- GRM
- 13.9
CMA / ARV
- ARV (median comp)
- $277,431
- List price
- $319,999
- Delta
- 15.34%
- Verdict
- OVERPRICED
- Comps
- 1 within 2.0 mi
Projected returns pro-forma
5.45% appreciation · 3.0% rent growth · sell at horizon
- IRR
- 9.2%
- Equity multiple
- 1.61×
- Total profit
- $54,596
- Equity at exit
- $190,157
- IRR
- 10.7%
- Equity multiple
- 3.06×
- Total profit
- $184,796
- Equity at exit
- $335,717
Cash invested: $89,600 (down + closing). Projections, not guarantees.
Landlord ↔ Tenant lean methodology
- Overall (STATE)
- 81 Strongly Landlord-Friendly
- State Missouri
- 81 Strongly Landlord-Friendly · R+10
- County
- — inherits STATE
- City
- — inherits STATE
ZIP-level market 65355
- Home prices YoY
- 2.4%
- Active inventory
- 275
- Price-to-rent
- 27.8×
Monthly cashflow live
- Estimated rent
- $1,920 medium interval (Pro) →
- Mortgage (P&I)
- −$1,678
- Tax from tax record
- −$134 /mo · $1,610/yr
- Insurance
- −$133
- HOA
- −$0
- Vacancy / Maint / Mgmt
- −$403
- Net cashflow
- $-429
Break-even live
Sensitivity live
| Price | -10% $-248 | -5% $-338 | +0% $-429 | +5% $-519 | +10% $-610 |
|---|---|---|---|---|---|
| Rent | -10% $-581 | -5% $-505 | +0% $-429 | +5% $-353 | +10% $-277 |
| Rate | -1.0pp $-268 | -0.5pp $-347 | base $-429 | +0.5pp $-512 | +1.0pp $-596 |
2-unit breakdown (identical units grouped — click to expand)
| Units | Beds | Baths | Est. rent |
|---|---|---|---|
| 1× unit | 2.0 | 1.5 | $960 |
| 1× unit | 2.0 | 1 | $960 |
| Total (2 units) | $1,920 | ||
UW: 25.0% down · 7.5% · 30yr · 1.5% tax · 5.0% vac · 8.0% maint · 8.0% mgmt
Financing live
Cash to close
- Down payment
- $80,000
- Closing costs
- $9,600
- Reserves months
- —
- Total cash needed
- —
Loan-product check · same deal, 3 products live
Conventional
25% down · 7.5% · 30yr
- Down + closing
- —
- Monthly P&I
- —
- Monthly cashflow
- —
- DSCR
- —
- Eligible?
- —
Personal DTI + credit; lowest rate.
DSCR
20% down · 8.5% · 30yr
- Down + closing
- —
- Monthly P&I
- —
- Monthly cashflow
- —
- DSCR
- —
- Eligible?
- —
No personal income docs; deal must DSCR.
Hard money
10% down · 12.0% · 12mo
- Down + closing
- —
- Monthly P&I
- —
- Monthly cashflow
- —
- DSCR
- —
- Eligible?
- —
Short-term bridge; refi at stabilization.
Listing history 21 events
-
2026-06-21days on market $319,999 Active 66 DOM
-
2026-06-21days on market $319,999 Active 65 DOM
-
2026-06-18days on market $319,999 Active 63 DOM
-
2026-06-17days on market $319,999 Active 62 DOM
-
2026-06-16days on market $319,999 Active 61 DOM
-
2026-06-15days on market $319,999 Active 60 DOM
-
2026-06-13days on market $319,999 Active 58 DOM
-
2026-06-12pricedays on market $319,999 Active 57 DOM
-
2026-06-09days on market $329,900 Active 54 DOM
-
2026-06-08days on market $329,900 Active 53 DOM
-
2026-06-07days on market $329,900 Active 52 DOM
-
2026-06-07days on market $329,900 Active 51 DOM
-
2026-06-04days on market $329,900 Active 48 DOM
-
2026-06-02days on market $329,900 Active 47 DOM
-
2026-06-01days on market $329,900 Active 46 DOM
-
2026-05-31days on market $329,900 Active 45 DOM
-
2026-05-31days on market $329,900 Active 44 DOM
-
2026-04-16$329,900 Active
-
2025-08-03price $315,000
-
2025-06-16$349,900 Active
-
2003-03-01soldstatus
ⓘ Source: listings_history table (triggers on properties + properties_extension) + one-shot
backfill from property_details.listing_events for pre-trigger history.
Tax reassessment forecast MO · Resets to sale price
- Current annual tax
- $1,610 · $134/mo
- Projected year-2 tax
- $3,104 · $259/mo
- Expected delta
- +$1,494/yr (+$124/mo · 92.7%)
ⓘ Screening estimate from a state-policy table — verify with the county assessor before closing.
Climate risk First Street
- Flood 1/10 Low FEMA zone X (unshaded) · 0% chance over 30 yrs
- Wildfire 1/10 Low
- Heat 5/10 Major 7 d/yr ≥108°F today · 18 d/yr by 30 yrs out
- Wind 2/10 Low 100% chance of damaging wind over 30 yrs
- Air quality 2/10 Low 1 unhealthy d/yr today · 1 by 30 yrs out
Nearby sold comps map
Loading sold comps map…
Walkable amenities ~0.75 mi
Loading nearby amenities…
Taxation est. · year 1
- Rental income
- $23,040
- − Mortgage interest
- −$17,925
- − Property taxes
- −$1,610
- − Insurance
- −$1,600
- − Repairs & maintenance
- −$1,843
- − Management
- −$1,843
- − Depreciation
- −$9,309
- Taxable loss
- −$11,091
- Est. tax savings @ 24.0%
- +$2,662
- After-tax cash flow
- $-2,484/yr
For passive investors: Depreciation is non-cash, so a rental often shows a tax loss while cash-flowing — sheltering income. Rental losses are passive: they offset passive income freely, and up to $25,000/yr can offset ordinary (W-2) income if you actively participate and your MAGI is under $100k (phasing out to $0 by $150k); unused losses carry forward. On sale, claimed depreciation is recaptured at up to 25%, and gains may owe capital-gains tax (a 1031 exchange can defer both). Figures are a year-1 estimate at your 24.0% rate — not tax advice; consult a CPA.
Schools (NCES district)
- District
- Warsaw R-IX
- NCES district ID
- 2931070
- Math proficiency
- 30% ▬ 0.00%
- Reading proficiency
- 42% ▲ 4.00%
- Median HH income
- $33,160
- Composite
- 29.53/100
- National rank
- #6495
- State rank
- #222 of 324 in MO
Livability — Warsaw
- Score
- 63/100
- State rank
- #332
- US rank
- #15201
Category grades
Schools grade is shown separately in the Schools card above.
Census & demographics
- Census place
- Warsaw, MO
- Population (ZIP)
- 11,029
Population outlook (Benton County) Hauer SSP2
- Today (2025)
- 17,355 people
- By 2030
- 16,513 · -4.9%
- By 2040
- 14,898 · -14.2%
- By 2050
- 13,662 · -21.3%
- By 2075
- 11,308 · -34.8%
- By 2100
- 8,755 · -49.6%
Race, ethnicity, and origin ACS 2023
- Neighborhood character
- Predominantly White (92%)
- Race & ethnicity
- White 92% Two or more races 6% Hispanic / Latino 2% Native American 1%
- Common ancestry
- Slovak 3% Italian 2% Iranian 2%
- Foreign-born
- 1% · Canada
Political lean MEDSL · Benton
- 2024 margin
- Solid R (+59.1) · D 20.1% · R 79.2%
- 2008→2024 swing
- -36.8pp toward R · 2008: -22.3pp · 2024: -59.1pp
- All cycles
- 2024: R+59.1 2020: R+56.6 2016: R+54.1 2012: R+34.3 2008: R+22.3
Not yet ingested
- Civics
- —
Market trends
- HPI YoY
- ▲ 5.45%
- Current HPI
- 232.6924
- Rent YoY
- —
- Metro
- —
- State GDP YoY
- ▲ 1.84%
- F500 in state
- 20
Industry mix (Fortune 500 HQ in MO)
| Industry | F500 HQs | Revenue |
|---|---|---|
| Healthcare | 1 | $163B |
|
||
| Insurance | 1 | $21B |
|
||
| Industrial Technology | 1 | $17B |
|
||
| Retail | 1 | $16B |
|
||
| Industrial Distribution | 1 | $10B |
|
||
| Utilities | 1 | $9B |
|
||
Price history
-5.7% since first listed4 events — show timeline
- 2026-04-16 Listed $329,900 SOMO
- 2025-08-03 Price Changed $315,000 SOMO
- 2025-06-16 Listed $349,900 SOMO
- 2003-03-01 Sold (Public Records) — Public Records
Property tax history
+2.5%/yrLatest (2025): $1,610 · +10.7% YoY. Source: county tax records.
Cash-flow waterfall
monthlySold comps — $/sqft
last 12 mo · ≤1 miLoading sold comps…