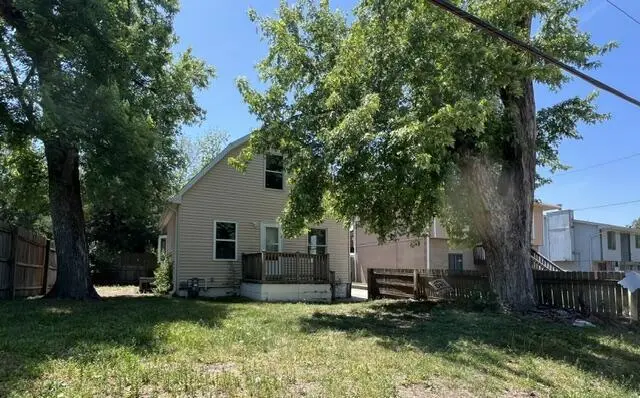
3903 Avenue C · Council Bluffs, IA
Flood risk 1/10 · Minimal
- FEMA flood zone
- X
- Chance of flooding over 30 yrs
- 0.0%
- Est. flood insurance / yr
- $507 – $1,088
Fire risk 2/10 · Minimal
- Est. fire insurance / yr
- $902 – $1,676
Heat risk 3/10 · Minor
- Hot days now (above 104°F)
- 7 days/yr
- Hot days in 30 yrs
- 15 days/yr
Wind risk 2/10 · Minimal
- Chance of severe wind over 30 yrs
- —
Air-quality risk 2/10 · Minimal
- Unhealthy air days now
- 1 days/yr
- Unhealthy air days in 30 yrs
- 1 days/yr
Risk factors via First Street. Map © Google.
Why this score? — see what drove the C+ grade
The composite is a weighted blend of 9 inputs, each scored 0–100. Each bar is that input's sub-score; the figure is the points it added to the 100-point composite (weight × sub-score).
- Cash flow +21.7/30.0
- ARV discount +15.0/15.0
- DSCR +6.9/10.0
- 1% rule +6.0/10.0
- Schools +4.5/10.0
- Livability +3.5/5.0
- Rent growth +2.6/5.0
- Condition / age +2.5/5.0
- Appreciation +0.0/10.0
$135,000
🖨 Deal sheet 📄 Offer letter ✓ Due diligence
Listing remarks MLS
Sold before print
Key facts
- Off street parking
- Fenced yard
- Newer roof
Tags
Property features AI
Exterior
- Parking: Off-street parking
- Security: Smoke detectors
- Utilities: Natural gas available; Electricity available; Public sewer
- Home design: Single family residence; 2 stories
- Construction: Frame construction
- Exterior features: Deck; Fenced yard; Composition roof
Interior
- Heating & cooling: Natural gas forced air heat; Central air conditioning; Electric cooling; Ceiling fan(s)
- Interior features: Ceiling fans; Eat-in kitchen; Full basement
- Laundry & utility: Laundry on main level
Neighborhood map
What this means for you Summary
Snapshot
- This is a 3-bed/1.0-bath single-family listed at $135k.
Deal economics
- At list price, monthly cash flow is $208 ($2k/yr) — positive.
- The deal already cash-flows at list — no discount required.
- Meets the 1% rule at list price ($1k rent vs $135k).
- Recommended offer: $133k (1.5% below list) — sets the bar for market timing.
- Cap rate 8.1% vs local median 3.3% in Council Bluffs — top-decile yield for the area; either an underpriced asset or a hidden risk that comps aren't pricing in. Stress-test before assuming the spread holds.
Location & tenants
- Location reads 70/100 on livability (#368 in IA) — a middle-class / working-renter tenant base. Strengths: cost of living A+, housing A+, health & safety B+; Watch: employment C-, amenities D, crime D-.
- Council Bluffs Community School District (urban): math 52% / reading 55% proficiency, ranked #272 of 289 in IA (top 94%) — acceptable for families but not a draw, mixed tenant base, ~2y average lease.
- Market conditions: Rents flat; 140 active listings in the ZIP; 40 comparable units currently listed for rent nearby; rentals at typical pace (median 15d on market — plan ~3-4 weeks tenant-placement turnaround); 679 units permitted in Pottawattamie County in 2024 (566 in 5+ unit buildings).
Forward outlook
- Local home prices are declining (-3.0%/yr); year-one equity from $933 of loan paydown is wiped out by about $4k of value loss. Plan a longer hold.
- Pottawattamie County population projected to shrink 7% by 2050 — rents likely to lag national; underwrite the cash flow, not the appreciation.
Negotiation context
- It's been on market 16 days — a 2% lower offer ($133k) is reasonable based on typical stale-listing flexibility.
- 3 sale attempts since 12y ago with the ask held roughly flat each time — persistent listings suggest the price (not the market) is what's stuck; bring a comps-based counter.
- Current owner paid $111k; 22% above their basis — modest negotiation headroom, anchor on the comps not their cost.
Risks & watch-outs
- Watch-outs: built in 1920 — expect roof / HVAC / electrical / plumbing capex.
Questions for the listing agent
- Built in 1920 — when were the roof, HVAC, electrical panel, plumbing, and water heater last replaced?
- Is there a deadline driving the sale (1031 exchange, divorce, estate, relocation)? That informs how much negotiation room exists.
- Crime grade is D in this area — have there been break-ins, vandalism, or insurance claims at this property in the last 3 years? What carrier currently insures it and at what premium?
- What's the average days-on-market for RENTAL listings here right now (not sales)? A rising rental-DOM trend means longer vacancies and softer asking-rent achievability than the comps imply.
- What's the recent tenant-quality profile in this submarket — average credit score on applications, eviction rate, late-payment / NSF rate, and stable-employment percentage? A property-management company in the area should have these aggregated.
- How much new for-sale + rental construction is in the pipeline within 1–3 miles? Heavy new supply typically softens prices + rents 12–24 months out; constrained supply supports both.
Investment metrics
- 1% rule
- 1.10% ✓
- Cap rate
- 8.14%
- Cash-on-cash
- 6.59%
- DSCR
- 1.29
- GRM
- 7.6
CMA / ARV
- ARV (median comp)
- $198,569
- List price
- $135,000
- Delta
- -32.01%
- Verdict
- UNDERPRICED
- Comps
- 20 within 1.0 mi
Show comp detail 12 sales within ~0.75 mi
| Address | Dist | Beds/Ba | Sqft | Sold | Price | $/sf | Match |
|---|---|---|---|---|---|---|---|
| 3903 Ave C | 0.00mi | 3/1.0 | 1,194 (+2%) | 4mo | $111,000 | $93 | 94 |
| 310 N 40th St | 0.07mi | 3/2.0 | 1,173 (+0%) | 9mo | $163,000 | $139 | 85 |
| 210 N 40th St | 0.06mi | 3/2.0 | 1,120 (-4%) | 5mo | $210,000 | $188 | 82 |
| 3560 Avenue C | 0.39mi | 2/1.0 (-1) | 1,120 (-4%) | 1mo | $185,000 | $165 | 68 |
| 3730 3rd Ave | 0.39mi | 3/2.0 | 1,152 (-2%) | 12mo | $225,000 | $195 | 65 |
| 3512 Avenue Ave E | 0.49mi | 2/1.0 (-1) | 1,150 (-2%) | 12mo | $191,200 | $166 | 59 |
| 3634 Avenue C | 0.29mi | 4/1.0 (+1) | 1,309 (+12%) | 5mo | $215,000 | $164 | 58 |
| 3454 Avenue B | 0.54mi | 2/1.0 (-1) | 1,214 (+4%) | 8mo | $160,000 | $132 | 57 |
| 3400 Avenue B | 0.64mi | 2/2.0 (-1) | 1,148 (-2%) | 2mo | $153,500 | $134 | 57 |
| 3511 Ave A | 0.50mi | 2/1.0 (-1) | 1,048 (-11%) | 3mo | $171,000 | $163 | 52 |
| 3436 Avenue E | 0.60mi | 3/1.0 | 1,330 (+14%) | 2mo | $225,000 | $169 | 48 |
| 3612 6th Ave | 0.64mi | 3/2.0 | 1,308 (+12%) | 6mo | $205,000 | $157 | 42 |
Match score weights: distance 35% · size 25% · config 20% · recency 20%. Top-matched comps best support the ARV.
Projected returns pro-forma
-3.0% appreciation · 0.56% rent growth · sell at horizon
- IRR
- -9.0%
- Equity multiple
- 0.68×
- Total profit
- $-12,153
- Equity at exit
- $20,129
- IRR
- -3.2%
- Equity multiple
- 0.81×
- Total profit
- $-7,246
- Equity at exit
- $11,672
Cash invested: $37,800 (down + closing). Projections, not guarantees.
Landlord ↔ Tenant lean methodology
- Overall (STATE)
- 83 Strongly Landlord-Friendly
- State Iowa
- 83 Strongly Landlord-Friendly · R+6
- County
- — inherits STATE
- City
- — inherits STATE
ZIP-level market 51501
- Rents YoY
- 0.6%
- Active inventory
- 140
- Price-to-rent
- 7.6×
Monthly cashflow live
- Estimated rent
- $1,480 high interval (Pro) →
- Mortgage (P&I)
- −$708
- Tax from tax record
- −$197 /mo · $2,367/yr
- Insurance
- −$56
- HOA
- −$0
- Vacancy / Maint / Mgmt
- −$311
- Net cashflow
- $208
Break-even live
UW: 25.0% down · 7.5% · 30yr · 1.5% tax · 5.0% vac · 8.0% maint · 8.0% mgmt
Financing live
Cash to close
- Down payment
- $33,750
- Closing costs
- $4,050
- Reserves months
- —
- Total cash needed
- —
Loan-product check · same deal, 3 products live
Conventional
25% down · 7.5% · 30yr
- Down + closing
- —
- Monthly P&I
- —
- Monthly cashflow
- —
- DSCR
- —
- Eligible?
- —
Personal DTI + credit; lowest rate.
DSCR
20% down · 8.5% · 30yr
- Down + closing
- —
- Monthly P&I
- —
- Monthly cashflow
- —
- DSCR
- —
- Eligible?
- —
No personal income docs; deal must DSCR.
Hard money
10% down · 12.0% · 12mo
- Down + closing
- —
- Monthly P&I
- —
- Monthly cashflow
- —
- DSCR
- —
- Eligible?
- —
Short-term bridge; refi at stabilization.
Rent comps 40 comps
| Address | Beds | Baths | Sqft | Rent | $/sqft | DOM | Units | Dist |
|---|---|---|---|---|---|---|---|---|
| 4123 Avenue C Council Bluffs, IA | 2.0 | 1.0 | 985 | $1,100 | $1.12 | 43d | 1 | 0.21mi |
| 4141 Rivers Edge Pkwy Council Bluffs, IA | 2.0 | 1.0–2.0 | 808 | $1,900 | $2.35 | 2d | 8 | 0.21mi |
| 20 S 41st St Council Bluffs, IA | 2.0 | 1.0–2.0 | 709 | $1,640 | $2.31 | 1d | 14 | 0.37mi |
| 3726 3rd Ave Apt E Council Bluffs, IA | 2.0 | 1.0 | 748 | $895 | $1.20 | 43d | 1 | 0.38mi |
| 3611 Avenue G Unit 1 Council Bluffs, IA | 2.0 | 1.0 | 1080 | $1,050 | $0.97 | 43d | 1 | 0.44mi |
| 806 N 34th St Unit 803-2 Council Bluffs, IA | 2.0 | 1.0 | 955 | $1,115 | $1.17 | 23d | 1 | 0.72mi |
| 806 N 34th St Unit 803-14 Council Bluffs, IA | 2.0 | 1.0 | 930 | $1,000 | $1.08 | 21d | 1 | 0.72mi |
| 806 N 34th St Unit 802-6 Council Bluffs, IA | 2.0 | 1.0 | 930 | $1,090 | $1.17 | 23d | 1 | 0.72mi |
| 806 N 34th St Unit 805-4 Council Bluffs, IA | 2.0 | 1.0 | 930 | $1,049 | $1.13 | 23d | 1 | 0.72mi |
| 806 N 34th St Unit 802-2 Council Bluffs, IA | 2.0 | 1.0 | 955 | $1,079 | $1.13 | 23d | 1 | 0.72mi |
| 806 N 34th St Unit 805-17 Council Bluffs, IA | 2.0 | 1.0 | 955 | $1,125 | $1.18 | 23d | 1 | 0.72mi |
| 806 N 34th St Council Bluffs, IA | 1.0–2.0 | 1.0 | 776 | $1,105 | $1.42 | 2d | 16 | 0.73mi |
| 806 N 34th St Council Bluffs, IA | 2.0 | 1.0 | 942 | $1,062 | $1.13 | 43d | 11 | 0.73mi |
| 105 S 9th St Omaha, NE | 2.0 | 2.0 | 1255 | $2,200 | $1.75 | 3d | 1 | 0.86mi |
| 10 N 31st St Unit A Council Bluffs, IA | 2.0 | 1.0 | 840 | $795 | $0.95 | 43d | 1 | 0.92mi |
| 900 Farnam St Omaha, NE | 1.0–2.0 | 1.0–2.0 | 870 | $1,750 | $2.01 | 2d | 9 | 0.94mi |
| 415 Leavenworth St Omaha, NE | 1.0–2.0 | 1.0–2.0 | 881 | $2,395 | $2.72 | 1d | 38 | 0.97mi |
| 1025 S 34th St Council Bluffs, IA | 3.0 | 2.0 | 1470 | $1,650 | $1.12 | 14d | 1 | 1.06mi |
| 1222 N 31st St Council Bluffs, IA | 2.0–4.0 | 1.0 | 1031 | $1,186 | $1.15 | 1d | 7 | 1.09mi |
| 1117 Nicholas St Omaha, NE | 2.0 | 1.0–2.0 | 848 | $2,195 | $2.59 | 2d | 47 | 1.09mi |
| 1119 Howard St Unit 302 Omaha, NE | 2.0 | 1.0 | 1500 | $2,300 | $1.53 | 43d | 1 | 1.19mi |
| 1213 Harney St Omaha, NE | 2.0 | 1.0 | 722 | $1,300 | $1.80 | 11d | 3 | 1.20mi |
| 1015 N 14th St Omaha, NE | 1.0–3.0 | 1.0–3.0 | 910 | $1,855 | $2.04 | 2d | 17 | 1.21mi |
| 1009 Leavenworth St Omaha, NE | 1.0–2.0 | 1.0 | 875 | $1,200 | $1.37 | 3d | 3 | 1.24mi |
| 905 S 10th Ct Omaha, NE | 2.0 | 1.5 | 1176 | $2,200 | $1.87 | 43d | 1 | 1.27mi |
| 1524 Cuming St Omaha, NE | 1.0–2.0 | 1.0–2.0 | 1117 | $2,195 | $1.96 | 2d | 14 | 1.31mi |
| 222 S 15th St Omaha, NE | 1.0–2.0 | 1.0–2.0 | 855 | $1,935 | $2.26 | 3d | 40 | 1.32mi |
| 1323 Jackson St Omaha, NE | 1.0–2.0 | 1.0–2.0 | 1169 | $1,545 | $1.32 | 3d | 3 | 1.33mi |
| 1015 N 16th St Omaha, NE | 1.0–2.0 | 1.0–2.0 | 1127 | $1,685 | $1.49 | 2d | 11 | 1.35mi |
| 1116 S 9th St Omaha, NE | 2.0 | 1.0 | 1400 | $1,400 | $1.00 | 23d | 1 | 1.37mi |
| 1322 S 6th St Unit 1322 Omaha, NE | 2.0 | 2.0 | 1350 | $1,270 | $0.94 | 14d | 1 | 1.37mi |
| 815 Pierce St Omaha, NE | 3.0 | 1.0 | 968 | $1,500 | $1.55 | 14d | 1 | 1.38mi |
| 815 Pierce St Omaha, NE | 3.0 | 1.0 | 968 | $1,500 | $1.55 | 23d | 1 | 1.38mi |
| 815 Pierce St Omaha, NE | 3.0 | 1.0 | 968 | $1,500 | $1.55 | 43d | 1 | 1.38mi |
| 405 S 16th St Omaha, NE | 1.0–2.0 | 1.0 | 832 | $1,350 | $1.62 | 11d | 11 | 1.38mi |
| 312 S 16th St Omaha, NE | 2.0 | 1.0–2.0 | 1076 | $1,350 | $1.25 | 3d | 2 | 1.42mi |
| 312 S 16th St #201 Omaha, NE | 2.0 | 2.0 | 1076 | $1,350 | $1.25 | 21d | 1 | 1.42mi |
| 925 Pierce St Unit 223 Omaha, NE | 2.0 | 1.0 | 1056 | $1,600 | $1.52 | 23d | 1 | 1.42mi |
| 925 Pierce St Unit 112 Omaha, NE | 2.0 | 2.0 | 1086 | $1,795 | $1.65 | 3d | 1 | 1.42mi |
| 925 Pierce St Apt 414 Omaha, NE | 2.0 | 2.0 | 1315 | $2,995 | $2.28 | 23d | 1 | 1.42mi |
Listing history 9 events
-
2026-06-01status $135,000 Pending 16 DOM
-
2026-05-31days on market $135,000 Active 16 DOM
-
2026-05-15$135,000 Active 394-char remark
-
2026-03-04soldstatus $111,000
-
2026-02-17soldstatus $111,000 17-char remark
Show marketing remark (17 chars)
Sold before print
-
2026-02-16$111,000 17-char remark
Show marketing remark (17 chars)
Sold before print
-
2014-11-10soldstatus $70,000
-
2014-11-06soldstatus $69,900
Show marketing remark (121 chars)
Super cute 3 bedroom 1 bath home with fenced backyard. Main floor bedroom with 2 bedrooms up. Lots of off street parking.
-
2014-09-02$69,900
Show marketing remark (121 chars)
Super cute 3 bedroom 1 bath home with fenced backyard. Main floor bedroom with 2 bedrooms up. Lots of off street parking.
ⓘ Source: listings_history table (triggers on properties + properties_extension) + one-shot
backfill from property_details.listing_events for pre-trigger history.
Tax reassessment forecast IA · Partial reset (capped growth)
- Current annual tax
- $2,367 · $197/mo
- Projected year-2 tax
- $2,367 · $197/mo
- Expected delta
- $0/yr ($0/mo · 0.0%)
ⓘ Screening estimate from a state-policy table — verify with the county assessor before closing.
Climate risk First Street
- Flood 1/10 Low FEMA zone X · 0% chance over 30 yrs
- Wildfire 2/10 Low
- Heat 3/10 Moderate 7 d/yr ≥104°F today · 15 d/yr by 30 yrs out
- Wind 2/10 Low
- Air quality 2/10 Low 1 unhealthy d/yr today · 1 by 30 yrs out
Nearby sold comps map
Loading sold comps map…
Walkable amenities ~0.75 mi
Loading nearby amenities…
Taxation est. · year 1
- Rental income
- $17,760
- − Mortgage interest
- −$7,562
- − Property taxes
- −$2,367
- − Insurance
- −$675
- − Repairs & maintenance
- −$1,421
- − Management
- −$1,421
- − Depreciation
- −$3,927
- Taxable income
- $387
- Est. tax owed @ 24.0%
- −$93
- After-tax cash flow
- $2,400/yr
For passive investors: Depreciation is non-cash, so a rental often shows a tax loss while cash-flowing — sheltering income. Rental losses are passive: they offset passive income freely, and up to $25,000/yr can offset ordinary (W-2) income if you actively participate and your MAGI is under $100k (phasing out to $0 by $150k); unused losses carry forward. On sale, claimed depreciation is recaptured at up to 25%, and gains may owe capital-gains tax (a 1031 exchange can defer both). Figures are a year-1 estimate at your 24.0% rate — not tax advice; consult a CPA.
Schools (NCES district)
- District
- Council Bluffs Community School District
- NCES district ID
- 1908220
- Math proficiency
- 52% ▼ -9.00%
- Reading proficiency
- 55% ▼ -1.00%
- Median HH income
- $45,259
- Composite
- 45.23/100
- National rank
- #2665
- State rank
- #272 of 289 in IA
Livability — Council Bluffs
- Score
- 70/100
- State rank
- #368
- US rank
- #7695
Category grades
Schools grade is shown separately in the Schools card above.
Census & demographics
- Census place
- Council Bluffs, IA
- County
- Pottawattamie County · 72,590 people
- City population
- 72,590
- Metro
- Omaha-Council Bluffs, NE-IA
- Population (ZIP)
- 34,618
- Household income
- $59,843
- Rent vs Own
- Severe rent burden
- 1110.0
Population outlook (Pottawattamie County) Hauer SSP2
- Today (2025)
- 93,683 people
- By 2030
- 92,772 · -1.0%
- By 2040
- 89,917 · -4.0%
- By 2050
- 86,994 · -7.1%
- By 2075
- 82,756 · -11.7%
- By 2100
- 79,097 · -15.6%
Race, ethnicity, and origin ACS 2023
- Neighborhood character
- Predominantly White (79%)
- Race & ethnicity
- White 79% Hispanic / Latino 14% Two or more races 8% Asian 2% Black 2%
- Hispanic origin (detail)
- Mexican 13%
- Common ancestry
- Portuguese 2% Romanian 2% Iranian 1%
- Foreign-born
- 6% · Canada, China
- Languages at home
- 90% English-only · Spanish 8% Chinese 1%
Political lean MEDSL · Pottawattamie
- 2024 margin
- R (+20.0) · D 39.3% · R 59.3% · Other 1.4%
- 2008→2024 swing
- -18.1pp toward R · 2008: -1.9pp · 2024: -20.0pp
- All cycles
- 2024: R+20.0 2020: R+16.8 2016: R+21.6 2012: R+5.8 2008: R+1.9
Not yet ingested
- Civics
- —
Market trends
- HPI YoY
- ▼ -187.49%
- Current HPI
- 215.2532
- Rent YoY
- ▲ 0.56%
- Metro
- Omaha-Council Bluffs, NE-IA
- State GDP YoY
- ▲ 2.48%
- F500 in state
- 4
Industry mix (Fortune 500 HQ in IA)
| Industry | F500 HQs | Revenue |
|---|---|---|
| Financial Services | 1 | $16B |
|
||
| Retail / Convenience | 1 | $15B |
|
||
Price history
+93.1% since first listed8 events — show timeline
- 2026-06-01 Pending — SWIAR
- 2026-05-15 Listed $135,000 SWIAR
- 2026-03-04 Sold (Public Records) $111,000 Public Records
- 2026-02-17 Sold (MLS) $111,000 SWIAR
- 2026-02-16 Listed $111,000 SWIAR
- 2014-11-10 Sold (Public Records) $70,000 Public Records
- 2014-11-06 Sold (MLS) $69,900 SWIAR
- 2014-09-02 Listed $69,900 SWIAR
Property tax history
+3.3%/yrLatest (2025): $2,367 · +5.2% YoY. Source: county tax records.
Cash-flow waterfall
monthlySold comps — $/sqft
last 12 mo · ≤1 miLoading sold comps…