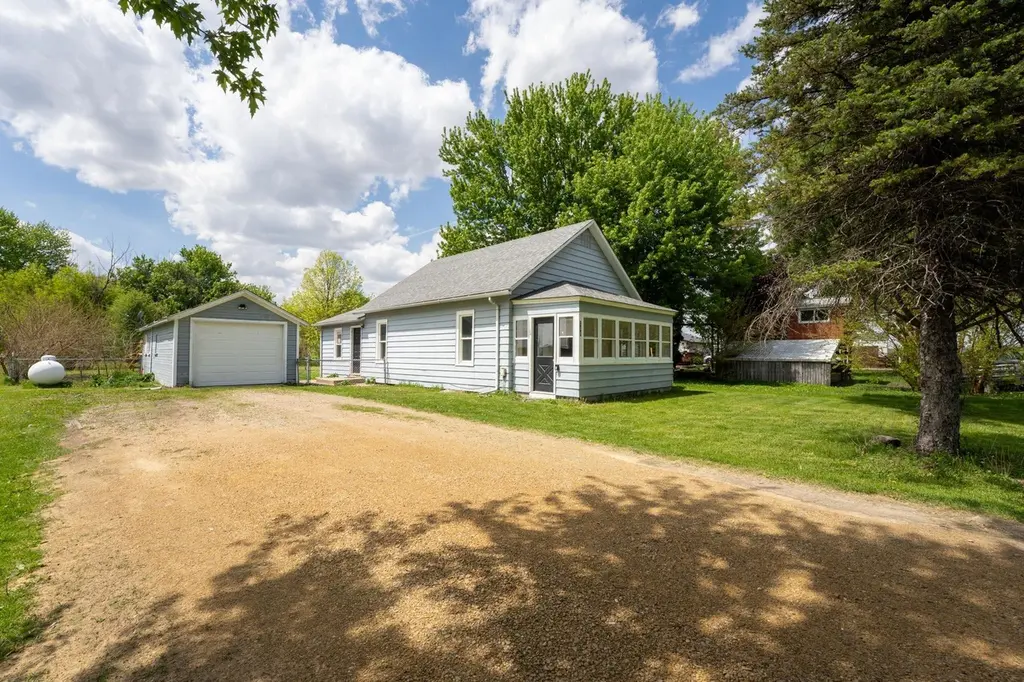
106 N School St · Oregon, IL
Flood risk 1/10 · Minimal
- FEMA flood zone
- X (unshaded)
- Chance of flooding over 30 yrs
- 0.0%
- Est. flood insurance / yr
- $507 – $1,088
Fire risk 1/10 · Minimal
- Est. fire insurance / yr
- $804 – $1,492
Heat risk 2/10 · Minimal
- Hot days now (above 102°F)
- 7 days/yr
- Hot days in 30 yrs
- 15 days/yr
Wind risk 2/10 · Minimal
- Chance of severe wind over 30 yrs
- 1.0%
Air-quality risk 3/10 · Minor
- Unhealthy air days now
- 2 days/yr
- Unhealthy air days in 30 yrs
- 3 days/yr
Risk factors via First Street. Map © Google.
Why this score? — see what drove the D+ grade
The composite is a weighted blend of 9 inputs, each scored 0–100. Each bar is that input's sub-score; the figure is the points it added to the 100-point composite (weight × sub-score).
- ARV discount +15.0/15.0
- Cash flow +11.5/30.0
- Appreciation +6.2/10.0
- Livability +3.8/5.0
- DSCR +3.4/10.0
- 1% rule +3.2/10.0
- Rent growth +2.5/5.0
- Condition / age +2.5/5.0
- Schools +1.9/10.0
$128,000
🖨 Deal sheet (PDF) 📄 Offer letter ✓ Due diligence
Listing remarks MLS
If you're looking for a solid ranch home with practical features and a convenient location, this Ogle County property deserves a look. Offering 3 bedrooms, 1 bathroom, a detached garage with workshop space, and easy access to Interstate 39, this home provides comfortable living with room to make it your own. Pulling up to the property, you'll first notice the covered front porch. It's a great spot to enjoy a cup of coffee in the morning, watch the weather roll through, or unwind after a long day. The porch creates a welcoming entrance and adds another place to enjoy the outdoors without leaving home. Inside, the home features a ranch-style layout with everything located on the main level. The living room flows directly into the kitchen, creating an open feel that works well for everyday living. Whether you're visiting with family, keeping an eye on dinner, or gathering with friends, the layout keeps everyone connected. The kitchen has been updated with newer appliances and offers plenty of cabinet and counter space. There is also room to add an island if additional prep space or seating is something you'd like in the future. The current setup is functional as it sits while still offering flexibility for future improvements. Main-level laundry adds convenience and keeps daily chores simple. Having everything on one floor makes the home easy to navigate and provides an efficient use of space throughout. The home includes three bedrooms and one full bathroom. The bedrooms offer flexibility for a variety of needs, whether used for sleeping space, a home office, hobby room, or extra storage. The layout is straightforward and designed for practical day-to-day living. Step outside and you'll find several features that add to the property's usability. A deck off the home provides space for grilling, outdoor meals, or simply relaxing outside. The fenced backyard offers a defined outdoor area with room for recreation, gardening, landscaping projects, or pets, subject to local regulations and buyer preferences. The detached garage provides space for vehicles, lawn equipment, tools, and storage. Attached workshop space gives you room for projects, repairs, woodworking, hobbies, or additional storage. Whether you're someone who enjoys working with your hands or simply needs extra room for equipment, the workshop area is a valuable feature. Location is another strong point of this property. Situated near Interstate 39, commuting and travel are straightforward. Rockford and DeKalb are both within easy driving distance, providing access to employment centers, shopping, dining, healthcare services, and entertainment options. Nearby communities such as Oregon, Rochelle, Byron, and Stillman Valley offer additional conveniences and local amenities. The property is located within Oregon School District 220.
Key facts
- Covered front porch
- Deck off the home
- Main level laundry
Tags
Property features AI
Finance
- Other: Possession at closing; Earnest money required; Directions available to property
- Financial info: Homeowner tax exemption
- HOA & community: No master association fee required
Exterior
- Parking: Detached garage (1 garage space, 1 total parking space)
- Utilities: Shared well water; Septic tank sewer
- Home design: Detached single-family home; One-story; Fee simple ownership; Estimated living area
- Construction: Vinyl siding; Built approximately 71–80 years ago; Built before 1978
- Exterior features: Lot dimensions approximately 66 x 142 x 66 x 142; Lot under 0.25 acre; Unincorporated location
Interior
- Kitchen: Kitchen — 11 x 14
- Bedrooms: Three bedrooms (all on main level); Master bedroom (main level); Bedroom 2 — 10 x 12 (main level); Bedroom 3 — 9 x 12 (main level)
- Bathrooms: One full bathroom
- Heating & cooling: Propane forced-air heating; Window air conditioning units
- Interior features: Five total rooms; Dining room; Family room; Living room
- Laundry & utility: Main-level laundry — 4 x 6
Neighborhood map
What this means for you Summary
Snapshot
- This is a 3-bed/1.0-bath single-family listed at $128k.
Deal economics
- At list price, monthly cash flow is $-43 ($-512/yr) — negative.
- To cash-flow at today's rent, offer at most $120k (5.9% below list).
- To meet the 1% rule (rent ≥ 1% of price), the offer needs to be $105k (17.7% below list).
- Recommended offer: $105k (17.7% below list) — sets the bar for 1% rule.
- Cap rate 5.9% vs local median 2.4% in Oregon — top-decile yield for the area; either an underpriced asset or a hidden risk that comps aren't pricing in. Stress-test before assuming the spread holds.
Location & tenants
- Location reads 76/100 on livability (#193 in IL, #3,619 nationally) — a middle-class / working-renter tenant base. Strengths: crime A+, cost of living A+, housing A+; Watch: amenities F, commute F.
- Oregon CUSD 220 (town): math 20% / reading 22% proficiency, ranked #400 of 620 in IL (top 64%) — low school quality limits family demand, transient renter base, plan for 1-2y turnover.
- Zoned schools: Oregon Elem Sch (math 22% / reading 24%, grade F, #929 of 2,056 statewide, top 45%, 776 students, 0% FRL); David L Rahn Jr High School (math 16% / reading 19%); Oregon Jr/Sr High School (math 22% / reading 22%, grade F, #319 of 693 statewide, top 50%, 663 students, 0% FRL) — zoned schools average 0% FRL vs 39% district-wide (39 pts lower); this property's tenant base skews higher-income than the district average.
- Market conditions: 4 active listings in the ZIP; 113 units permitted in Ogle County in 2024 (67 in 5+ unit buildings).
Forward outlook
- In year one you build about $4k of equity ($885 loan paydown + $3k appreciation (2.5% local appreciation)).
- Ogle County population projected at -24% by 2050 — secular population decline; favor cash flow + early exit over multi-decade hold.
- At projected returns (2.5% appreciation + 3.0% rent growth), your $36k cash investment doubles in ~8 years — after that, you're playing with house money.
- By year 9, paydown + projected appreciation supports a ~$34k cash-out refi (75% LTV) — recoverable capital for the next deal without selling this one.
Negotiation context
- Only 8 days on market — expect competitive offers; lowballing is unlikely to land.
- 9 sale attempts since 13y ago with the ask held roughly flat each time — persistent listings suggest the price (not the market) is what's stuck; bring a comps-based counter.
- Current owner paid $96k; 34% above their basis — modest negotiation headroom, anchor on the comps not their cost.
Risks & watch-outs
- Watch-outs: built in 1950 — expect roof / HVAC / electrical / plumbing capex.
Questions for the listing agent
- What do current leases actually rent for vs. the listed asking? Can we see a recent rent roll and the last 12 months of T-12 income?
- Built in 1950 — when were the roof, HVAC, electrical panel, plumbing, and water heater last replaced?
- Is there a deadline driving the sale (1031 exchange, divorce, estate, relocation)? That informs how much negotiation room exists.
- Schools are F-rated, which usually means shorter tenancies and higher turnover. Who's the typical renter profile here, and what's been the actual vacancy rate?
- The area grade is low — what's the realistic commute time and amenity access for the typical tenant pool here? Any planned neighborhood developments (good or bad) we should know about?
- What's the average days-on-market for RENTAL listings here right now (not sales)? A rising rental-DOM trend means longer vacancies and softer asking-rent achievability than the comps imply.
- What's the recent tenant-quality profile in this submarket — average credit score on applications, eviction rate, late-payment / NSF rate, and stable-employment percentage? A property-management company in the area should have these aggregated.
- How much new for-sale + rental construction is in the pipeline within 1–3 miles? Heavy new supply typically softens prices + rents 12–24 months out; constrained supply supports both.
Investment metrics
- 1% rule
- 0.82% ✗
- Cap rate
- 5.89%
- Cash-on-cash
- -1.43%
- DSCR
- 0.94
- GRM
- 10.1
CMA / ARV
- ARV (on-the-fly)
- $217,350
- Comps found
- 2
Show comp detail 2 sales within ~0.75 mi
| Address | Dist | Beds/Ba | Sqft | Sold | Price | $/sf | Match |
|---|---|---|---|---|---|---|---|
| 107 Main St | 0.10mi | 3/1.0 | 1,128 (+7%) | 15mo | $106,900 | $95 | 70 |
| 2741 S Chana Rd | 0.26mi | 4/1.0 (+1) | 1,186 (+13%) | 23mo | $245,000 | $207 | 42 |
Match score weights: distance 35% · size 25% · config 20% · recency 20%. Top-matched comps best support the ARV.
Projected returns pro-forma
2.45% appreciation · 3.0% rent growth · sell at horizon
- IRR
- 4.5%
- Equity multiple
- 1.25×
- Total profit
- $9,009
- Equity at exit
- $53,612
- IRR
- 7.9%
- Equity multiple
- 2.13×
- Total profit
- $40,622
- Equity at exit
- $79,679
Cash invested: $35,840 (down + closing). Projections, not guarantees.
Landlord ↔ Tenant lean methodology
- Overall (STATE)
- 43 Moderately Tenant-Leaning
- State Illinois
- 43 Moderately Tenant-Leaning · D+7
- County
- — inherits STATE
- City
- — inherits STATE
ZIP-level market 61015
- Home prices YoY
- 2.0%
- Active inventory
- 4
- Price-to-rent
- 10.1×
Monthly cashflow live
- Estimated rent
- $1,053 medium interval (Pro) →
- Mortgage (P&I)
- −$671
- Tax from tax record
- −$150 /mo · $1,801/yr
- Insurance
- −$53
- HOA
- −$0
- Vacancy / Maint / Mgmt
- −$221
- Net cashflow
- $-43
Break-even live
Sensitivity live
| Price | -10% $30 | -5% $-6 | +0% $-43 | +5% $-79 | +10% $-115 |
|---|---|---|---|---|---|
| Rent | -10% $-126 | -5% $-84 | +0% $-43 | +5% $-1 | +10% $41 |
| Rate | -1.0pp $22 | -0.5pp $-10 | base $-43 | +0.5pp $-76 | +1.0pp $-110 |
UW: 25.0% down · 7.5% · 30yr · 1.5% tax · 5.0% vac · 8.0% maint · 8.0% mgmt
Financing live
Cash to close
- Down payment
- $32,000
- Closing costs
- $3,840
- Reserves months
- —
- Total cash needed
- —
Loan-product check · same deal, 3 products live
Conventional
25% down · 7.5% · 30yr
- Down + closing
- —
- Monthly P&I
- —
- Monthly cashflow
- —
- DSCR
- —
- Eligible?
- —
Personal DTI + credit; lowest rate.
DSCR
20% down · 8.5% · 30yr
- Down + closing
- —
- Monthly P&I
- —
- Monthly cashflow
- —
- DSCR
- —
- Eligible?
- —
No personal income docs; deal must DSCR.
Hard money
10% down · 12.0% · 12mo
- Down + closing
- —
- Monthly P&I
- —
- Monthly cashflow
- —
- DSCR
- —
- Eligible?
- —
Short-term bridge; refi at stabilization.
Listing history 8 events
-
2026-06-14status $128,000 Pending 8 DOM
-
2026-06-13days on market $128,000 Active 8 DOM
-
2026-06-12days on market $128,000 Active 7 DOM
-
2026-06-09days on market $128,000 Active 4 DOM
-
2026-06-08days on market $128,000 Active 3 DOM
-
2026-06-07days on market $128,000 Active 2 DOM
-
2026-06-07remarks 699-char remark
-
2026-06-07$128,000 Active 1 DOM
ⓘ Source: listings_history table (triggers on properties + properties_extension) + one-shot
backfill from property_details.listing_events for pre-trigger history.
Tax reassessment forecast IL · Partial reset (capped growth)
- Current annual tax
- $1,801 · $150/mo
- Projected year-2 tax
- $2,353 · $196/mo
- Expected delta
- +$552/yr (+$46/mo · 30.7%)
ⓘ Screening estimate from a state-policy table — verify with the county assessor before closing.
Climate risk First Street
- Flood 1/10 Low FEMA zone X (unshaded) · 0% chance over 30 yrs
- Wildfire 1/10 Low
- Heat 2/10 Low 7 d/yr ≥102°F today · 15 d/yr by 30 yrs out
- Wind 2/10 Low 100% chance of damaging wind over 30 yrs
- Air quality 3/10 Moderate 2 unhealthy d/yr today · 3 by 30 yrs out
Nearby sold comps map
Loading sold comps map…
Walkable amenities ~0.75 mi
Loading nearby amenities…
Taxation est. · year 1
- Rental income
- $12,639
- − Mortgage interest
- −$7,170
- − Property taxes
- −$1,801
- − Insurance
- −$640
- − Repairs & maintenance
- −$1,011
- − Management
- −$1,011
- − Depreciation
- −$3,724
- Taxable loss
- −$2,718
- Est. tax savings @ 24.0%
- +$652
- After-tax cash flow
- $141/yr
For passive investors: Depreciation is non-cash, so a rental often shows a tax loss while cash-flowing — sheltering income. Rental losses are passive: they offset passive income freely, and up to $25,000/yr can offset ordinary (W-2) income if you actively participate and your MAGI is under $100k (phasing out to $0 by $150k); unused losses carry forward. On sale, claimed depreciation is recaptured at up to 25%, and gains may owe capital-gains tax (a 1031 exchange can defer both). Figures are a year-1 estimate at your 24.0% rate — not tax advice; consult a CPA.
Schools (NCES district)
- District
- Oregon CUSD 220
- NCES district ID
- 1730160
- Math proficiency
- 20% ▼ -9.00%
- Reading proficiency
- 22% ▼ -4.00%
- Median HH income
- $50,631
- Composite
- 18.8/100
- National rank
- #8868
- State rank
- #400 of 620 in IL
Livability — Oregon
- Score
- 76/100
- State rank
- #193
- US rank
- #3619
Category grades
Schools grade is shown separately in the Schools card above.
Census & demographics
- Population (ZIP)
- 870
Population outlook (Ogle County) Hauer SSP2
- Today (2025)
- 48,390 people
- By 2030
- 46,346 · -4.2%
- By 2040
- 41,772 · -13.7%
- By 2050
- 36,911 · -23.7%
- By 2075
- 27,130 · -43.9%
- By 2100
- 18,627 · -61.5%
Race, ethnicity, and origin ACS 2023
- Neighborhood character
- Predominantly White (100%)
- Race & ethnicity
- White 100%
- Common ancestry
- Lithuanian 5% Portuguese 4% Romanian 3%
- Foreign-born
- 0%
Political lean MEDSL · Ogle
- 2024 margin
- Strong R (+29.4) · D 34.5% · R 63.9% · Other 1.6%
- 2008→2024 swing
- -21.8pp toward R · 2008: -7.6pp · 2024: -29.4pp
- All cycles
- 2024: R+29.4 2020: R+25.9 2016: R+26.6 2012: R+16.7 2008: R+7.6
Not yet ingested
- Civics
- —
Market trends
- HPI YoY
- ▲ 2.45%
- Current HPI
- 124.3268
- Rent YoY
- —
- Metro
- —
- State GDP YoY
- ▲ 1.59%
- F500 in state
- 60
Industry mix (Fortune 500 HQ in IL)
| Industry | F500 HQs | Revenue |
|---|---|---|
| Insurance | 4 | $201B |
|
||
| Consumer Goods | 4 | $87B |
|
||
| Industrial Machinery | 3 | $64B |
|
||
| Healthcare | 2 | $55B |
|
||
| Retail / Pharmacy | 1 | $148B |
|
||
| Agriculture / Food | 1 | $86B |
|
||
Price history
+447.0% since first listed20 events — show timeline
- 2026-06-04 Listed $128,000 NWIAR
- 2026-06-04 Listed $128,000 MRED as Distributed by MLS Grid
- 2022-06-03 Sold (Public Records) $95,500 Public Records
- 2022-06-01 Sold (MLS) $96,000 MRED as Distributed by MLS Grid
- 2022-06-01 Sold (MLS) $96,000 NWIAR
- 2022-05-04 Pending — MRED as Distributed by MLS Grid
- 2022-04-07 Relisted — MRED as Distributed by MLS Grid
- 2022-04-04 Pending — MRED as Distributed by MLS Grid
- 2022-03-18 Relisted — MRED as Distributed by MLS Grid
- 2022-03-10 Pending — MRED as Distributed by MLS Grid
- 2022-02-15 Relisted — MRED as Distributed by MLS Grid
- 2022-02-14 Pending — MRED as Distributed by MLS Grid
- 2022-01-19 Price Changed $104,900 MRED as Distributed by MLS Grid
- 2021-12-31 Relisted — MRED as Distributed by MLS Grid
- 2021-12-23 Pending — MRED as Distributed by MLS Grid
- 2021-12-15 Price Changed $109,900 MRED as Distributed by MLS Grid
- 2021-12-07 Listed $114,900 MRED as Distributed by MLS Grid
- 2021-12-07 Listed $104,900 NWIAR
- 2014-02-14 Sold (MLS) $18,650 MRED as Distributed by MLS Grid
- 2013-11-22 Listed $23,400 MRED as Distributed by MLS Grid
Property tax history
+6.4%/yrLatest (2024): $1,801 · +132.9% YoY. Source: county tax records.
Cash-flow waterfall
monthlySold comps — $/sqft
last 12 mo · ≤1 miLoading sold comps…