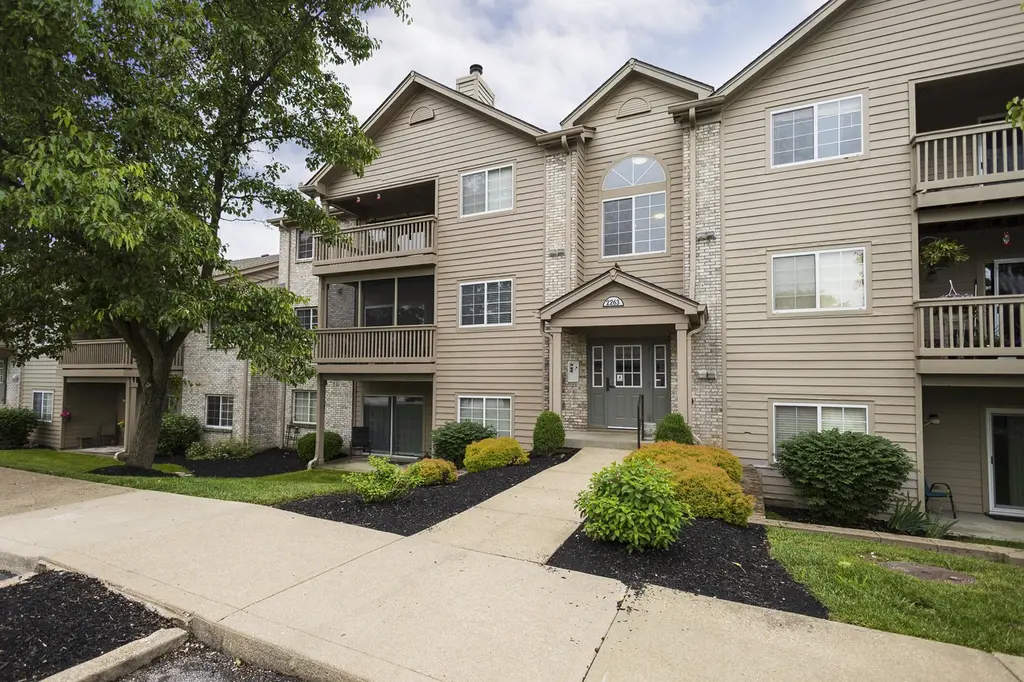
2263 Teal Briar Ln #310 · Burlington, KY
Flood risk 1/10 · Minimal
- FEMA flood zone
- X (unshaded)
- Chance of flooding over 30 yrs
- 0.0%
- Est. flood insurance / yr
- $507 – $1,088
Fire risk 1/10 · Minimal
- Est. fire insurance / yr
- $839 – $1,559
Heat risk 4/10 · Minor
- Hot days now (above 101°F)
- 7 days/yr
- Hot days in 30 yrs
- 19 days/yr
Wind risk 2/10 · Minimal
- Chance of severe wind over 30 yrs
- 1.0%
Air-quality risk 2/10 · Minimal
- Unhealthy air days now
- 1 days/yr
- Unhealthy air days in 30 yrs
- 3 days/yr
Risk factors via First Street. Map © Google.
Why this score? — see what drove the D grade
The composite is a weighted blend of 9 inputs, each scored 0–100. Each bar is that input's sub-score; the figure is the points it added to the 100-point composite (weight × sub-score).
- Cash flow +11.0/30.0
- ARV discount +7.5/15.0
- 1% rule +6.2/10.0
- Schools +4.1/10.0
- Livability +3.9/5.0
- DSCR +3.2/10.0
- Rent growth +2.5/5.0
- Condition / age +2.5/5.0
- Appreciation +0.0/10.0
$154,900
🖨 Deal sheet 📄 Offer letter ✓ Due diligence
Listing remarks MLS
Enjoy maintenance free living in this spacious and spotless condo. Kitchen/hall flooring and carpet throughout replaced in 07, Freshly painted, some new lighting, Plantation blinds, kitchen & bath sink faucets replaced, Relax on covered balcony overlooking lovely lake, wood burning fireplace for those cold evenings. Garage with opener. Close to shopping & interstate.
Key facts
- Grilling areas
- Community pool
- Tennis courts
Tags
Property features AI
Finance
- Other:
- HOA & community: Monthly HOA with landscaping, playground, pool, tennis courts, clubhouse, fitness center, and trails; HOA fee covers association fees, grounds maintenance, management, sewer, snow removal, trash, and water
Exterior
- Parking: Assigned parking; Garage (1 space); Off-street parking
- Security: Security system
- Utilities: Public water; Public sewer; Cable available; Sewer available; Water available
- Home design: Condominium; One level; Entry level: 2
- Construction: Built in 1995; Brick and vinyl siding; Shingle roof; Poured concrete foundation
- Exterior features: Covered deck; Deck; Balcony; Walkout to covered deck (from living room); Paved road frontage on a city street; Has a view
Interior
- Kitchen: Electric oven; Electric range; Dishwasher; Microwave; Refrigerator
- Bedrooms: Primary bedroom (14 x 11); Bedroom 2 (12 x 11)
- Bathrooms: 2 full bathrooms
- Heating & cooling: Heat pump and electric heating; Central air conditioning
- Interior features: Laminate counters; Walk-in closets; Cathedral ceilings; Ceiling fans; High ceilings; Intercom; Multi-panel doors; Wood-burning fireplace with ceramic surround
- Laundry & utility: Laundry room with washer hookup and electric dryer hookup
Neighborhood map
What this means for you Summary
Snapshot
- This is a 2-bed/2.0-bath condo listed at $155k.
Deal economics
- At list price, monthly cash flow is $-65 ($-785/yr) — negative.
- To cash-flow at today's rent, offer at most $143k (7.5% below list).
- Meets the 1% rule at list price ($2k rent vs $155k).
- Recommended offer: $143k (7.5% below list) — sets the bar for cash-flow.
- Cap rate 5.8% vs local median 4.3% in Burlington — top-decile yield for the area; either an underpriced asset or a hidden risk that comps aren't pricing in. Stress-test before assuming the spread holds.
Location & tenants
- Location reads 77/100 on livability (#83 in KY, #2,792 nationally) — a middle-class / working-renter tenant base. Strengths: crime A+, employment A+, cost of living A+; Watch: health & safety C-, amenities F, commute F.
- Boone County (suburban): math 43% / reading 49% proficiency, ranked #12 of 165 in KY (top 7%) — families likely to look elsewhere, expect single-tenant / working-renter base with shorter leases.
- Zoned schools: Burlington Elementary School (math 44% / reading 49%, grade D-, #133 of 676 statewide, top 20%, 692 students, 46% FRL); Camp Ernst Middle School (math 28% / reading 43%, grade F, #94 of 217 statewide, top 44%, 723 students, 48% FRL); Conner High School (math 47% / reading 51%, grade D, #15 of 254 statewide, top 6%, 1,443 students, 33% FRL).
- Market conditions: 155 active listings in the ZIP; 1 comparable units currently listed for rent nearby; high-income renter base; 1,430 units permitted in Boone County in 2024 (928 in 5+ unit buildings).
Forward outlook
- Local home prices are declining (-3.0%/yr); year-one equity from $1k of loan paydown is wiped out by about $5k of value loss. Plan a longer hold.
- Boone County population projected at +24% by 2050 — long-run rental-demand tailwind backs the buy-and-hold thesis.
Negotiation context
- It's been on market 27 days — a 2% lower offer ($153k) is reasonable based on typical stale-listing flexibility.
- 6 sale attempts since 21y ago with the ask held roughly flat each time — persistent listings suggest the price (not the market) is what's stuck; bring a comps-based counter.
- Current owner paid $76k; list at $155k implies a 102% gain — meaningful room to come down on a strong offer.
Risks & watch-outs
- Watch-outs: HOA is 25% of rent.
Questions for the listing agent
- What do current leases actually rent for vs. the listed asking? Can we see a recent rent roll and the last 12 months of T-12 income?
- What does the HOA fee cover, when was the last increase, and are there any pending special assessments or reserve-fund shortfalls?
- Any open or pending special assessments — roof, HVAC, plumbing, elevator, façade? What's the per-unit balance and payoff schedule, and is the seller paying it off at close or rolling it to the buyer?
- Is there a deadline driving the sale (1031 exchange, divorce, estate, relocation)? That informs how much negotiation room exists.
- The area grade is low — what's the realistic commute time and amenity access for the typical tenant pool here? Any planned neighborhood developments (good or bad) we should know about?
- What's the average days-on-market for RENTAL listings here right now (not sales)? A rising rental-DOM trend means longer vacancies and softer asking-rent achievability than the comps imply.
- What's the recent tenant-quality profile in this submarket — average credit score on applications, eviction rate, late-payment / NSF rate, and stable-employment percentage? A property-management company in the area should have these aggregated.
- How much new apartment / multifamily construction is in the pipeline within 1–3 miles? Heavy new supply (>2% of stock underway) typically softens rents 12–24 months out; light construction supports rent growth.
Investment metrics
- 1% rule
- 1.12% ✓
- Cap rate
- 5.79%
- Cash-on-cash
- -1.81%
- DSCR
- 0.92
- GRM
- 7.5
CMA / ARV
No comps found within radius.
Projected returns pro-forma
-3.0% appreciation · 3.0% rent growth · sell at horizon
- IRR
- -19.1%
- Equity multiple
- 0.33×
- Total profit
- $-29,021
- Equity at exit
- $23,096
- IRR
- -11.3%
- Equity multiple
- 0.32×
- Total profit
- $-29,632
- Equity at exit
- $13,393
Cash invested: $43,372 (down + closing). Projections, not guarantees.
Landlord ↔ Tenant lean methodology
- Overall (STATE)
- 83 Strongly Landlord-Friendly
- State Kentucky
- 83 Strongly Landlord-Friendly · R+16
- County
- — inherits STATE
- City
- — inherits STATE
ZIP-level market 41005
- Home prices YoY
- -25.4%
- Active inventory
- 155
- Price-to-rent
- 7.5×
Monthly cashflow live
- Estimated rent
- $1,728 medium interval (Pro) →
- Mortgage (P&I)
- −$812
- Tax from tax record
- −$120 /mo · $1,441/yr
- Insurance
- −$65
- HOA
- −$434
- Vacancy / Maint / Mgmt
- −$363
- Net cashflow
- $-65
Break-even live
UW: 25.0% down · 7.5% · 30yr · 1.5% tax · 5.0% vac · 8.0% maint · 8.0% mgmt
Financing live
Cash to close
- Down payment
- $38,725
- Closing costs
- $4,647
- Reserves months
- —
- Total cash needed
- —
Loan-product check · same deal, 3 products live
Conventional
25% down · 7.5% · 30yr
- Down + closing
- —
- Monthly P&I
- —
- Monthly cashflow
- —
- DSCR
- —
- Eligible?
- —
Personal DTI + credit; lowest rate.
DSCR
20% down · 8.5% · 30yr
- Down + closing
- —
- Monthly P&I
- —
- Monthly cashflow
- —
- DSCR
- —
- Eligible?
- —
No personal income docs; deal must DSCR.
Hard money
10% down · 12.0% · 12mo
- Down + closing
- —
- Monthly P&I
- —
- Monthly cashflow
- —
- DSCR
- —
- Eligible?
- —
Short-term bridge; refi at stabilization.
Rent comps 1 comps
| Address | Beds | Baths | Sqft | Rent | $/sqft | DOM | Units | Dist |
|---|---|---|---|---|---|---|---|---|
| 6060 Taylor Dr Burlington, KY | 1.0–3.0 | 1.0–2.0 | 1100 | $1,500 | $1.36 | 1d | 13 | 1.06mi |
HOA detail condo
- Monthly dues
- $434 · $5,208/yr
- Assessments
- None detected in remarks — confirm with the listing agent.
Listing history 27 events
-
2026-06-18days on market $154,900 Active 27 DOM
-
2026-06-17days on market $154,900 Active 26 DOM
-
2026-06-16days on market $154,900 Active 25 DOM
-
2026-06-15days on market $154,900 Active 24 DOM
-
2026-06-13days on market $154,900 Active 22 DOM
-
2026-06-09days on market $154,900 Active 18 DOM
-
2026-06-08days on market $154,900 Active 17 DOM
-
2026-06-07days on market $154,900 Active 16 DOM
-
2026-06-05days on market $154,900 Active 13 DOM
-
2026-06-03days on market $154,900 Active 12 DOM
-
2026-06-02days on market $154,900 Active 11 DOM
-
2026-06-01days on market $154,900 Active 10 DOM
-
2026-05-31days on market $154,900 Active 9 DOM
-
2026-05-22$154,900 Active
-
2012-07-03soldstatus $76,500
-
2012-06-22soldstatus $76,500 377-char remark
Show marketing remark (377 chars)
Enjoy maintenance free living in this spacious and spotless condo. Kitchen/hall flooring and carpet throughout replaced in 07, Freshly painted, some new lighting, Plantation blinds, kitchen & bath sink faucets replaced, Relax on covered balcony overlooking lovely lake, wood burning fireplace for those cold evenings. Garage with opener. Close to shopping & interstate.
-
2012-03-14$79,900 377-char remark
Show marketing remark (377 chars)
Enjoy maintenance free living in this spacious and spotless condo. Kitchen/hall flooring and carpet throughout replaced in 07, Freshly painted, some new lighting, Plantation blinds, kitchen & bath sink faucets replaced, Relax on covered balcony overlooking lovely lake, wood burning fireplace for those cold evenings. Garage with opener. Close to shopping & interstate.
-
2011-09-13historical
-
2011-04-02$87,000
-
2007-06-28soldstatus $80,000
-
2007-06-22soldstatus $80,000
-
2007-03-12$89,800
-
2007-01-16historical
-
2006-07-02$101,400
-
2005-12-16soldstatus $94,000
-
2005-12-01soldstatus $94,000
-
2005-09-29$89,900
ⓘ Source: listings_history table (triggers on properties + properties_extension) + one-shot
backfill from property_details.listing_events for pre-trigger history.
Tax reassessment forecast KY · Resets to sale price
- Current annual tax
- $1,441 · $120/mo
- Projected year-2 tax
- $1,441 · $120/mo
- Expected delta
- $0/yr ($0/mo · 0.0%)
ⓘ Screening estimate from a state-policy table — verify with the county assessor before closing.
Climate risk First Street
- Flood 1/10 Low FEMA zone X (unshaded) · 0% chance over 30 yrs
- Wildfire 1/10 Low
- Heat 4/10 Moderate 7 d/yr ≥101°F today · 19 d/yr by 30 yrs out
- Wind 2/10 Low 100% chance of damaging wind over 30 yrs
- Air quality 2/10 Low 1 unhealthy d/yr today · 3 by 30 yrs out
Nearby sold comps map
Loading sold comps map…
Walkable amenities ~0.75 mi
Loading nearby amenities…
Taxation est. · year 1
- Rental income
- $20,741
- − Mortgage interest
- −$8,677
- − Property taxes
- −$1,441
- − Insurance
- −$774
- − Repairs & maintenance
- −$1,659
- − Management
- −$1,659
- − HOA
- −$5,208
- − Depreciation
- −$4,506
- Taxable loss
- −$3,183
- Est. tax savings @ 24.0%
- +$764
- After-tax cash flow
- $-21/yr
For passive investors: Depreciation is non-cash, so a rental often shows a tax loss while cash-flowing — sheltering income. Rental losses are passive: they offset passive income freely, and up to $25,000/yr can offset ordinary (W-2) income if you actively participate and your MAGI is under $100k (phasing out to $0 by $150k); unused losses carry forward. On sale, claimed depreciation is recaptured at up to 25%, and gains may owe capital-gains tax (a 1031 exchange can defer both). Figures are a year-1 estimate at your 24.0% rate — not tax advice; consult a CPA.
Schools (NCES district)
- District
- Boone County
- NCES district ID
- 2100510
- Math proficiency
- 43% ▼ -10.00%
- Reading proficiency
- 49% ▼ -12.00%
- Median HH income
- $68,096
- Composite
- 41.18/100
- National rank
- #3550
- State rank
- #12 of 165 in KY
Livability — Burlington
- Score
- 77/100
- State rank
- #83
- US rank
- #2792
Category grades
Schools grade is shown separately in the Schools card above.
Census & demographics
- Census place
- Burlington, KY
- County
- Boone County · 99,563 people
- City population
- 25,718
- Metro
- Cincinnati, OH-KY-IN
- Population (ZIP)
- 25,718
- Household income
- $112,083
- Rent vs Own
- Severe rent burden
- 399.0
Population outlook (Boone County) Hauer SSP2
- Today (2025)
- 144,066 people
- By 2030
- 152,005 · +5.5%
- By 2040
- 166,776 · +15.8%
- By 2050
- 178,974 · +24.2%
- By 2075
- 204,515 · +42.0%
- By 2100
- 215,306 · +49.4%
Race, ethnicity, and origin ACS 2023
- Neighborhood character
- Predominantly White (86%)
- Race & ethnicity
- White 86% Hispanic / Latino 6% Two or more races 5% Black 2% Asian 2%
- Hispanic origin (detail)
- Mexican 3%
- Common ancestry
- Italian 3% Serbian 3% Lithuanian 2%
- Foreign-born
- 6% · Canada
- Languages at home
- 92% English-only · Spanish 5% Other Asian/Pacific 1%
Political lean MEDSL · Boone
- 2024 margin
- Solid R (+37.2) · D 30.6% · R 67.8% · Other 1.7%
- 2008→2024 swing
- -2.7pp toward R · 2008: -34.5pp · 2024: -37.2pp
- All cycles
- 2024: R+37.2 2020: R+35.7 2016: R+41.8 2012: R+38.7 2008: R+34.5
Not yet ingested
- Civics
- —
Market trends
- HPI YoY
- ▼ -75.14%
- Current HPI
- 220.1076
- Rent YoY
- —
- Metro
- Cincinnati, OH-KY-IN
- State GDP YoY
- ▲ 1.81%
- F500 in state
- 4
Industry mix (Fortune 500 HQ in KY)
| Industry | F500 HQs | Revenue |
|---|---|---|
| Healthcare | 1 | $118B |
|
||
| Food / Beverage | 1 | $7B |
|
||
Price history
+72.3% since first listed14 events — show timeline
- 2026-05-22 Listed $154,900 NKMLS
- 2012-07-03 Sold (Public Records) $76,500 Public Records
- 2012-06-22 Sold (MLS) $76,500 NKMLS
- 2012-03-14 Listed $79,900 NKMLS
- 2011-09-13 Listing Removed — NKMLS
- 2011-04-02 Listed $87,000 NKMLS
- 2007-06-28 Sold (Public Records) $80,000 Public Records
- 2007-06-22 Sold (MLS) $80,000 NKMLS
- 2007-03-12 Listed $89,800 NKMLS
- 2007-01-16 Listing Removed — NKMLS
- 2006-07-02 Listed $101,400 NKMLS
- 2005-12-16 Sold (Public Records) $94,000 Public Records
- 2005-12-01 Sold (MLS) $94,000 NKMLS
- 2005-09-29 Listed $89,900 NKMLS
Property tax history
+4.9%/yrLatest (2025): $1,441 · +1.7% YoY. Source: county tax records.
Cash-flow waterfall
monthlySold comps — $/sqft
last 12 mo · ≤1 miLoading sold comps…