1590 Adams Blvd · Sun Prairie, MT
Flood risk 6/10 · Moderate
- FEMA flood zone
- X (shaded)
- Chance of flooding over 30 yrs
- 0.65%
- Est. flood insurance / yr
- $507 – $1,088
Fire risk 4/10 · Minor
- Est. fire insurance / yr
- $918 – $1,706
Heat risk 3/10 · Minor
- Hot days now (above 92°F)
- 7 days/yr
- Hot days in 30 yrs
- 15 days/yr
Wind risk 1/10 · Minimal
- Chance of severe wind over 30 yrs
- —
Air-quality risk 6/10 · Moderate
- Unhealthy air days now
- 10 days/yr
- Unhealthy air days in 30 yrs
- 12 days/yr
Risk factors via First Street. Map © Google.
Why this score? — see what drove the B- grade
The composite is a weighted blend of 9 inputs, each scored 0–100. Each bar is that input's sub-score; the figure is the points it added to the 100-point composite (weight × sub-score).
- Cash flow +30.0/30.0
- 1% rule +10.0/10.0
- DSCR +10.0/10.0
- ARV discount +7.5/15.0
- Livability +3.3/5.0
- Schools +2.8/10.0
- Rent growth +2.5/5.0
- Condition / age +2.5/5.0
- Appreciation +0.0/10.0
$65,000
🖨 Deal sheet 📄 Offer letter ✓ Due diligence
Listing remarks MLS
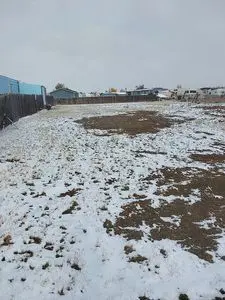
This is a completely clean lot with utilities on the property and access to high speed internet. Quiet neighborhood, across the street is a county park so no neighbors and views of the rocky mountain front. This is a quiet community that is just a ten minute drive from Great Falls but also has access to a local convenience store and some local bar and restaurants.
Key facts
- High speed internet
- Utilities access
- Built 1980
Tags
Neighborhood map
What this means for you Summary
Snapshot
- This is a 2-bed/1.0-bath other listed at $65k.
Deal economics
- At list price, monthly cash flow is $894 ($11k/yr) — positive.
- The deal already cash-flows at list — no discount required.
- Meets the 1% rule at list price ($2k rent vs $65k).
- Recommended offer: $64k (1.5% below list) — sets the bar for market timing.
Location & tenants
- Location reads 66/100 on livability (#120 in MT) — a middle-class / working-renter tenant base. Strengths: cost of living A+, housing A+, crime A; Watch: employment C-, health & safety C-, schools F.
- Great Falls H S (urban): math 27% / reading 39% proficiency, ranked #79 of 116 in MT (top 68%) — families likely to look elsewhere, expect single-tenant / working-renter base with shorter leases.
- Market conditions: 131 active listings in the ZIP; solid renter incomes; 223 units permitted in Cascade County in 2024 (37 in 5+ unit buildings).
Forward outlook
- Local home prices are declining (-3.0%/yr); year-one equity from $449 of loan paydown is wiped out by about $2k of value loss. Plan a longer hold.
- Cascade County population projected to shrink 5% by 2050 — rents likely to lag national; underwrite the cash flow, not the appreciation.
- At projected returns (-3.0% appreciation + 3.0% rent growth), your $18k cash investment doubles in ~2 years — after that, you're playing with house money.
Negotiation context
- It's been on market 24 days — a 2% lower offer ($64k) is reasonable based on typical stale-listing flexibility.
- 3 sale attempts with the ask held roughly flat each time — persistent listings suggest the price (not the market) is what's stuck; bring a comps-based counter.
Risks & watch-outs
- Climate carrying-cost: major flood risk — expect insurance premiums to compound above CPI over the hold.
Questions for the listing agent
- Is there a deadline driving the sale (1031 exchange, divorce, estate, relocation)? That informs how much negotiation room exists.
- Schools are F-rated, which usually means shorter tenancies and higher turnover. Who's the typical renter profile here, and what's been the actual vacancy rate?
- What's the average days-on-market for RENTAL listings here right now (not sales)? A rising rental-DOM trend means longer vacancies and softer asking-rent achievability than the comps imply.
- What's the recent tenant-quality profile in this submarket — average credit score on applications, eviction rate, late-payment / NSF rate, and stable-employment percentage? A property-management company in the area should have these aggregated.
- How much new for-sale + rental construction is in the pipeline within 1–3 miles? Heavy new supply typically softens prices + rents 12–24 months out; constrained supply supports both.
Investment metrics
- 1% rule
- 2.66% ✓
- Cap rate
- 22.80%
- Cash-on-cash
- 58.96%
- DSCR
- 3.62
- GRM
- 3.1
CMA / ARV
No comps found within radius.
Projected returns pro-forma
-3.0% appreciation · 3.0% rent growth · sell at horizon
- IRR
- 57.6%
- Equity multiple
- 3.55×
- Total profit
- $46,462
- Equity at exit
- $9,692
- IRR
- 62.5%
- Equity multiple
- 7.26×
- Total profit
- $113,957
- Equity at exit
- $5,620
Cash invested: $18,200 (down + closing). Projections, not guarantees.
Landlord ↔ Tenant lean methodology
- Overall (STATE)
- 82 Strongly Landlord-Friendly
- State Montana
- 82 Strongly Landlord-Friendly · R+11
- County
- — inherits STATE
- City
- — inherits STATE
ZIP-level market 59404
- Active inventory
- 131
- Price-to-rent
- 3.1×
Monthly cashflow live
- Estimated rent
- $1,728 medium interval (Pro) →
- Mortgage (P&I)
- −$341
- Tax from tax record
- −$103 /mo · $1,231/yr
- Insurance
- −$27
- HOA
- −$0
- Vacancy / Maint / Mgmt
- −$363
- Net cashflow
- $894
Break-even live
UW: 25.0% down · 7.5% · 30yr · 1.5% tax · 5.0% vac · 8.0% maint · 8.0% mgmt
Financing live
Cash to close
- Down payment
- $16,250
- Closing costs
- $1,950
- Reserves months
- —
- Total cash needed
- —
Loan-product check · same deal, 3 products live
Conventional
25% down · 7.5% · 30yr
- Down + closing
- —
- Monthly P&I
- —
- Monthly cashflow
- —
- DSCR
- —
- Eligible?
- —
Personal DTI + credit; lowest rate.
DSCR
20% down · 8.5% · 30yr
- Down + closing
- —
- Monthly P&I
- —
- Monthly cashflow
- —
- DSCR
- —
- Eligible?
- —
No personal income docs; deal must DSCR.
Hard money
10% down · 12.0% · 12mo
- Down + closing
- —
- Monthly P&I
- —
- Monthly cashflow
- —
- DSCR
- —
- Eligible?
- —
Short-term bridge; refi at stabilization.
Listing history 23 events
-
2026-06-19days on market $65,000 Active 24 DOM
-
2026-06-18days on market $65,000 Active 23 DOM
-
2026-06-17days on market $65,000 Active 22 DOM
-
2026-06-16days on market $65,000 Active 21 DOM
-
2026-06-15days on market $65,000 Active 20 DOM
-
2026-06-14days on market $65,000 Active 18 DOM
-
2026-06-13days on market $65,000 Active 17 DOM
-
2026-06-10days on market $65,000 Active 15 DOM
-
2026-06-09days on market $65,000 Active 14 DOM
-
2026-06-08days on market $65,000 Active 13 DOM
-
2026-06-07days on market $65,000 Active 12 DOM
-
2026-06-05days on market $65,000 Active 9 DOM
-
2026-06-03days on market $65,000 Active 8 DOM
-
2026-06-02days on market $65,000 Active 7 DOM
-
2026-06-01days on market $65,000 Active 6 DOM
-
2026-05-31days on market $65,000 Active 5 DOM
-
2026-05-30days on market $65,000 Active 4 DOM
-
2026-05-26$65,000 Active
-
2026-05-01historical Active Under Contract
-
2026-04-16price $70,000
-
2026-04-03$75,000 Active
-
2026-03-18$65,000 Active 366-char remark
Show marketing remark (366 chars)
This is a completely clean lot with utilities on the property and access to high speed internet. Quiet neighborhood, across the street is a county park so no neighbors and views of the rocky mountain front. This is a quiet community that is just a ten minute drive from Great Falls but also has access to a local convenience store and some local bar and restaurants.
-
1998-08-17soldstatus
ⓘ Source: listings_history table (triggers on properties + properties_extension) + one-shot
backfill from property_details.listing_events for pre-trigger history.
Tax reassessment forecast MT · Resets to sale price
- Current annual tax
- $1,231 · $103/mo
- Projected year-2 tax
- $1,231 · $103/mo
- Expected delta
- $0/yr ($0/mo · 0.0%)
ⓘ Screening estimate from a state-policy table — verify with the county assessor before closing.
Climate risk First Street
- Flood 6/10 Major FEMA zone X (shaded) · 65% chance over 30 yrs
- Wildfire 4/10 Moderate
- Heat 3/10 Moderate 7 d/yr ≥92°F today · 15 d/yr by 30 yrs out
- Wind 1/10 Low
- Air quality 6/10 Major 10 unhealthy d/yr today · 12 by 30 yrs out
Nearby sold comps map
Loading sold comps map…
Walkable amenities ~0.75 mi
Loading nearby amenities…
Taxation est. · year 1
- Rental income
- $20,730
- − Mortgage interest
- −$3,641
- − Property taxes
- −$1,231
- − Insurance
- −$325
- − Repairs & maintenance
- −$1,658
- − Management
- −$1,658
- − Depreciation
- −$1,891
- Taxable income
- $10,326
- Est. tax owed @ 24.0%
- −$2,478
- After-tax cash flow
- $8,253/yr
For passive investors: Depreciation is non-cash, so a rental often shows a tax loss while cash-flowing — sheltering income. Rental losses are passive: they offset passive income freely, and up to $25,000/yr can offset ordinary (W-2) income if you actively participate and your MAGI is under $100k (phasing out to $0 by $150k); unused losses carry forward. On sale, claimed depreciation is recaptured at up to 25%, and gains may owe capital-gains tax (a 1031 exchange can defer both). Figures are a year-1 estimate at your 24.0% rate — not tax advice; consult a CPA.
Schools (NCES district)
- District
- Great Falls H S
- NCES district ID
- 3013050
- Math proficiency
- 27% ▼ -6.00%
- Reading proficiency
- 39% ▼ -3.00%
- Median HH income
- $43,586
- Composite
- 28.03/100
- National rank
- #6846
- State rank
- #79 of 116 in MT
Livability — Sun Prairie
- Score
- 66/100
- State rank
- #120
- US rank
- #11973
Category grades
Schools grade is shown separately in the Schools card above.
Census & demographics
- Census place
- Sun Prairie, MT
- County
- Cascade County · 75,427 people
- Metro
- Great Falls, MT
- Population (ZIP)
- 28,822
- Household income
- $83,867
- Rent vs Own
- Severe rent burden
- 280.0
Population outlook (Cascade County) Hauer SSP2
- Today (2025)
- 81,936 people
- By 2030
- 81,376 · -0.7%
- By 2040
- 79,435 · -3.1%
- By 2050
- 77,906 · -4.9%
- By 2075
- 78,595 · -4.1%
- By 2100
- 79,997 · -2.4%
Race, ethnicity, and origin ACS 2023
- Neighborhood character
- Predominantly White (87%)
- Race & ethnicity
- White 87% Two or more races 5% Hispanic / Latino 3% Native American 2% Asian 1% Black 1%
- Common ancestry
- Portuguese 8% Slovak 3% Lithuanian 3%
- Foreign-born
- 2% · Canada
- Languages at home
- 97% English-only · German/W. Germanic 1% Spanish 1%
Political lean MEDSL · Cascade
- 2024 margin
- Strong R (+22.3) · D 37.3% · R 59.6% · Other 3.0%
- 2008→2024 swing
- -24.6pp toward R · 2008: 2.3pp · 2024: -22.3pp
- All cycles
- 2024: R+22.3 2020: R+19.7 2016: R+21.6 2012: R+9.1 2008: D+2.3
Not yet ingested
- Civics
- —
Market trends
- HPI YoY
- ▼ -126.73%
- Current HPI
- 208.7527
- Rent YoY
- —
- Metro
- Great Falls, MT
- State GDP YoY
- ▲ 3.41%
- F500 in state
- 2
Industry mix (Fortune 500 HQ in MT)
| Industry | F500 HQs | Revenue |
|---|---|---|
| Technology / Analytics | 1 | $2B |
|
||
Price history
+0.0% since first listed6 events — show timeline
- 2026-05-26 Listed $65,000 FSBO.com
- 2026-05-01 Contingent — MRMLS
- 2026-04-16 Price Changed $70,000 MRMLS
- 2026-04-03 Listed $75,000 MRMLS
- 2026-03-18 Listed $65,000 ForSaleByOwner.com
- 1998-08-17 Sold (Public Records) — Public Records
Property tax history
+26.2%/yrLatest (2025): $1,231 · -64.8% YoY. Source: county tax records.
Cash-flow waterfall
monthlySold comps — $/sqft
last 12 mo · ≤1 miLoading sold comps…