8413 Greenwood · California City, CA
Flood risk 1/10 · Minimal
- FEMA flood zone
- X (unshaded)
- Chance of flooding over 30 yrs
- 0.0%
- Est. flood insurance / yr
- $507 – $1,088
Fire risk 1/10 · Minimal
- Est. fire insurance / yr
- $659 – $1,223
Heat risk 8/10 · Major
- Hot days now (above 101°F)
- 6 days/yr
- Hot days in 30 yrs
- 17 days/yr
Wind risk 1/10 · Minimal
- Chance of severe wind over 30 yrs
- —
Air-quality risk 7/10 · Major
- Unhealthy air days now
- 13 days/yr
- Unhealthy air days in 30 yrs
- 17 days/yr
Risk factors via First Street. Map © Google.
Why this score? — see what drove the D+ grade
The composite is a weighted blend of 9 inputs, each scored 0–100. Each bar is that input's sub-score; the figure is the points it added to the 100-point composite (weight × sub-score).
- ARV discount +12.0/15.0
- Cash flow +10.8/30.0
- Appreciation +10.0/10.0
- Rent growth +3.9/5.0
- DSCR +3.1/10.0
- 1% rule +2.9/10.0
- Condition / age +2.5/5.0
- Livability +2.2/5.0
- Schools +2.1/10.0
$250,000
🖨 Deal sheet 📄 Offer letter ✓ Due diligence
Listing remarks MLS
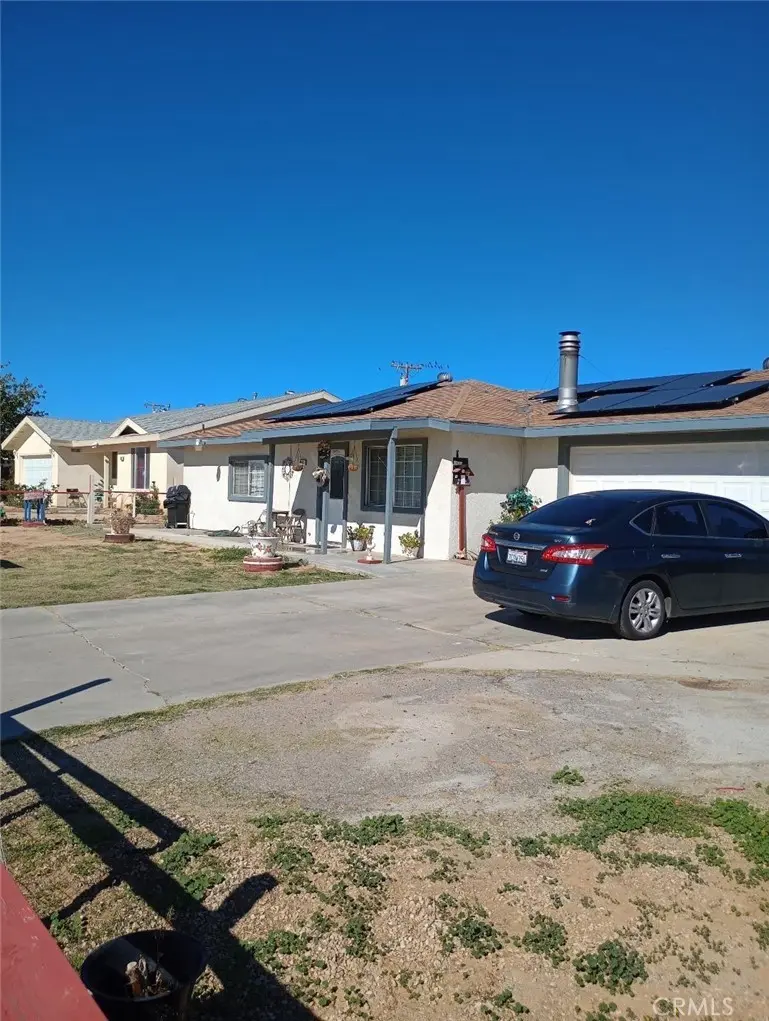
Nice and well-maintained single-story house with 3 bedrooms and 2 full bathrooms, 2 car garage, and solar panels for energy saving and low maintenance. Step into this single-story home nestled on a spacious 9,583 lot in a peacefully neighborhood of California City. This home is ideal for outdoor gatherings, and it's ready to move in.
Key facts
- Spacious lot
- Solar panels
- Outdoor gatherings
Tags
Neighborhood map
What this means for you Summary
Snapshot
- This is a 3-bed/2.0-bath single-family listed at $250k.
Deal economics
- At list price, monthly cash flow is $-114 ($-1k/yr) — negative.
- To cash-flow at today's rent, offer at most $230k (8.1% below list).
- To meet the 1% rule (rent ≥ 1% of price), the offer needs to be $196k (21.4% below list).
- Recommended offer: $196k (21.4% below list) — sets the bar for 1% rule.
Location & tenants
- Location reads 44/100 on livability (#1,329 in CA) — a working-class tenant base; expect higher turnover. Strengths: housing A+; Watch: schools F, crime F, amenities F.
- Mojave Unified (town): math 25% / reading 25% proficiency, ranked #411 of 517 in CA (top 80%) — low school quality limits family demand, transient renter base, plan for 1-2y turnover; 76% free/reduced lunch — lower-income household profile, screen leases tightly.
- Market conditions: Rents rising fast (+5.5%/yr); 703 active listings in the ZIP; 40 comparable units currently listed for rent nearby; rentals at typical pace (median 24d on market — plan ~3-4 weeks tenant-placement turnaround); 3,244 units permitted in Kern County in 2024 (73 in 5+ unit buildings).
- This rent runs 39% of the median local income ($60k/yr) — at the standard rent-burdened threshold; future hikes will face affordability resistance.
Forward outlook
- In year one you build about $27k of equity ($2k loan paydown + $25k appreciation (10.0% local appreciation)).
- Kern County population projected at +17% by 2050 — long-run rental-demand tailwind backs the buy-and-hold thesis.
- By year 2, paydown + projected appreciation supports a ~$43k cash-out refi (75% LTV) — recoverable capital for the next deal without selling this one.
Negotiation context
- It's been on market 237 days — a 12% lower offer ($220k) is reasonable based on typical stale-listing flexibility.
- 9 sale attempts since 17y ago; this cycle's ask has dropped $29k (10%) from the opening price — seller is motivated, your offer sets the floor, not the list.
Risks & watch-outs
- Climate carrying-cost: extreme-heat days projected 6→17/yr by 2055 (HVAC capex compounding) — expect insurance premiums to compound above CPI over the hold.
Questions for the listing agent
- What do current leases actually rent for vs. the listed asking? Can we see a recent rent roll and the last 12 months of T-12 income?
- It's been on market 237 days. Have you received any prior offers? Is the seller open to a 21% concession, seller financing, or rate buy-down credit?
- Why hasn't it sold? Are there any deal-killer items the seller is aware of (foundation, flood, title, zoning, code violations)?
- Is there a deadline driving the sale (1031 exchange, divorce, estate, relocation)? That informs how much negotiation room exists.
- Schools are F-rated, which usually means shorter tenancies and higher turnover. Who's the typical renter profile here, and what's been the actual vacancy rate?
- Crime grade is F in this area — have there been break-ins, vandalism, or insurance claims at this property in the last 3 years? What carrier currently insures it and at what premium?
- The area grade is low — what's the realistic commute time and amenity access for the typical tenant pool here? Any planned neighborhood developments (good or bad) we should know about?
- What's the average days-on-market for RENTAL listings here right now (not sales)? A rising rental-DOM trend means longer vacancies and softer asking-rent achievability than the comps imply.
- What's the recent tenant-quality profile in this submarket — average credit score on applications, eviction rate, late-payment / NSF rate, and stable-employment percentage? A property-management company in the area should have these aggregated.
- How much new for-sale + rental construction is in the pipeline within 1–3 miles? Heavy new supply typically softens prices + rents 12–24 months out; constrained supply supports both.
Investment metrics
- 1% rule
- 0.79% ✗
- Cap rate
- 5.75%
- Cash-on-cash
- -1.95%
- DSCR
- 0.91
- GRM
- 10.6
CMA / ARV
- ARV (median comp)
- $277,789
- List price
- $250,000
- Delta
- -10.00%
- Verdict
- FAIR
- Comps
- 20 within 1.0 mi
Show comp detail 12 sales within ~0.75 mi
| Address | Dist | Beds/Ba | Sqft | Sold | Price | $/sf | Match |
|---|---|---|---|---|---|---|---|
| 8301 Dogwood Ave | 0.22mi | 3/2.0 | 1,302 (-2%) | 0mo | $240,000 | $184 | 86 |
| 8668 S Loop Blvd | 0.25mi | 3/2.0 | 1,277 (-4%) | 1mo | $290,000 | $227 | 81 |
| 8260 Greenwood | 0.15mi | 3/2.0 | 1,432 (+8%) | 4mo | $290,000 | $203 | 77 |
| 8412 Ironwood | 0.19mi | 3/1.0 | 1,224 (-8%) | 3mo | $158,000 | $129 | 71 |
| 20201 Airway Blvd | 0.51mi | 3/2.0 | 1,311 (-1%) | 4mo | $190,000 | $145 | 71 |
| 8485 Tamarack Ave | 0.72mi | 3/2.0 | 1,377 (+4%) | 0mo | $205,000 | $149 | 60 |
| 7881 Fernwood | 0.51mi | 3/2.0 | 1,468 (+11%) | 1mo | $269,900 | $184 | 58 |
| 20100 87th | 0.58mi | 3/2.0 | 1,222 (-8%) | 3mo | $240,000 | $196 | 57 |
| 20312 Graham St | 0.42mi | 3/2.0 | 1,514 (+14%) | 0mo | $315,000 | $208 | 56 |
| 20412 90th St | 0.64mi | 3/2.0 | 1,431 (+8%) | 3mo | $250,000 | $175 | 54 |
| 8436 Walpole Ave | 0.64mi | 4/2.0 (+1) | 1,228 (-8%) | 3mo | $280,000 | $228 | 50 |
| 20024 87th | 0.61mi | 3/2.0 | 1,173 (-12%) | 2mo | $335,000 | $286 | 50 |
Match score weights: distance 35% · size 25% · config 20% · recency 20%. Top-matched comps best support the ARV.
Projected returns pro-forma
10.0% appreciation · 5.45% rent growth · sell at horizon
- IRR
- 23.6%
- Equity multiple
- 2.91×
- Total profit
- $133,852
- Equity at exit
- $225,220
- IRR
- 21.6%
- Equity multiple
- 6.87×
- Total profit
- $410,977
- Equity at exit
- $485,695
Cash invested: $70,000 (down + closing). Projections, not guarantees.
Landlord ↔ Tenant lean methodology
- Overall (STATE)
- 18 Strongly Tenant-Friendly
- State California
- 18 Strongly Tenant-Friendly · D+13
- County
- — inherits STATE
- City
- — inherits STATE
ZIP-level market 93505
- Home prices YoY
- 13.0%
- Rents YoY
- 5.5%
- Active inventory
- 703
- Price-to-rent
- 10.6×
Monthly cashflow live
- Estimated rent
- $1,964 high interval (Pro) →
- Mortgage (P&I)
- −$1,311
- Tax from tax record
- −$251 /mo · $3,007/yr
- Insurance
- −$104
- HOA
- −$0
- Vacancy / Maint / Mgmt
- −$413
- Net cashflow
- $-114
Break-even live
UW: 25.0% down · 7.5% · 30yr · 1.5% tax · 5.0% vac · 8.0% maint · 8.0% mgmt
Financing live
Cash to close
- Down payment
- $62,500
- Closing costs
- $7,500
- Reserves months
- —
- Total cash needed
- —
Loan-product check · same deal, 3 products live
Conventional
25% down · 7.5% · 30yr
- Down + closing
- —
- Monthly P&I
- —
- Monthly cashflow
- —
- DSCR
- —
- Eligible?
- —
Personal DTI + credit; lowest rate.
DSCR
20% down · 8.5% · 30yr
- Down + closing
- —
- Monthly P&I
- —
- Monthly cashflow
- —
- DSCR
- —
- Eligible?
- —
No personal income docs; deal must DSCR.
Hard money
10% down · 12.0% · 12mo
- Down + closing
- —
- Monthly P&I
- —
- Monthly cashflow
- —
- DSCR
- —
- Eligible?
- —
Short-term bridge; refi at stabilization.
Rent comps 40 comps
| Address | Beds | Baths | Sqft | Rent | $/sqft | DOM | Units | Dist |
|---|---|---|---|---|---|---|---|---|
| 20673 Medio St California City, CA | 3.0 | 2.0 | 1690 | $2,075 | $1.23 | 23d | 1 | 0.14mi |
| 8651 S Loop Blvd California City, CA | 2.0 | 1.0 | 1050 | $1,650 | $1.57 | 3d | 1 | 0.29mi |
| 20312 Dean Ct California City, CA | 3.0 | 2.0 | 1742 | $1,975 | $1.13 | 14d | 1 | 0.30mi |
| 8100 Fernwood Ave California City, CA | 3.0 | 2.0 | 1336 | $1,850 | $1.38 | 23d | 1 | 0.31mi |
| 20961 83rd St Unit 6 California City, CA | 2.0 | 2.0 | 1100 | $1,300 | $1.18 | 23d | 1 | 0.37mi |
| 8648 Lime Ave California City, CA | 3.0 | 2.0 | 1459 | $2,400 | $1.64 | 23d | 1 | 0.40mi |
| 8801 S Loop Blvd California City, CA | 3.0 | 2.0 | 1537 | $2,600 | $1.69 | 23d | 1 | 0.40mi |
| 8160 Kalmia Ave California City, CA | 3.0 | 2.0 | 1277 | $1,795 | $1.41 | 23d | 1 | 0.41mi |
| 20321 88th St California City, CA | 3.0 | 2.0 | 1176 | $2,100 | $1.79 | 23d | 1 | 0.44mi |
| 8560 Nipa Ave California City, CA | 3.0 | 2.0 | 1309 | $1,850 | $1.41 | 14d | 1 | 0.45mi |
| 8709 Xavier Ave Unit 3 California City, CA | 2.0 | 1.0 | 900 | $1,500 | $1.67 | 14d | 1 | 0.57mi |
| 8531 Columbine Ave Unit B California City, CA | 2.0 | 2.0 | 1000 | $1,300 | $1.30 | 14d | 1 | 0.58mi |
| 8318 Dogbane Ave Unit F California City, CA | 2.0 | 1.0 | 880 | $1,350 | $1.53 | 23d | 1 | 0.59mi |
| 20001 Airway Blvd California City, CA | 3.0 | 2.0 | 1050 | $2,400 | $2.29 | 23d | 1 | 0.64mi |
| 8848 Oleander Ave California City, CA | 3.0 | 2.0 | 1302 | $1,900 | $1.46 | 23d | 1 | 0.64mi |
| 21032 79th St California City, CA | 4.0 | 2.0 | 1228 | $2,100 | $1.71 | 23d | 1 | 0.69mi |
| 8512 Tamarack Ave California City, CA | 3.0 | 2.0 | 1502 | $1,875 | $1.25 | 23d | 1 | 0.75mi |
| 8816 Fuchsia Ave Unit PASSTHROUGH B California City, CA | 2.0 | 2.0 | 1077 | $1,550 | $1.44 | 14d | 1 | 0.76mi |
| 8312 Tamarack Ave California City, CA | 3.0 | 2.0 | 1539 | $1,900 | $1.23 | 23d | 1 | 0.76mi |
| 9213 Holly Ave California City, CA | 3.0 | 2.0 | 1339 | $1,900 | $1.42 | 3d | 1 | 0.81mi |
| 8449 Viburnum Ave California City, CA | 3.0 | 2.0 | 1218 | $1,695 | $1.39 | 2d | 1 | 0.83mi |
| 21231 Corwin St California City, CA | 3.0 | 2.0 | 1632 | $2,500 | $1.53 | 23d | 1 | 0.84mi |
| 8173 Viburnum Ave California City, CA | 3.0 | 2.0 | 1482 | $2,150 | $1.45 | 2d | 1 | 0.86mi |
| 8124 Underwood Ave California City, CA | 3.0 | 2.0 | 1507 | $1,850 | $1.23 | 23d | 1 | 0.87mi |
| 8260 Viburnum Ave California City, CA | 3.0 | 2.0 | 1338 | $2,000 | $1.49 | 2d | 1 | 0.87mi |
| 21001 Berry St Unit 5 California City, CA | 2.0 | 1.0 | 890 | $1,150 | $1.29 | 23d | 1 | 0.88mi |
| 7819 Walpole Ave California City, CA | 2.0 | 1.0 | 900 | $1,399 | $1.55 | 23d | 1 | 0.89mi |
| 7617 California City Blvd Apt B California City, CA | 2.0 | 1.0 | 894 | $1,225 | $1.37 | 3d | 1 | 0.91mi |
| 7733 Walpole Ave Unit A California City, CA | 3.0 | 2.0 | 1600 | $2,000 | $1.25 | 23d | 1 | 0.94mi |
| 9225 Peach Ave Unit A California City, CA | 3.0 | 2.0 | 1275 | $1,950 | $1.53 | 23d | 1 | 0.98mi |
| 9000 Underwood Ave California City, CA | 3.0 | 2.0 | 1540 | $1,900 | $1.23 | 23d | 1 | 0.99mi |
| 7343 Dogwood Ave California City, CA | 3.0 | 2.0 | 1301 | $2,250 | $1.73 | 23d | 1 | 1.09mi |
| 21411 Hacienda Blvd Unit D California City, CA | 2.0 | 2.0 | 898 | $1,475 | $1.64 | 23d | 1 | 1.17mi |
| 7317 California City Blvd California City, CA | 3.0 | 1.5 | 1228 | $1,725 | $1.40 | 19d | 1 | 1.18mi |
| 8849 Glade Ave California City, CA | 3.0 | 2.0 | 1586 | $2,380 | $1.50 | 10d | 1 | 1.20mi |
| 9610 Oleander Ave Unit A California City, CA | 2.0 | 1.0 | 1300 | $1,575 | $1.21 | 23d | 1 | 1.23mi |
| 8307 Charles Pl California City, CA | 3.0 | 2.0 | 1498 | $1,750 | $1.17 | 14d | 1 | 1.31mi |
| 8332 Rea Ave California City, CA | 4.0 | 3.0 | 1861 | $2,500 | $1.34 | 3d | 1 | 1.32mi |
| 9524 Sally Ave Unit C California City, CA | 2.0 | 1.5 | 1140 | $1,300 | $1.14 | 23d | 1 | 1.44mi |
| 9019 Evelyn Ave California City, CA | 4.0 | 2.0 | 1731 | $2,600 | $1.50 | 3d | 1 | 1.44mi |
Listing history 45 events
-
2026-06-18days on market $250,000 Active 237 DOM
-
2026-06-18remarks 699-char remark
-
2026-06-17days on market $250,000 Active 236 DOM
-
2026-06-16days on market $250,000 Active 235 DOM
-
2026-06-15days on market $250,000 Active 234 DOM
-
2026-06-14days on market $250,000 Active 232 DOM
-
2026-06-13days on market $250,000 Active 231 DOM
-
2026-06-10days on market $250,000 Active 229 DOM
-
2026-06-09days on market $250,000 Active 228 DOM
-
2026-06-08days on market $250,000 Active 227 DOM
-
2026-06-07days on market $250,000 Active 226 DOM
-
2026-06-05days on market $250,000 Active 223 DOM
-
2026-06-03days on market $250,000 Active 222 DOM
-
2026-06-03days on market $250,000 Active 221 DOM
-
2026-06-01days on market $250,000 Active 220 DOM
-
2026-05-31days on market $250,000 Active 219 DOM
-
2026-05-13price $265,000 335-char remark
Show marketing remark (335 chars)
Nice and well-maintained single-story house with 3 bedrooms and 2 full bathrooms, 2 car garage, and solar panels for energy saving and low maintenance. Step into this single-story home nestled on a spacious 9,583 lot in a peacefully neighborhood of California City. This home is ideal for outdoor gatherings, and it's ready to move in.
-
2026-04-10price $269,000 335-char remark
Show marketing remark (335 chars)
Nice and well-maintained single-story house with 3 bedrooms and 2 full bathrooms, 2 car garage, and solar panels for energy saving and low maintenance. Step into this single-story home nestled on a spacious 9,583 lot in a peacefully neighborhood of California City. This home is ideal for outdoor gatherings, and it's ready to move in.
-
2025-10-24$279,000 Active 335-char remark
Show marketing remark (335 chars)
Nice and well-maintained single-story house with 3 bedrooms and 2 full bathrooms, 2 car garage, and solar panels for energy saving and low maintenance. Step into this single-story home nestled on a spacious 9,583 lot in a peacefully neighborhood of California City. This home is ideal for outdoor gatherings, and it's ready to move in.
-
2022-06-20soldstatus $220,000 Closed Sale 828-char remark
Show marketing remark (828 chars)
Welcome to California City! This single-family home is located at 8413 Greenwood Ave, California City, CA. This property features 3 bedrooms, 2 bathrooms, and approximately 1,327 sqft of floor space. This property has a lot size of 9,583 sqft and was built in 1981. Updated carpet in all bedrooms and tile flooring throughout. Stay warm and cozy next to the fireplace and nice and cool during the summer with Central AC & Heat. Updated kitchen countertops, new water heater, new double pane windows, new toilets, light fixtures, recently painted, updated kitchen appliances, and block fence. The property will be sold with the tenant in place. New buyer to assume tenant with the sale. Perfect opportunity to add this home to your portfolio of investment properties with great cash flow. PLEASE DO NOT DISTURB THE TENANTS!
-
2022-06-20soldstatus $220,000 Closed
Show marketing remark (828 chars)
Welcome to California City! This single-family home is located at 8413 Greenwood Ave, California City, CA. This property features 3 bedrooms, 2 bathrooms, and approximately 1,327 sqft of floor space. This property has a lot size of 9,583 sqft and was built in 1981. Updated carpet in all bedrooms and tile flooring throughout. Stay warm and cozy next to the fireplace and nice and cool during the summer with Central AC & Heat. Updated kitchen countertops, new water heater, new double pane windows, new toilets, light fixtures, recently painted, updated kitchen appliances, and block fence. The property will be sold with the tenant in place. New buyer to assume tenant with the sale. Perfect opportunity to add this home to your portfolio of investment properties with great cash flow. PLEASE DO NOT DISTURB THE TENANTS!
-
2022-06-20soldstatus $220,000
Show marketing remark (828 chars)
Welcome to California City! This single-family home is located at 8413 Greenwood Ave, California City, CA. This property features 3 bedrooms, 2 bathrooms, and approximately 1,327 sqft of floor space. This property has a lot size of 9,583 sqft and was built in 1981. Updated carpet in all bedrooms and tile flooring throughout. Stay warm and cozy next to the fireplace and nice and cool during the summer with Central AC & Heat. Updated kitchen countertops, new water heater, new double pane windows, new toilets, light fixtures, recently painted, updated kitchen appliances, and block fence. The property will be sold with the tenant in place. New buyer to assume tenant with the sale. Perfect opportunity to add this home to your portfolio of investment properties with great cash flow. PLEASE DO NOT DISTURB THE TENANTS!
-
2022-06-13historical Active Under Contract 828-char remark
Show marketing remark (828 chars)
Welcome to California City! This single-family home is located at 8413 Greenwood Ave, California City, CA. This property features 3 bedrooms, 2 bathrooms, and approximately 1,327 sqft of floor space. This property has a lot size of 9,583 sqft and was built in 1981. Updated carpet in all bedrooms and tile flooring throughout. Stay warm and cozy next to the fireplace and nice and cool during the summer with Central AC & Heat. Updated kitchen countertops, new water heater, new double pane windows, new toilets, light fixtures, recently painted, updated kitchen appliances, and block fence. The property will be sold with the tenant in place. New buyer to assume tenant with the sale. Perfect opportunity to add this home to your portfolio of investment properties with great cash flow. PLEASE DO NOT DISTURB THE TENANTS!
-
2022-06-13status Pending
Show marketing remark (828 chars)
Welcome to California City! This single-family home is located at 8413 Greenwood Ave, California City, CA. This property features 3 bedrooms, 2 bathrooms, and approximately 1,327 sqft of floor space. This property has a lot size of 9,583 sqft and was built in 1981. Updated carpet in all bedrooms and tile flooring throughout. Stay warm and cozy next to the fireplace and nice and cool during the summer with Central AC & Heat. Updated kitchen countertops, new water heater, new double pane windows, new toilets, light fixtures, recently painted, updated kitchen appliances, and block fence. The property will be sold with the tenant in place. New buyer to assume tenant with the sale. Perfect opportunity to add this home to your portfolio of investment properties with great cash flow. PLEASE DO NOT DISTURB THE TENANTS!
-
2022-06-06$220,000 Active
-
2022-06-03$220,000 Active 828-char remark
Show marketing remark (828 chars)
Welcome to California City! This single-family home is located at 8413 Greenwood Ave, California City, CA. This property features 3 bedrooms, 2 bathrooms, and approximately 1,327 sqft of floor space. This property has a lot size of 9,583 sqft and was built in 1981. Updated carpet in all bedrooms and tile flooring throughout. Stay warm and cozy next to the fireplace and nice and cool during the summer with Central AC & Heat. Updated kitchen countertops, new water heater, new double pane windows, new toilets, light fixtures, recently painted, updated kitchen appliances, and block fence. The property will be sold with the tenant in place. New buyer to assume tenant with the sale. Perfect opportunity to add this home to your portfolio of investment properties with great cash flow. PLEASE DO NOT DISTURB THE TENANTS!
-
2022-06-02historical
-
2022-05-24status Active
-
2022-05-13status Pending Sale
-
2022-04-26price $230,000
-
2022-04-12status Active
-
2022-04-07$250,000 Active
-
2022-04-04historical
-
2018-11-07soldstatus $125,000 Closed Sale
-
2018-11-07soldstatus $125,000
-
2018-09-28historical Active Under Contract
-
2018-09-12$125,000 Active
-
2018-07-31historical
-
2018-04-26$130,000 Active
-
2009-06-25soldstatus $30,000
-
2009-04-03$54,900
-
2006-03-31soldstatus $190,000
-
2006-02-16soldstatus $145,000
-
1989-12-27soldstatus $85,000
-
1981-04-24soldstatus $48,500
ⓘ Source: listings_history table (triggers on properties + properties_extension) + one-shot
backfill from property_details.listing_events for pre-trigger history.
Tax reassessment forecast CA · Resets to sale price
- Current annual tax
- $3,007 · $251/mo
- Projected year-2 tax
- $3,007 · $251/mo
- Expected delta
- $0/yr ($0/mo · 0.0%)
ⓘ Screening estimate from a state-policy table — verify with the county assessor before closing.
Climate risk First Street
- Flood 1/10 Low FEMA zone X (unshaded) · 0% chance over 30 yrs
- Wildfire 1/10 Low
- Heat 8/10 Severe 6 d/yr ≥101°F today · 17 d/yr by 30 yrs out
- Wind 1/10 Low
- Air quality 7/10 Severe 13 unhealthy d/yr today · 17 by 30 yrs out
Nearby sold comps map
Loading sold comps map…
Walkable amenities ~0.75 mi
Loading nearby amenities…
Taxation est. · year 1
- Rental income
- $23,572
- − Mortgage interest
- −$14,004
- − Property taxes
- −$3,007
- − Insurance
- −$1,250
- − Repairs & maintenance
- −$1,886
- − Management
- −$1,886
- − Depreciation
- −$7,273
- Taxable loss
- −$5,733
- Est. tax savings @ 24.0%
- +$1,376
- After-tax cash flow
- $9/yr
For passive investors: Depreciation is non-cash, so a rental often shows a tax loss while cash-flowing — sheltering income. Rental losses are passive: they offset passive income freely, and up to $25,000/yr can offset ordinary (W-2) income if you actively participate and your MAGI is under $100k (phasing out to $0 by $150k); unused losses carry forward. On sale, claimed depreciation is recaptured at up to 25%, and gains may owe capital-gains tax (a 1031 exchange can defer both). Figures are a year-1 estimate at your 24.0% rate — not tax advice; consult a CPA.
Schools (NCES district)
- District
- Mojave Unified
- NCES district ID
- 0625230
- Math proficiency
- 25% ▲ 11.00%
- Reading proficiency
- 25% ▼ -1.00%
- Median HH income
- $43,017
- Composite
- 21.4/100
- National rank
- #8350
- State rank
- #411 of 517 in CA
Livability — California City
- Score
- 44/100
- State rank
- #1329
- US rank
- #26753
Category grades
Schools grade is shown separately in the Schools card above.
Census & demographics
- Census place
- California City, CA
- County
- Kern County · 710,371 people
- City population
- 14,353
- Metro
- Bakersfield, CA
- Population (ZIP)
- 14,353
- Household income
- $59,827
- Rent vs Own
- Severe rent burden
- 883.0
Population outlook (Kern County) Hauer SSP2
- Today (2025)
- 947,286 people
- By 2030
- 978,984 · +3.3%
- By 2040
- 1,045,018 · +10.3%
- By 2050
- 1,105,232 · +16.7%
- By 2075
- 1,229,538 · +29.8%
- By 2100
- 1,238,059 · +30.7%
Race, ethnicity, and origin ACS 2023
- Neighborhood character
- Highly diverse neighborhood (Simpson 0.70)
- Race & ethnicity
- Hispanic / Latino 40% White 30% Black 22% Two or more races 16% Native American 3% Asian 1%
- Hispanic origin (detail)
- Mexican 29%
- Common ancestry
- Italian 3% Lithuanian 1% Romanian 1%
- Foreign-born
- 13% · Canada, Dominican Republic
- Languages at home
- 68% English-only · Spanish 29%
Political lean MEDSL · Kern
- 2024 margin
- Strong R (+21.1) · D 38.2% · R 59.3% · Other 2.5%
- 2008→2024 swing
- -3.3pp toward R · 2008: -17.8pp · 2024: -21.1pp
- All cycles
- 2024: R+21.1 2020: R+10.2 2016: R+15.0 2012: R+20.9 2008: R+17.8
Not yet ingested
- Civics
- —
Market trends
- HPI YoY
- ▲ 46.32%
- Current HPI
- 402.4192
- Rent YoY
- ▲ 5.45%
- Metro
- Bakersfield, CA
- State GDP YoY
- ▲ 3.21%
- F500 in state
- 116
Industry mix (Fortune 500 HQ in CA)
| Industry | F500 HQs | Revenue |
|---|---|---|
| Technology | 27 | $1,492B |
|
||
| Financial Services | 3 | $174B |
|
||
| Retail | 3 | $44B |
|
||
| Insurance | 3 | $26B |
|
||
| Media / Entertainment | 2 | $115B |
|
||
| Pharmaceuticals / Biotech | 2 | $62B |
|
||
Price history
+446.4% since first listed29 events — show timeline
- 2026-05-13 Price Changed $265,000 CRMLS
- 2026-04-10 Price Changed $269,000 CRMLS
- 2025-10-24 Listed $279,000 CRMLS
- 2022-06-20 Sold (Public Records) $220,000 Public Records
- 2022-06-20 Sold (MLS) $220,000 AVMLS
- 2022-06-20 Sold (MLS) $220,000 CRMLS
- 2022-06-13 Contingent — CRMLS
- 2022-06-13 Pending — AVMLS
- 2022-06-06 Listed $220,000 AVMLS
- 2022-06-03 Listed $220,000 CRMLS
- 2022-06-02 Listing Removed — CRMLS
- 2022-05-24 Relisted — CRMLS
- 2022-05-13 Pending — CRMLS
- 2022-04-26 Price Changed $230,000 CRMLS
- 2022-04-12 Relisted — CRMLS
- 2022-04-07 Listed $250,000 CRMLS
- 2022-04-04 Coming Soon — CRMLS
- 2018-11-07 Sold (Public Records) $125,000 Public Records
- 2018-11-07 Sold (MLS) $125,000 CRMLS
- 2018-09-28 Contingent — CRMLS
- 2018-09-12 Listed $125,000 CRMLS
- 2018-07-31 Listing Removed — CRMLS
- 2018-04-26 Listed $130,000 CRMLS
- 2009-06-25 Sold (MLS) $30,000 AVMLS
- 2009-04-03 Listed $54,900 AVMLS
- 2006-03-31 Sold (Public Records) $190,000 Public Records
- 2006-02-16 Sold (Public Records) $145,000 Public Records
- 1989-12-27 Sold (Public Records) $85,000 Public Records
- 1981-04-24 Sold (Public Records) $48,500 Public Records
Property tax history
+15.1%/yrLatest (2025): $3,007 · -5.3% YoY. Source: county tax records.
Cash-flow waterfall
monthlySold comps — $/sqft
last 12 mo · ≤1 miLoading sold comps…