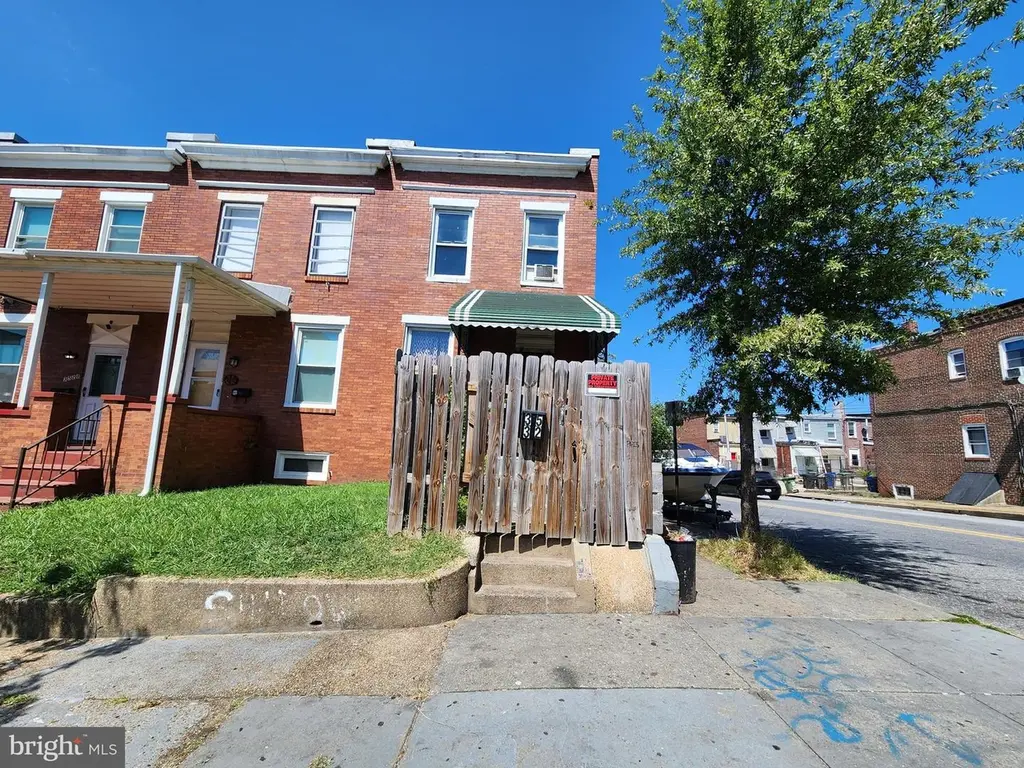
3532 Esther Pl · Baltimore, MD
Flood risk 1/10 · Minimal
- FEMA flood zone
- X (unshaded)
- Chance of flooding over 30 yrs
- 0.0%
- Est. flood insurance / yr
- $473 – $860
Fire risk 1/10 · Minimal
- Est. fire insurance / yr
- $755 – $1,403
Heat risk 8/10 · Major
- Hot days now (above 103°F)
- 7 days/yr
- Hot days in 30 yrs
- 15 days/yr
Wind risk 6/10 · Moderate
- Chance of severe wind over 30 yrs
- 27.0%
Air-quality risk 4/10 · Minor
- Unhealthy air days now
- 6 days/yr
- Unhealthy air days in 30 yrs
- 7 days/yr
Risk factors via First Street. Map © Google.
Why this score? — see what drove the B+ grade
The composite is a weighted blend of 9 inputs, each scored 0–100. Each bar is that input's sub-score; the figure is the points it added to the 100-point composite (weight × sub-score).
- Cash flow +30.0/30.0
- ARV discount +15.0/15.0
- 1% rule +10.0/10.0
- DSCR +10.0/10.0
- Livability +3.8/5.0
- Rent growth +2.8/5.0
- Condition / age +2.5/5.0
- Schools +1.0/10.0
- Appreciation +0.0/10.0
$50,000
🖨 Deal sheet 📄 Offer letter ✓ Due diligence
Listing remarks MLS
ONLINE AUCTION: This auction takes place on the Ashland Auction Group website bidding platform. Bidding begins 6/4/2026 @ 10:00 AM. Bidding ends 6/8/2026 @ 12:10 PM. The list price is the suggested opening bid. Deposit: $7,500. This two-story, porch-front end-unit rowhome is located in the Baltimore Highlands neighborhood of Baltimore City. Residents can enjoy the nearby attractions such as the Patterson Park, The Markets at Highlandtown, and John Hopkins Bayview Hospital. This property is vacant. Major traffic arteries nearby include S Highland Ave and E Fayette St.
Key facts
- Built 1900
- Listed 77 days
Neighborhood map
What this means for you Summary
Snapshot
- This is a 2-bed/1.0-bath townhouse listed at $50k.
Deal economics
- At list price, monthly cash flow is $1k ($12k/yr) — positive.
- The deal already cash-flows at list — no discount required.
- Meets the 1% rule at list price ($2k rent vs $50k).
- Recommended offer: $47k (6.0% below list) — sets the bar for market timing.
- Cap rate 30.8% vs local median 6.0% in Baltimore — top-decile yield for the area; either an underpriced asset or a hidden risk that comps aren't pricing in. Stress-test before assuming the spread holds.
Location & tenants
- Location reads 76/100 on livability (#90 in MD, #3,396 nationally) — a middle-class / working-renter tenant base. Strengths: amenities A+, commute A+, housing A+; Watch: schools D, crime F.
- Baltimore City Public Schools (urban): math 7% / reading 16% proficiency, ranked #24 of 24 in MD (top 100%) — low school quality limits family demand, transient renter base, plan for 1-2y turnover; 79% free/reduced lunch — lower-income household profile, screen leases tightly.
- Market conditions: Rents rising (+1.3%/yr); 391 active listings in the ZIP; 40 comparable units currently listed for rent nearby; rentals at typical pace (median 24d on market — plan ~3-4 weeks tenant-placement turnaround); solid renter incomes; 1,273 units permitted in Baltimore city in 2024 (1,104 in 5+ unit buildings).
Forward outlook
- Local home prices are declining (-3.0%/yr); year-one equity from $346 of loan paydown is wiped out by about $2k of value loss. Plan a longer hold.
- Baltimore County population projected to shrink 4% by 2050 — rents likely to lag national; underwrite the cash flow, not the appreciation.
- At projected returns (-3.0% appreciation + 1.3% rent growth), your $14k cash investment doubles in ~2 years — after that, you're playing with house money.
Negotiation context
- It's been on market 77 days — a 6% lower offer ($47k) is reasonable based on typical stale-listing flexibility.
- 10 sale attempts since 30y ago with the ask held roughly flat each time — persistent listings suggest the price (not the market) is what's stuck; bring a comps-based counter.
Risks & watch-outs
- Watch-outs: built in 1900 — expect roof / HVAC / electrical / plumbing capex.
- Climate carrying-cost: major wind risk, 27% chance of damaging wind over 30y; extreme-heat days projected 7→15/yr by 2055 (HVAC capex compounding) — expect insurance premiums to compound above CPI over the hold.
Questions for the listing agent
- It's been on market 77 days. Have you received any prior offers? Is the seller open to a 6% concession, seller financing, or rate buy-down credit?
- Built in 1900 — when were the roof, HVAC, electrical panel, plumbing, and water heater last replaced?
- Why hasn't it sold? Are there any deal-killer items the seller is aware of (foundation, flood, title, zoning, code violations)?
- Is there a deadline driving the sale (1031 exchange, divorce, estate, relocation)? That informs how much negotiation room exists.
- Schools are D-rated, which usually means shorter tenancies and higher turnover. Who's the typical renter profile here, and what's been the actual vacancy rate?
- Crime grade is F in this area — have there been break-ins, vandalism, or insurance claims at this property in the last 3 years? What carrier currently insures it and at what premium?
- What's the average days-on-market for RENTAL listings here right now (not sales)? A rising rental-DOM trend means longer vacancies and softer asking-rent achievability than the comps imply.
- What's the recent tenant-quality profile in this submarket — average credit score on applications, eviction rate, late-payment / NSF rate, and stable-employment percentage? A property-management company in the area should have these aggregated.
- How much new for-sale + rental construction is in the pipeline within 1–3 miles? Heavy new supply typically softens prices + rents 12–24 months out; constrained supply supports both.
Investment metrics
- 1% rule
- 3.56% ✓
- Cap rate
- 30.79%
- Cash-on-cash
- 87.49%
- DSCR
- 4.89
- GRM
- 2.3
CMA / ARV
- ARV (median comp)
- $93,252
- List price
- $50,000
- Delta
- -46.38%
- Verdict
- UNDERPRICED
- Comps
- 20 within 1.0 mi
Show comp detail 12 sales within ~0.75 mi
| Address | Dist | Beds/Ba | Sqft | Sold | Price | $/sf | Match |
|---|---|---|---|---|---|---|---|
| 3534 E Fairmount Ave | 0.04mi | 2/1.0 | 1,018 (+5%) | 2mo | $86,000 | $84 | 88 |
| 441 N East Ave | 0.28mi | 3/1.5 (+1) | 976 (+1%) | 2mo | $175,000 | $179 | 77 |
| 3500 E Fairmount Ave | 0.06mi | 2/1.0 | 1,092 (+13%) | 2mo | $107,000 | $98 | 74 |
| 530 N Curley St | 0.49mi | 3/1.0 (+1) | 960 (-1%) | 2mo | $85,000 | $89 | 69 |
| 20 N Decker Ave | 0.36mi | 3/1.0 (+1) | 1,040 (+7%) | 2mo | $149,000 | $143 | 64 |
| 309 S Fagley St | 0.45mi | 2/2.0 | 1,030 (+6%) | 1mo | $225,000 | $218 | 64 |
| 155 N Streeper St | 0.49mi | 2/2.0 | 912 (-6%) | 0mo | $220,000 | $241 | 64 |
| 735 N Lakewood Ave | 0.71mi | 3/1.5 (+1) | 970 (+0%) | 2mo | $80,000 | $82 | 58 |
| 14 S Curley St | 0.46mi | 2/1.0 | 1,092 (+13%) | 1mo | $269,000 | $246 | 56 |
| 12 Kresson St | 0.42mi | 3/1.0 (+1) | 1,092 (+13%) | 2mo | $80,000 | $73 | 52 |
| 629 N Kenwood Ave | 0.61mi | 2/1.5 | 1,100 (+14%) | 1mo | $76,500 | $70 | 46 |
| 415 N Glover St | 0.66mi | 2/2.5 | 1,092 (+13%) | 2mo | $179,000 | $164 | 40 |
Match score weights: distance 35% · size 25% · config 20% · recency 20%. Top-matched comps best support the ARV.
Projected returns pro-forma
-3.0% appreciation · 1.31% rent growth · sell at horizon
- IRR
- 86.1%
- Equity multiple
- 4.86×
- Total profit
- $53,983
- Equity at exit
- $7,455
- IRR
- 88.8%
- Equity multiple
- 9.51×
- Total profit
- $119,129
- Equity at exit
- $4,323
Cash invested: $14,000 (down + closing). Projections, not guarantees.
Landlord ↔ Tenant lean methodology
- Overall (CITY)
- 12 Strongly Tenant-Friendly
- State Maryland
- 27 Tenant-Leaning · D+14
- County
- — inherits STATE
- City Baltimore
- 12 Strongly Tenant-Friendly · D+58
ZIP-level market 21224
- Rents YoY
- 1.3%
- Active inventory
- 391
- Price-to-rent
- 2.3×
Monthly cashflow live
- Estimated rent
- $1,778 high interval (Pro) →
- Mortgage (P&I)
- −$262
- Tax from tax record
- −$101 /mo · $1,207/yr
- Insurance
- −$21
- HOA
- −$0
- Vacancy / Maint / Mgmt
- −$373
- Net cashflow
- $1,021
Break-even live
UW: 25.0% down · 7.5% · 30yr · 1.5% tax · 5.0% vac · 8.0% maint · 8.0% mgmt
Financing live
Cash to close
- Down payment
- $12,500
- Closing costs
- $1,500
- Reserves months
- —
- Total cash needed
- —
Loan-product check · same deal, 3 products live
Conventional
25% down · 7.5% · 30yr
- Down + closing
- —
- Monthly P&I
- —
- Monthly cashflow
- —
- DSCR
- —
- Eligible?
- —
Personal DTI + credit; lowest rate.
DSCR
20% down · 8.5% · 30yr
- Down + closing
- —
- Monthly P&I
- —
- Monthly cashflow
- —
- DSCR
- —
- Eligible?
- —
No personal income docs; deal must DSCR.
Hard money
10% down · 12.0% · 12mo
- Down + closing
- —
- Monthly P&I
- —
- Monthly cashflow
- —
- DSCR
- —
- Eligible?
- —
Short-term bridge; refi at stabilization.
Rent comps 40 comps
| Address | Beds | Baths | Sqft | Rent | $/sqft | DOM | Units | Dist |
|---|---|---|---|---|---|---|---|---|
| 3344 E Baltimore St Unit 2 Baltimore, MD | 1.0 | 1.0 | 545 | $1,250 | $2.29 | 43d | 1 | 0.13mi |
| 3413 Leverton Ave Baltimore, MD | 2.0 | 1.0 | 832 | $1,000 | $1.20 | 23d | 1 | 0.16mi |
| 3205 Esther Pl Baltimore, MD | 2.0 | 2.0 | 960 | $1,850 | $1.93 | 23d | 1 | 0.21mi |
| 29 N Ellwood Ave Baltimore, MD | 3.0 | 1.5 | 1100 | $2,395 | $2.18 | 23d | 1 | 0.28mi |
| 201 S Conkling St Baltimore, MD | 1.0 | 1.0 | 740 | $1,500 | $2.03 | 2d | 2 | 0.29mi |
| 203 N Ellwood Ave Unit Main Baltimore, MD | 2.0 | 2.0 | 880 | $2,200 | $2.50 | 23d | 1 | 0.29mi |
| 223 Grundy St Baltimore, MD | 2.0 | 1.0 | 864 | $1,450 | $1.68 | 23d | 1 | 0.37mi |
| 520 N Decker Ave Baltimore, MD | 2.0 | 1.0 | 1000 | $1,650 | $1.65 | 43d | 1 | 0.43mi |
| 321 Fagley St Baltimore, MD | 2.0 | 1.0 | 800 | $1,650 | $2.06 | 20d | 1 | 0.44mi |
| 400 S Conkling St Unit 3 Baltimore, MD | 1.0 | 1.0 | 700 | $1,700 | $2.43 | 43d | 1 | 0.45mi |
| 400 S Highland Ave Unit 402 Baltimore, MD | 2.0 | 1.0 | 900 | $1,700 | $1.89 | 43d | 1 | 0.46mi |
| 3232 Eastern Ave Baltimore, MD | 1.0 | 1.5 | 874 | $2,260 | $2.59 | 1d | 1 | 0.51mi |
| 3905 Bank St Baltimore, MD | 4.0 | 1.0–3.0 | 909 | $2,350 | $2.58 | 2d | 20 | 0.51mi |
| 3235 Eastern Ave Unit 2FL Baltimore, MD | 1.0 | 1.0 | 552 | $1,795 | $3.25 | 4d | 1 | 0.54mi |
| 4015 Eastern Ave Unit 2L Baltimore, MD | 3.0 | 2.0 | 1100 | $1,800 | $1.64 | 43d | 1 | 0.58mi |
| 415 N Belnord Ave Baltimore, MD | 2.0 | 1.0 | 1008 | $1,300 | $1.29 | 23d | 1 | 0.58mi |
| 3801 Fleet St Unit 209 Baltimore, MD | 1.0 | 1.5 | 814 | $1,899 | $2.33 | 43d | 1 | 0.61mi |
| 531 N Belnord Ave Baltimore, MD | 2.0 | 1.5 | 1100 | $1,700 | $1.55 | 23d | 1 | 0.62mi |
| 127 N Glover St Baltimore, MD | 2.0 | 1.5 | 1110 | $2,100 | $1.89 | 2d | 1 | 0.63mi |
| 2608 E Fayette St Unit 1 Baltimore, MD | 2.0 | 1.0 | 900 | $1,700 | $1.89 | 14d | 1 | 0.65mi |
| 415 N Glover St Baltimore, MD | 2.0 | 2.5 | 1092 | $1,600 | $1.47 | 23d | 1 | 0.66mi |
| 502 N Glover St Baltimore, MD | 2.0 | 1.5 | 827 | $1,250 | $1.51 | 20d | 1 | 0.69mi |
| 233 N Rose St Baltimore, MD | 2.0 | 2.5 | 934 | $1,750 | $1.87 | 17d | 1 | 0.72mi |
| 104 N Rose St Baltimore, MD | 3.0 | 2.0 | 936 | $2,500 | $2.67 | 43d | 1 | 0.72mi |
| 224 N Rose St Baltimore, MD | 2.0 | 2.5 | 1120 | $1,875 | $1.67 | 17d | 1 | 0.73mi |
| 643 S Potomac St Baltimore, MD | 2.0 | 1.0 | 785 | $1,650 | $2.10 | 43d | 1 | 0.74mi |
| 3200 Fait Ave Baltimore, MD | 1.0 | 1.0 | 800 | $1,700 | $2.12 | 1d | 1 | 0.74mi |
| 400 N Rose St #1 Baltimore, MD | 1.0 | 1.0 | 588 | $1,080 | $1.84 | 43d | 1 | 0.74mi |
| 2729 Ashland Ave Baltimore, MD | 3.0 | 1.0 | 1000 | $1,350 | $1.35 | 2d | 1 | 0.74mi |
| 517 N Rose St Baltimore, MD | 3.0 | 1.0 | 845 | $1,400 | $1.66 | 4d | 1 | 0.75mi |
| 402 N Milton Ave Unit 402B Baltimore, MD | 2.0 | 1.0 | 950 | $1,290 | $1.36 | 43d | 1 | 0.78mi |
| 107 N Port St Baltimore, MD | 2.0 | 2.0 | 870 | $1,995 | $2.29 | 23d | 1 | 0.78mi |
| 437 N Montford Ave Baltimore, MD | 3.0 | 1.5 | 1100 | $1,450 | $1.32 | 43d | 1 | 0.84mi |
| 3610 Dillon St Baltimore, MD | 1.0–2.0 | 1.0–2.0 | 828 | $2,820 | $3.41 | 43d | 1 | 0.84mi |
| 16 N Bradford St Baltimore, MD | 2.0 | 3.5 | 930 | $2,400 | $2.58 | 4d | 1 | 0.87mi |
| 825 S Linwood Ave Baltimore, MD | 1.0 | 1.0 | 1000 | $2,150 | $2.15 | 23d | 1 | 0.87mi |
| 720 N Port St Baltimore, MD | 2.0 | 1.0 | 950 | $1,300 | $1.37 | 43d | 1 | 0.90mi |
| 2308 Jefferson St Baltimore, MD | 3.0 | 1.0 | 907 | $1,450 | $1.60 | 43d | 1 | 0.90mi |
| 618 N Montford Ave Baltimore, MD | 3.0 | 1.0 | 1050 | $1,468 | $1.40 | 14d | 1 | 0.90mi |
| 618 N Montford Ave Baltimore, MD | 3.0 | 1.0 | 1050 | $1,468 | $1.40 | 43d | 1 | 0.90mi |
Listing history 49 events
-
2026-06-18days on market $50,000 Active 77 DOM
-
2026-06-17days on market $50,000 Active 76 DOM
-
2026-06-16days on market $50,000 Active 75 DOM
-
2026-06-15days on market $50,000 Active 74 DOM
-
2026-06-13remarks 574-char remark
-
2026-06-13days on market $50,000 Active 72 DOM
-
2026-06-09days on market $50,000 Active 68 DOM
-
2026-06-08days on market $50,000 Active 67 DOM
-
2026-06-07days on market $50,000 Active 66 DOM
-
2026-06-04days on market $50,000 Active 63 DOM
-
2026-06-03days on market $50,000 Active 62 DOM
-
2026-06-02days on market $50,000 Active 61 DOM
-
2026-06-01days on market $50,000 Active 60 DOM
-
2026-05-31days on market $50,000 Active 59 DOM
-
2026-04-02$50,000 Active 573-char remark
Show marketing remark (573 chars)
ONLINE AUCTION: This auction takes place on the Ashland Auction Group website bidding platform. Bidding begins 6/4/2026 @ 10:00 AM. Bidding ends 6/8/2026 @ 12:10 PM. The list price is the suggested opening bid. Deposit: $7,500. This two-story, porch-front end-unit rowhome is located in the Baltimore Highlands neighborhood of Baltimore City. Residents can enjoy the nearby attractions such as the Patterson Park, The Markets at Highlandtown, and John Hopkins Bayview Hospital. This property is vacant. Major traffic arteries nearby include S Highland Ave and E Fayette St.
-
2025-12-18historical
-
2025-12-13price $125,000
-
2025-08-28$70,000 Active
-
2020-02-28soldstatus $360,807
-
2015-06-26soldstatus $39,000 Sold
-
2015-06-26soldstatus $39,000
-
2014-11-15status Contingent (No Kick Out)
-
2014-11-15historical
-
2014-11-04status Active
-
2014-10-26historical Expired
-
2014-10-26status Active
-
2014-05-30status Contingent (No Kick Out)
-
2014-05-30price $30,000
-
2014-05-30price $40,000
-
2014-05-29price $39,000
-
2014-05-06status Active
-
2014-04-23historical
-
2014-03-27price $44,000
-
2014-03-25status Active
-
2014-03-18status Contingent (No Kick Out)
-
2014-02-07price $39,000
-
2014-01-10price $44,000 Active
-
2014-01-10status Active
-
2013-12-04status Contingent (No Kick Out)
-
2013-11-23price $39,816
-
2013-11-08price $49,816
-
2013-10-15price $59,816
-
2013-10-09$69,816 Active
-
2013-10-09$40,000
-
1997-09-12soldstatus $45,000
-
1996-12-31historical
-
1996-01-01
-
1994-12-16soldstatus $5
-
1994-11-15soldstatus $31,200
ⓘ Source: listings_history table (triggers on properties + properties_extension) + one-shot
backfill from property_details.listing_events for pre-trigger history.
Tax reassessment forecast MD · Partial reset (capped growth)
- Current annual tax
- $1,207 · $101/mo
- Projected year-2 tax
- $1,207 · $101/mo
- Expected delta
- $0/yr ($0/mo · 0.0%)
ⓘ Screening estimate from a state-policy table — verify with the county assessor before closing.
Climate risk First Street
- Flood 1/10 Low FEMA zone X (unshaded) · 0% chance over 30 yrs
- Wildfire 1/10 Low
- Heat 8/10 Severe 7 d/yr ≥103°F today · 15 d/yr by 30 yrs out
- Wind 6/10 Major 27% chance of damaging wind over 30 yrs
- Air quality 4/10 Moderate 6 unhealthy d/yr today · 7 by 30 yrs out
Nearby sold comps map
Loading sold comps map…
Walkable amenities ~0.75 mi
Loading nearby amenities…
Taxation est. · year 1
- Rental income
- $21,332
- − Mortgage interest
- −$2,801
- − Property taxes
- −$1,207
- − Insurance
- −$250
- − Repairs & maintenance
- −$1,707
- − Management
- −$1,707
- − Depreciation
- −$1,455
- Taxable income
- $12,206
- Est. tax owed @ 24.0%
- −$2,929
- After-tax cash flow
- $9,319/yr
For passive investors: Depreciation is non-cash, so a rental often shows a tax loss while cash-flowing — sheltering income. Rental losses are passive: they offset passive income freely, and up to $25,000/yr can offset ordinary (W-2) income if you actively participate and your MAGI is under $100k (phasing out to $0 by $150k); unused losses carry forward. On sale, claimed depreciation is recaptured at up to 25%, and gains may owe capital-gains tax (a 1031 exchange can defer both). Figures are a year-1 estimate at your 24.0% rate — not tax advice; consult a CPA.
Schools (NCES district)
- District
- Baltimore City Public Schools
- NCES district ID
- 2400090
- Math proficiency
- 7% ▼ -9.00%
- Reading proficiency
- 16% ▼ -5.00%
- Median HH income
- $42,108
- Composite
- 10.08/100
- National rank
- #9805
- State rank
- #24 of 24 in MD
Livability — Baltimore
- Score
- 76/100
- State rank
- #90
- US rank
- #3396
Category grades
Schools grade is shown separately in the Schools card above.
Census & demographics
- Census place
- Baltimore, MD
- County
- Baltimore City · 558,601 people
- City population
- 588,727
- Metro
- Baltimore-Columbia-Towson, MD
- Population (ZIP)
- 47,465
- Household income
- $89,017
- Rent vs Own
- Severe rent burden
- 1786.0
Population outlook (Baltimore County) Hauer SSP2
- Today (2025)
- 624,249 people
- By 2030
- 621,541 · -0.4%
- By 2040
- 609,756 · -2.3%
- By 2050
- 597,249 · -4.3%
- By 2075
- 552,236 · -11.5%
- By 2100
- 513,934 · -17.7%
Race, ethnicity, and origin ACS 2023
- Neighborhood character
- Diverse neighborhood (Simpson 0.62)
- Race & ethnicity
- White 55% Hispanic / Latino 21% Black 16% Two or more races 7% Asian 4%
- Hispanic origin (detail)
- Mexican 4% Puerto Rican 2% Dominican 1%
- Common ancestry
- Romanian 5% Lithuanian 2% Italian 1%
- Foreign-born
- 17% · Canada, China, Vietnam
- Languages at home
- 76% English-only · Spanish 18% Other Indo-European 2% Russian/Polish/Slavic 1%
Political lean MEDSL · Baltimore
- 2024 margin
- Solid D (+73.0) · D 85.2% · R 12.2% · Other 2.6%
- 2008→2024 swing
- -2.5pp toward R · 2008: 75.5pp · 2024: 73.0pp
- All cycles
- 2024: D+73.0 2020: D+76.6 2016: D+74.6 2012: D+76.4 2008: D+75.5
Not yet ingested
- Civics
- —
Market trends
- HPI YoY
- ▼ -332.23%
- Current HPI
- 241.284
- Rent YoY
- ▲ 1.31%
- Metro
- Baltimore-Columbia-Towson, MD
- State GDP YoY
- ▲ 2.97%
- F500 in state
- 12
Industry mix (Fortune 500 HQ in MD)
| Industry | F500 HQs | Revenue |
|---|---|---|
| Aerospace / Defense | 1 | $71B |
|
||
| Utilities | 1 | $25B |
|
||
| Hotels | 1 | $24B |
|
||
| Consumer Goods | 1 | $7B |
|
||
| Real Estate | 1 | $6B |
|
||
| Chemicals | 1 | $2B |
|
||
Price history
+60.3% since first listed35 events — show timeline
- 2026-04-02 Listed $50,000 BRIGHT MLS
- 2025-12-18 Listing Removed — BRIGHT MLS
- 2025-12-13 Price Changed $125,000 BRIGHT MLS
- 2025-08-28 Listed $70,000 BRIGHT MLS
- 2020-02-28 Sold (Public Records) $360,807 Public Records
- 2015-06-26 Sold (MLS) $39,000 BRIGHT MLS
- 2015-06-26 Sold (MLS) $39,000 MRIS
- 2014-11-15 Pending — MRIS
- 2014-11-15 Listing Removed — BRIGHT MLS
- 2014-11-04 Relisted — MRIS
- 2014-10-26 Delisted — MRIS
- 2014-10-26 Relisted — MRIS
- 2014-05-30 Price Changed $40,000 MRIS
- 2014-05-30 Price Changed $30,000 MRIS
- 2014-05-30 Pending — MRIS
- 2014-05-29 Price Changed $39,000 MRIS
- 2014-05-06 Relisted — MRIS
- 2014-04-23 Delisted — MRIS
- 2014-03-27 Price Changed $44,000 MRIS
- 2014-03-25 Relisted — MRIS
- 2014-03-18 Pending — MRIS
- 2014-02-07 Price Changed $39,000 MRIS
- 2014-01-10 Relisted — MRIS
- 2014-01-10 Price Changed $44,000 MRIS
- 2013-12-04 Pending — MRIS
- 2013-11-23 Price Changed $39,816 MRIS
- 2013-11-08 Price Changed $49,816 MRIS
- 2013-10-15 Price Changed $59,816 MRIS
- 2013-10-09 Listed $69,816 MRIS
- 2013-10-09 Listed $40,000 BRIGHT MLS
- 1997-09-12 Sold (Public Records) $45,000 Public Records
- 1996-12-31 Delisted — MRIS
- 1996-01-01 Listed — MRIS
- 1994-12-16 Sold (Public Records) $5 Public Records
- 1994-11-15 Sold (Public Records) $31,200 Public Records
Property tax history
-4.2%/yrLatest (2025): $1,207 · +8.0% YoY. Source: county tax records.
Cash-flow waterfall
monthlySold comps — $/sqft
last 12 mo · ≤1 miLoading sold comps…