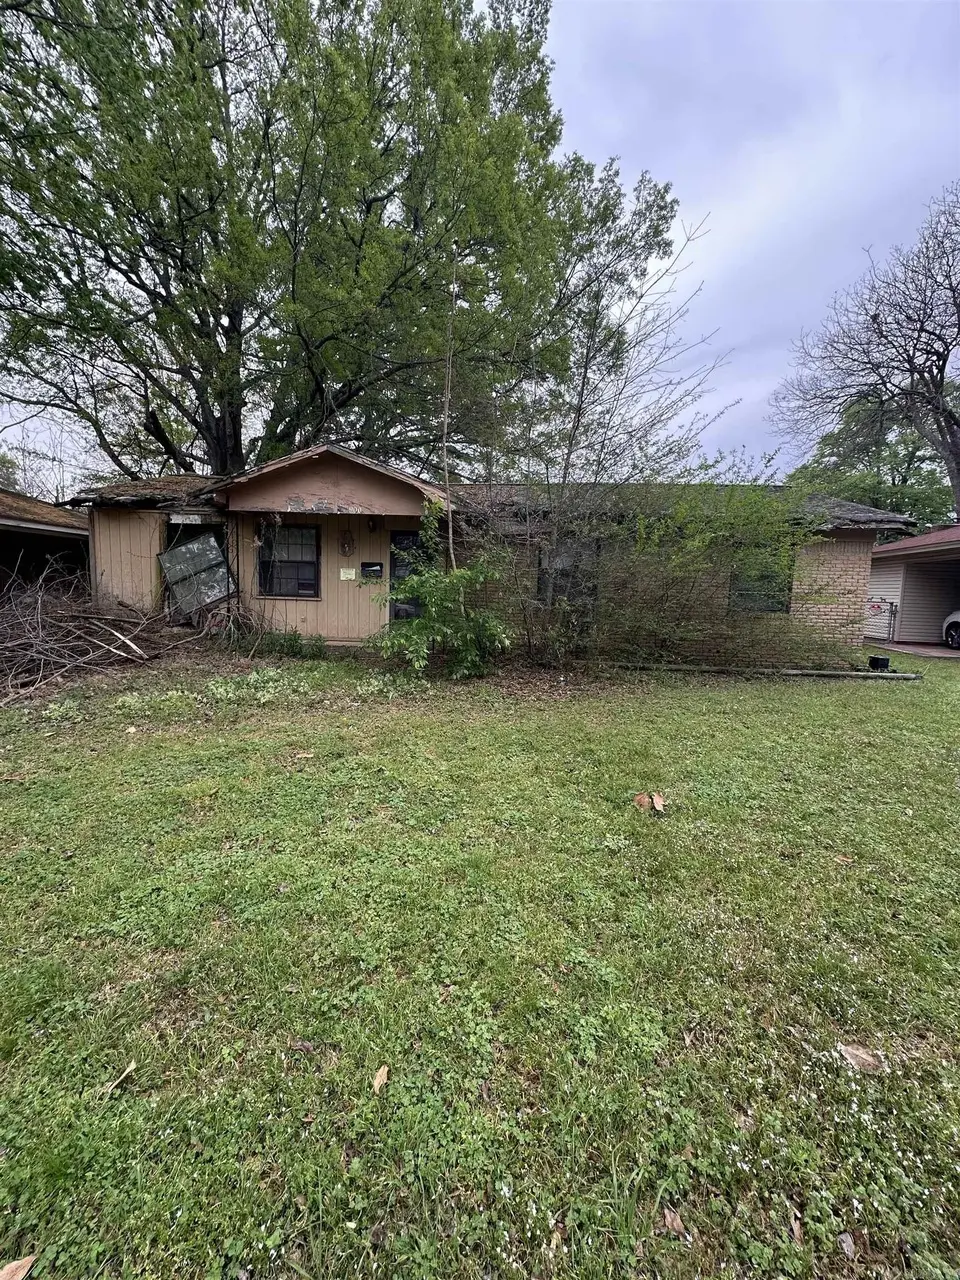
900 Barrow Dr · Pine Bluff, AR
Flood risk 6/10 · Moderate
- FEMA flood zone
- X
- Chance of flooding over 30 yrs
- 0.68%
- Est. flood insurance / yr
- $507 – $1,088
Fire risk 1/10 · Minimal
- Est. fire insurance / yr
- $1,499 – $2,785
Heat risk 6/10 · Moderate
- Hot days now (above 111°F)
- 7 days/yr
- Hot days in 30 yrs
- 19 days/yr
Wind risk 4/10 · Minor
- Chance of severe wind over 30 yrs
- 19.0%
Air-quality risk 1/10 · Minimal
- Unhealthy air days now
- 0 days/yr
- Unhealthy air days in 30 yrs
- 0 days/yr
Risk factors via First Street. Map © Google.
Why this score? — see what drove the D grade
The composite is a weighted blend of 9 inputs, each scored 0–100. Each bar is that input's sub-score; the figure is the points it added to the 100-point composite (weight × sub-score).
- Cash flow +15.0/30.0
- ARV discount +7.5/15.0
- 1% rule +5.0/10.0
- DSCR +5.0/10.0
- Appreciation +3.2/10.0
- Rent growth +2.5/5.0
- Livability +2.5/5.0
- Condition / age +2.5/5.0
- Schools +0.6/10.0
$13,900
🖨 Deal sheet (PDF) 📄 Offer letter ✓ Due diligence
Listing remarks MLS
TOTAL REMODEL!! ATTENTION INVESTORS!! 3BD, 1BA in the well established Broadmoor Sudivision. .. IDEAL FLIP OR PORTFOLIO ADD. .. . WE HAVE RENOVATION LOANS AVAIALE FOR FIRST TIME BUYERS, VETERANS OR INVESTOR INTERESTED IN THIS AMAZING DEAL. .. WILL NOT LAST LONG! ((CLEAN OUT & UP IS UNDERWAY)) * * * * * * * AGENTS SEE REMARKS * * * * * * *
Key facts
- 6,969 sq ft lot
- Built 1962
- Listed 76 days
Neighborhood map
What this means for you Summary
Snapshot
- This is a 3-bed/1.0-bath single-family listed at $14k.
Deal economics
- At list price, monthly cash flow is $471 ($6k/yr) — positive.
- The deal already cash-flows at list — no discount required.
- Meets the 1% rule at list price ($725 rent vs $14k).
- Recommended offer: $13k (6.0% below list) — sets the bar for market timing.
- Cap rate 47.0% vs local median 8.7% in Pine Bluff — top-decile yield for the area; either an underpriced asset or a hidden risk that comps aren't pricing in. Stress-test before assuming the spread holds.
Location & tenants
- Location reads 50/100 on livability (#483 in AR) — a working-class tenant base; expect higher turnover. Strengths: cost of living A+, housing A; Watch: schools F, crime F, amenities F.
- Pine Bluff School District (urban): math 6% / reading 9% proficiency, ranked #236 of 238 in AR (top 99%) — low school quality limits family demand, transient renter base, plan for 1-2y turnover; 85% free/reduced lunch — lower-income household profile, screen leases tightly.
- Market conditions: 90 active listings in the ZIP; 2 comparable units currently listed for rent nearby; 62 units permitted in Jefferson County in 2024 (0 in 5+ unit buildings).
Forward outlook
- Local home prices are declining (-3.0%/yr); year-one equity from $96 of loan paydown is wiped out by about $417 of value loss. Plan a longer hold.
- Jefferson County population projected at -33% by 2050 — secular population decline; favor cash flow + early exit over multi-decade hold.
- At projected returns (-3.0% appreciation + 3.0% rent growth), your $4k cash investment doubles in ~1 year — after that, you're playing with house money.
Negotiation context
- It's been on market 76 days — a 6% lower offer ($13k) is reasonable based on typical stale-listing flexibility.
- Current owner paid $10k; 39% above their basis — modest negotiation headroom, anchor on the comps not their cost.
Risks & watch-outs
- Climate carrying-cost: major flood risk; extreme-heat days projected 7→19/yr by 2055 (HVAC capex compounding) — expect insurance premiums to compound above CPI over the hold.
Questions for the listing agent
- It's been on market 76 days. Have you received any prior offers? Is the seller open to a 6% concession, seller financing, or rate buy-down credit?
- Built in 1962 — when were the roof, HVAC, electrical panel, plumbing, and water heater last replaced?
- Why hasn't it sold? Are there any deal-killer items the seller is aware of (foundation, flood, title, zoning, code violations)?
- Is there a deadline driving the sale (1031 exchange, divorce, estate, relocation)? That informs how much negotiation room exists.
- Schools are F-rated, which usually means shorter tenancies and higher turnover. Who's the typical renter profile here, and what's been the actual vacancy rate?
- Crime grade is F in this area — have there been break-ins, vandalism, or insurance claims at this property in the last 3 years? What carrier currently insures it and at what premium?
- The area grade is low — what's the realistic commute time and amenity access for the typical tenant pool here? Any planned neighborhood developments (good or bad) we should know about?
- What's the average days-on-market for RENTAL listings here right now (not sales)? A rising rental-DOM trend means longer vacancies and softer asking-rent achievability than the comps imply.
- What's the recent tenant-quality profile in this submarket — average credit score on applications, eviction rate, late-payment / NSF rate, and stable-employment percentage? A property-management company in the area should have these aggregated.
- How much new for-sale + rental construction is in the pipeline within 1–3 miles? Heavy new supply typically softens prices + rents 12–24 months out; constrained supply supports both.
Investment metrics
- 1% rule
- 5.22% ✓
- Cap rate
- 46.98%
- Cash-on-cash
- 145.32%
- DSCR
- 7.47
- GRM
- 1.6
CMA / ARV
- ARV (median comp)
- $81,816
- List price
- $13,900
- Delta
- -83.01%
- Verdict
- UNDERPRICED
- Comps
- 20 within 1.0 mi
Show comp detail 8 sales within ~0.75 mi
| Address | Dist | Beds/Ba | Sqft | Sold | Price | $/sf | Match |
|---|---|---|---|---|---|---|---|
| 1004 Bloomfield Dr | 0.10mi | 3/1.0 | 912 (-3%) | 16mo | $22,000 | $24 | 78 |
| 1411 Bailey St | 0.37mi | 3/1.0 | 972 (+4%) | 15mo | $53,000 | $55 | 64 |
| 1306 Boston Dr | 0.33mi | 3/1.0 | 875 (-6%) | 12mo | $70,000 | $80 | 64 |
| 2706 Claremont St | 0.50mi | 3/1.0 | 962 (+3%) | 12mo | $73,000 | $76 | 62 |
| 1203 Brentwood Dr | 0.23mi | 3/1.5 | 1,035 (+11%) | 19mo | $104,500 | $101 | 54 |
| 2805 Belmoor Dr | 0.57mi | 3/1.0 | 1,026 (+10%) | 11mo | $55,000 | $54 | 48 |
| 1703 Belmoor Dr | 0.46mi | 3/1.0 | 1,045 (+12%) | 23mo | $74,000 | $71 | 40 |
| 5801,05,07 Womack | 0.64mi | 2/1.0 (-1) | 1,024 (+9%) | 13mo | $15,000 | $15 | 38 |
Match score weights: distance 35% · size 25% · config 20% · recency 20%. Top-matched comps best support the ARV.
Projected returns pro-forma
-3.0% appreciation · 3.0% rent growth · sell at horizon
- IRR
- —
- Equity multiple
- 8.14×
- Total profit
- $27,780
- Equity at exit
- $2,073
- IRR
- —
- Equity multiple
- 17.16×
- Total profit
- $62,903
- Equity at exit
- $1,202
Cash invested: $3,892 (down + closing). Projections, not guarantees.
Landlord ↔ Tenant lean methodology
- Overall (STATE)
- 92 Strongly Landlord-Friendly
- State Arkansas
- 92 Strongly Landlord-Friendly · R+14
- County
- — inherits STATE
- City
- — inherits STATE
ZIP-level market 71601
- Home prices YoY
- -2.1%
- Active inventory
- 90
- Price-to-rent
- 1.6×
Monthly cashflow live
- Estimated rent
- $725 medium interval (Pro) →
- Mortgage (P&I)
- −$73
- Tax from tax record
- −$23 /mo · $277/yr
- Insurance
- −$6
- HOA
- −$0
- Vacancy / Maint / Mgmt
- −$152
- Net cashflow
- $471
Break-even live
Sensitivity live
| Price | -10% $479 | -5% $475 | +0% $471 | +5% $467 | +10% $463 |
|---|---|---|---|---|---|
| Rent | -10% $414 | -5% $443 | +0% $471 | +5% $500 | +10% $529 |
| Rate | -1.0pp $478 | -0.5pp $475 | base $471 | +0.5pp $468 | +1.0pp $464 |
UW: 25.0% down · 7.5% · 30yr · 1.5% tax · 5.0% vac · 8.0% maint · 8.0% mgmt
Financing live
Cash to close
- Down payment
- $3,475
- Closing costs
- $417
- Reserves months
- —
- Total cash needed
- —
Loan-product check · same deal, 3 products live
Conventional
25% down · 7.5% · 30yr
- Down + closing
- —
- Monthly P&I
- —
- Monthly cashflow
- —
- DSCR
- —
- Eligible?
- —
Personal DTI + credit; lowest rate.
DSCR
20% down · 8.5% · 30yr
- Down + closing
- —
- Monthly P&I
- —
- Monthly cashflow
- —
- DSCR
- —
- Eligible?
- —
No personal income docs; deal must DSCR.
Hard money
10% down · 12.0% · 12mo
- Down + closing
- —
- Monthly P&I
- —
- Monthly cashflow
- —
- DSCR
- —
- Eligible?
- —
Short-term bridge; refi at stabilization.
Rent comps 2 comps
| Address | Beds | Baths | Sqft | Rent | $/sqft | DOM | Units | Dist |
|---|---|---|---|---|---|---|---|---|
| 6 Duplexes Pine Bluff, AR | 2.0 | 1.5–2.0 | 858 | $772 | $0.90 | 44d | 5 | 1.37mi |
| 301 W 11th Ave Unit 1 Pine Bluff, AR | 2.0 | 1.0 | 858 | $675 | $0.79 | 44d | 1 | 1.46mi |
Listing history 20 events
-
2026-06-21days on market $13,900 Active 76 DOM
-
2026-06-19days on market $13,900 Active 74 DOM
-
2026-06-18days on market $13,900 Active 73 DOM
-
2026-06-17days on market $13,900 Active 72 DOM
-
2026-06-16days on market $13,900 Active 71 DOM
-
2026-06-15days on market $13,900 Active 70 DOM
-
2026-06-14days on market $13,900 Active 68 DOM
-
2026-06-12days on market $13,900 Active 67 DOM
-
2026-06-09days on market $13,900 Active 64 DOM
-
2026-06-08days on market $13,900 Active 63 DOM
-
2026-06-07days on market $13,900 Active 62 DOM
-
2026-06-05days on market $13,900 Active 59 DOM
-
2026-06-03days on market $13,900 Active 58 DOM
-
2026-06-02days on market $13,900 Active 57 DOM
-
2026-06-01days on market $13,900 Active 56 DOM
-
2026-05-31days on market $13,900 Active 55 DOM
-
2026-05-30days on market $13,900 Active 54 DOM
-
2026-04-16price $13,900 359-char remark
Show marketing remark (359 chars)
TOTAL REMODEL!! ATTENTION INVESTORS!! 3BD, 1BA in the well established Broadmoor Sudivision. .. IDEAL FLIP OR PORTFOLIO ADD. .. . WE HAVE RENOVATION LOANS AVAIALE FOR FIRST TIME BUYERS, VETERANS OR INVESTOR INTERESTED IN THIS AMAZING DEAL. .. WILL NOT LAST LONG! ((CLEAN OUT & UP IS UNDERWAY)) * * * * * * * AGENTS SEE REMARKS * * * * * * *
-
2026-04-06$17,900 New Listing 359-char remark
Show marketing remark (359 chars)
TOTAL REMODEL!! ATTENTION INVESTORS!! 3BD, 1BA in the well established Broadmoor Sudivision. .. IDEAL FLIP OR PORTFOLIO ADD. .. . WE HAVE RENOVATION LOANS AVAIALE FOR FIRST TIME BUYERS, VETERANS OR INVESTOR INTERESTED IN THIS AMAZING DEAL. .. WILL NOT LAST LONG! ((CLEAN OUT & UP IS UNDERWAY)) * * * * * * * AGENTS SEE REMARKS * * * * * * *
-
2007-08-15soldstatus $10,000
ⓘ Source: listings_history table (triggers on properties + properties_extension) + one-shot
backfill from property_details.listing_events for pre-trigger history.
Tax reassessment forecast AR · Resets to sale price
- Current annual tax
- $277 · $23/mo
- Projected year-2 tax
- $277 · $23/mo
- Expected delta
- $0/yr ($0/mo · 0.0%)
ⓘ Screening estimate from a state-policy table — verify with the county assessor before closing.
Climate risk First Street
- Flood 6/10 Major FEMA zone X · 68% chance over 30 yrs
- Wildfire 1/10 Low
- Heat 6/10 Major 7 d/yr ≥111°F today · 19 d/yr by 30 yrs out
- Wind 4/10 Moderate 19% chance of damaging wind over 30 yrs
- Air quality 1/10 Low 0 unhealthy d/yr today · 0 by 30 yrs out
Nearby sold comps map
Loading sold comps map…
Walkable amenities ~0.75 mi
Loading nearby amenities…
Taxation est. · year 1
- Rental income
- $8,705
- − Mortgage interest
- −$779
- − Property taxes
- −$277
- − Insurance
- −$70
- − Repairs & maintenance
- −$696
- − Management
- −$696
- − Depreciation
- −$404
- Taxable income
- $5,783
- Est. tax owed @ 24.0%
- −$1,388
- After-tax cash flow
- $4,268/yr
For passive investors: Depreciation is non-cash, so a rental often shows a tax loss while cash-flowing — sheltering income. Rental losses are passive: they offset passive income freely, and up to $25,000/yr can offset ordinary (W-2) income if you actively participate and your MAGI is under $100k (phasing out to $0 by $150k); unused losses carry forward. On sale, claimed depreciation is recaptured at up to 25%, and gains may owe capital-gains tax (a 1031 exchange can defer both). Figures are a year-1 estimate at your 24.0% rate — not tax advice; consult a CPA.
Schools (NCES district)
- District
- Pine Bluff School District
- NCES district ID
- 0500026
- Math proficiency
- 6% ▼ -9.00%
- Reading proficiency
- 9% ▼ -7.00%
- Median HH income
- $32,374
- Composite
- 5.86/100
- National rank
- #10014
- State rank
- #236 of 238 in AR
Livability — Pine Bluff
- Score
- 50/100
- State rank
- #483
- US rank
- #25645
Category grades
Schools grade is shown separately in the Schools card above.
Census & demographics
- Census place
- Pine Bluff, AR
- City population
- 29,578
- Population (ZIP)
- 13,981
Population outlook (Jefferson County) Hauer SSP2
- Today (2025)
- 63,110 people
- By 2030
- 58,519 · -7.3%
- By 2040
- 49,740 · -21.2%
- By 2050
- 42,331 · -32.9%
- By 2075
- 29,591 · -53.1%
- By 2100
- 21,047 · -66.7%
Race, ethnicity, and origin ACS 2023
- Neighborhood character
- Predominantly Black (81%)
- Race & ethnicity
- Black 81% White 13% Two or more races 4% Hispanic / Latino 2%
- Foreign-born
- 1% · Canada
- Languages at home
- 97% English-only · Spanish 2%
Political lean MEDSL · Jefferson
- 2024 margin
- Strong D (+20.1) · D 59.2% · R 39.2% · Other 1.6%
- 2008→2024 swing
- -6.2pp toward R · 2008: 26.3pp · 2024: 20.1pp
- All cycles
- 2024: D+20.1 2020: D+21.7 2016: D+25.3 2012: D+29.0 2008: D+26.3
Not yet ingested
- Civics
- —
Market trends
- HPI YoY
- ▼ -3.51%
- Current HPI
- 160.3064
- Rent YoY
- —
- Metro
- —
- State GDP YoY
- ▲ 3.80%
- F500 in state
- 10
Industry mix (Fortune 500 HQ in AR)
| Industry | F500 HQs | Revenue |
|---|---|---|
| Retail | 1 | $681B |
|
||
| Food / Agriculture | 1 | $53B |
|
||
| Retail / Energy | 1 | $22B |
|
||
| Transportation / Logistics | 1 | $12B |
|
||
| Energy | 1 | $4B |
|
||
Price history
+39.0% since first listed3 events — show timeline
- 2026-04-16 Price Changed $13,900 CARMLS
- 2026-04-06 Listed $17,900 CARMLS
- 2007-08-15 Sold (Public Records) $10,000 Public Records
Property tax history
-1.1%/yrLatest (2025): $277 · +0.3% YoY. Source: county tax records.
Cash-flow waterfall
monthlySold comps — $/sqft
last 12 mo · ≤1 miLoading sold comps…