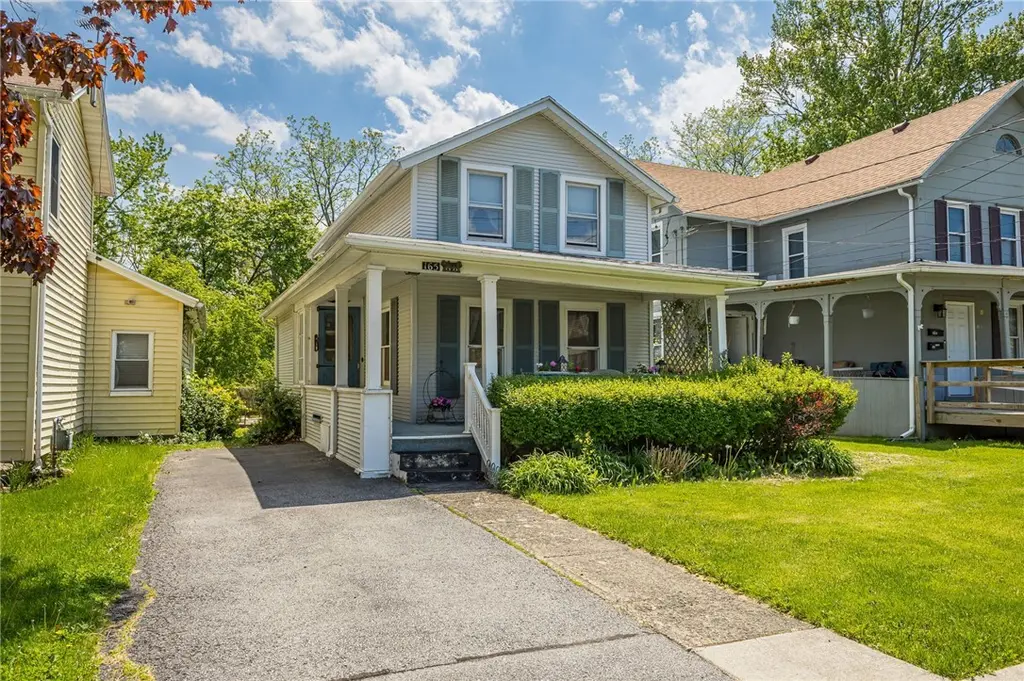
165 Bristol St · Canandaigua, NY
Flood risk 1/10 · Minimal
- FEMA flood zone
- X
- Chance of flooding over 30 yrs
- 0.0%
- Est. flood insurance / yr
- $473 – $860
Fire risk 1/10 · Minimal
- Est. fire insurance / yr
- $691 – $1,283
Heat risk 2/10 · Minimal
- Hot days now (above 96°F)
- 7 days/yr
- Hot days in 30 yrs
- 16 days/yr
Wind risk 1/10 · Minimal
- Chance of severe wind over 30 yrs
- —
Air-quality risk 2/10 · Minimal
- Unhealthy air days now
- 0 days/yr
- Unhealthy air days in 30 yrs
- 1 days/yr
Risk factors via First Street. Map © Google.
Why this score? — see what drove the B grade
The composite is a weighted blend of 9 inputs, each scored 0–100. Each bar is that input's sub-score; the figure is the points it added to the 100-point composite (weight × sub-score).
- Cash flow +25.5/30.0
- ARV discount +15.0/15.0
- DSCR +8.4/10.0
- 1% rule +7.0/10.0
- Schools +4.7/10.0
- Rent growth +4.6/5.0
- Livability +3.8/5.0
- Condition / age +2.5/5.0
- Appreciation +0.0/10.0
$129,900
🖨 Deal sheet 📄 Offer letter ✓ Due diligence
Listing remarks
Lovingly maintained by the same family for over 80 years, this charming Canandaigua Cape Cod is full of warmth, character and opportunity! Just steps from historic Main Street with restaurants, shops and only minutes to Canandaigua Lake! Situated on a sidewalk lined street with terrific curb appeal, the welcoming wraparound front porch is the perfect spot for a morning coffee or relaxing summer evening. Step inside to the spacious open concept main living space featuring a large living room with electric fireplace flowing seamlessly into the formal dining room and eat-in kitchen. Tons of original charm and character shine throughout the home! The main floor bedroom with closet and vaulted c
Key facts
- Newer furnace
- Newer roof
- Electric fireplace
Tags
Property features AI
Exterior
- Parking: No garage
- Utilities: High-speed internet available; Public water (connected); Sewer connected; Circuit breaker electric
- Home design: One story; Vinyl siding; Resale property
- Construction: Stone foundation; Vinyl siding
- Exterior features: Blacktop driveway; Deck; Fully fenced yard; Covered porch
Interior
- Kitchen: Built-in range; Built-in oven; Double oven; Microwave; Range hood; Refrigerator; Exhaust fan
- Bedrooms: One main-level bedroom
- Flooring: Carpet; Laminate; Varies
- Bathrooms: One full bathroom
- Heating & cooling: Gas forced-air heating
- Interior features: Attic; Den; Separate/formal dining room; Entrance foyer; Eat-in kitchen; Separate/formal living room; Living/dining room; Natural woodwork; Convertible bedroom; Loft
- Laundry & utility: Main-level laundry; Washer; Dryer; Gas water heater
Neighborhood map
What this means for you Summary
Snapshot
- This is a 3-bed/1.0-bath single-family listed at $130k.
Deal economics
- At list price, monthly cash flow is $302 ($4k/yr) — positive.
- The deal already cash-flows at list — no discount required.
- Meets the 1% rule at list price ($2k rent vs $130k).
- Cap rate 9.1% vs local median 3.4% in Canandaigua — top-decile yield for the area; either an underpriced asset or a hidden risk that comps aren't pricing in. Stress-test before assuming the spread holds.
Location & tenants
- Location reads 75/100 on livability (#243 in NY, #3,822 nationally) — a middle-class / working-renter tenant base. Strengths: commute A+, housing A+, schools B+; Watch: employment C-, amenities F, health & safety D-.
- Canandaigua City School District (suburban): math 50% / reading 59% proficiency, ranked #305 of 590 in NY (top 52%) — acceptable for families but not a draw, mixed tenant base, ~2y average lease.
- Market conditions: Rents rising fast (+8.5%/yr); 223 active listings in the ZIP; 3 comparable units currently listed for rent nearby; rentals leasing fast (median 3d on market — plan ~1-2 weeks tenant-placement turnaround); solid renter incomes; 284 units permitted in Ontario County in 2024 (69 in 5+ unit buildings).
Forward outlook
- Local home prices are declining (-3.0%/yr); year-one equity from $898 of loan paydown is wiped out by about $4k of value loss. Plan a longer hold.
- Ontario County population projected to shrink 6% by 2050 — rents likely to lag national; underwrite the cash flow, not the appreciation.
- At projected returns (-3.0% appreciation + 8.0% rent growth), your $36k cash investment doubles in ~8 years — after that, you're playing with house money.
Negotiation context
- Only 10 days on market — expect competitive offers; lowballing is unlikely to land.
Risks & watch-outs
- Watch-outs: built in 1880 — expect roof / HVAC / electrical / plumbing capex.
Questions for the listing agent
- Built in 1880 — when were the roof, HVAC, electrical panel, plumbing, and water heater last replaced?
- Is there a deadline driving the sale (1031 exchange, divorce, estate, relocation)? That informs how much negotiation room exists.
- Schools are B-rated — typically a magnet for longer-tenancy family renters. What's the average tenant stay here, and is there a school-zone premium baked into asking?
- What's the average days-on-market for RENTAL listings here right now (not sales)? A rising rental-DOM trend means longer vacancies and softer asking-rent achievability than the comps imply.
- What's the recent tenant-quality profile in this submarket — average credit score on applications, eviction rate, late-payment / NSF rate, and stable-employment percentage? A property-management company in the area should have these aggregated.
- How much new for-sale + rental construction is in the pipeline within 1–3 miles? Heavy new supply typically softens prices + rents 12–24 months out; constrained supply supports both.
Investment metrics
- 1% rule
- 1.20% ✓
- Cap rate
- 9.08%
- Cash-on-cash
- 9.95%
- DSCR
- 1.44
- GRM
- 6.9
CMA / ARV
- ARV (on-the-fly)
- $221,536
- Comps found
- 5
Show comp detail 5 sales within ~0.75 mi
| Address | Dist | Beds/Ba | Sqft | Sold | Price | $/sf | Match |
|---|---|---|---|---|---|---|---|
| 126 Chapin St | 0.22mi | 3/1.0 | 960 (-3%) | 6mo | $214,900 | $224 | 80 |
| 178 Parrish St | 0.33mi | 2/1.0 (-1) | 988 (-0%) | 6mo | $255,000 | $258 | 75 |
| 469 S Pearl St | 0.32mi | 4/2.5 (+1) | 1,077 (+9%) | 6mo | $232,500 | $216 | 54 |
| 82 Ellis Pl | 0.24mi | 2/2.5 (-1) | 1,062 (+7%) | 20mo | $150,000 | $141 | 49 |
| 31 Highland Ter | 0.53mi | 3/1.0 | 945 (-4%) | 23mo | $255,000 | $270 | 49 |
Match score weights: distance 35% · size 25% · config 20% · recency 20%. Top-matched comps best support the ARV.
Projected returns pro-forma
-3.0% appreciation · 8.0% rent growth · sell at horizon
- IRR
- 4.3%
- Equity multiple
- 1.18×
- Total profit
- $6,450
- Equity at exit
- $19,369
- IRR
- 18.1%
- Equity multiple
- 2.87×
- Total profit
- $68,060
- Equity at exit
- $11,231
Cash invested: $36,372 (down + closing). Projections, not guarantees.
Landlord ↔ Tenant lean methodology
- Overall (STATE)
- 15 Strongly Tenant-Friendly
- State New York
- 15 Strongly Tenant-Friendly · D+10
- County
- — inherits STATE
- City
- — inherits STATE
ZIP-level market 14424
- Home prices YoY
- -21.2%
- Rents YoY
- 8.5%
- Active inventory
- 223
- Price-to-rent
- 6.9×
Monthly cashflow live
- Estimated rent
- $1,560 medium interval (Pro) →
- Mortgage (P&I)
- −$681
- Tax from tax record
- −$196 /mo · $2,348/yr
- Insurance
- −$54
- HOA
- −$0
- Vacancy / Maint / Mgmt
- −$328
- Net cashflow
- $302
Break-even live
UW: 25.0% down · 7.5% · 30yr · 1.5% tax · 5.0% vac · 8.0% maint · 8.0% mgmt
Financing live
Cash to close
- Down payment
- $32,475
- Closing costs
- $3,897
- Reserves months
- —
- Total cash needed
- —
Loan-product check · same deal, 3 products live
Conventional
25% down · 7.5% · 30yr
- Down + closing
- —
- Monthly P&I
- —
- Monthly cashflow
- —
- DSCR
- —
- Eligible?
- —
Personal DTI + credit; lowest rate.
DSCR
20% down · 8.5% · 30yr
- Down + closing
- —
- Monthly P&I
- —
- Monthly cashflow
- —
- DSCR
- —
- Eligible?
- —
No personal income docs; deal must DSCR.
Hard money
10% down · 12.0% · 12mo
- Down + closing
- —
- Monthly P&I
- —
- Monthly cashflow
- —
- DSCR
- —
- Eligible?
- —
Short-term bridge; refi at stabilization.
Rent comps 3 comps
| Address | Beds | Baths | Sqft | Rent | $/sqft | DOM | Units | Dist |
|---|---|---|---|---|---|---|---|---|
| 223 Bristol St Canandaigua, NY | 2.0 | 1.0 | 750 | $1,450 | $1.93 | 2d | 2 | 0.18mi |
| 69 Parrish St Unit 5 Canandaigua, NY | 2.0 | 1.0 | 860 | $1,350 | $1.57 | 18d | 1 | 0.45mi |
| 79 Saltonstall St Canandaigua, NY | 2.0 | 1.0 | 1000 | $1,290 | $1.29 | 3d | 1 | 0.60mi |
Listing history 2 events
-
2026-05-31status $129,900 Pending 10 DOM
-
2026-05-20$129,900 Active
ⓘ Source: listings_history table (triggers on properties + properties_extension) + one-shot
backfill from property_details.listing_events for pre-trigger history.
Tax reassessment forecast NY · Partial reset (capped growth)
- Current annual tax
- $2,348 · $196/mo
- Projected year-2 tax
- $2,348 · $196/mo
- Expected delta
- $0/yr ($0/mo · 0.0%)
ⓘ Screening estimate from a state-policy table — verify with the county assessor before closing.
Climate risk First Street
- Flood 1/10 Low FEMA zone X · 0% chance over 30 yrs
- Wildfire 1/10 Low
- Heat 2/10 Low 7 d/yr ≥96°F today · 16 d/yr by 30 yrs out
- Wind 1/10 Low
- Air quality 2/10 Low 0 unhealthy d/yr today · 1 by 30 yrs out
Nearby sold comps map
Loading sold comps map…
Walkable amenities ~0.75 mi
Loading nearby amenities…
Taxation est. · year 1
- Rental income
- $18,723
- − Mortgage interest
- −$7,276
- − Property taxes
- −$2,348
- − Insurance
- −$650
- − Repairs & maintenance
- −$1,498
- − Management
- −$1,498
- − Depreciation
- −$3,779
- Taxable income
- $1,675
- Est. tax owed @ 24.0%
- −$402
- After-tax cash flow
- $3,217/yr
For passive investors: Depreciation is non-cash, so a rental often shows a tax loss while cash-flowing — sheltering income. Rental losses are passive: they offset passive income freely, and up to $25,000/yr can offset ordinary (W-2) income if you actively participate and your MAGI is under $100k (phasing out to $0 by $150k); unused losses carry forward. On sale, claimed depreciation is recaptured at up to 25%, and gains may owe capital-gains tax (a 1031 exchange can defer both). Figures are a year-1 estimate at your 24.0% rate — not tax advice; consult a CPA.
Schools (NCES district)
- District
- Canandaigua City School District
- NCES district ID
- 3606330
- Math proficiency
- 50% ▼ -10.00%
- Reading proficiency
- 59% ▲ 4.00%
- Median HH income
- $56,375
- Composite
- 47.09/100
- National rank
- #2335
- State rank
- #305 of 590 in NY
Livability — Canandaigua
- Score
- 75/100
- State rank
- #243
- US rank
- #3822
Category grades
Schools grade is shown separately in the Schools card above.
Census & demographics
- Census place
- Canandaigua, NY
- County
- Ontario County · 58,989 people
- City population
- 28,786
- Metro
- Rochester, NY
- Population (ZIP)
- 28,786
- Household income
- $79,778
- Rent vs Own
- Severe rent burden
- 737.0
Population outlook (Ontario County) Hauer SSP2
- Today (2025)
- 111,230 people
- By 2030
- 111,401 · +0.2%
- By 2040
- 109,535 · -1.5%
- By 2050
- 104,895 · -5.7%
- By 2075
- 92,999 · -16.4%
- By 2100
- 73,723 · -33.7%
Race, ethnicity, and origin ACS 2023
- Neighborhood character
- Predominantly White (90%)
- Race & ethnicity
- White 90% Hispanic / Latino 5% Two or more races 5% Black 1%
- Common ancestry
- Romanian 4% Iranian 4% Slovak 3%
- Foreign-born
- 3% · Canada
- Languages at home
- 94% English-only · Spanish 3% German/W. Germanic 1% Arabic 1%
Political lean MEDSL · Ontario
- 2024 margin
- Toss-up / Even · D 49.4% · R 50.6%
- 2008→2024 swing
- -1.0pp toward R · 2008: -0.1pp · 2024: -1.2pp
- All cycles
- 2024: R+1.2 2020: R+0.0 2016: R+8.6 2012: R+1.6 2008: R+0.1
Not yet ingested
- Civics
- —
Market trends
- HPI YoY
- ▼ -70.94%
- Current HPI
- 263.755
- Rent YoY
- ▲ 8.46%
- Metro
- Rochester, NY
- State GDP YoY
- ▲ 2.60%
- F500 in state
- 92
Industry mix (Fortune 500 HQ in NY)
| Industry | F500 HQs | Revenue |
|---|---|---|
| Financial Services | 10 | $950B |
|
||
| Consumer Goods | 9 | $162B |
|
||
| Insurance | 4 | $225B |
|
||
| Telecommunications | 2 | $144B |
|
||
| Pharmaceuticals | 2 | $112B |
|
||
| Media / Entertainment | 2 | $69B |
|
||
Price history
1 event — show timeline
- 2026-05-20 Listed $129,900 UNYREIS
Property tax history
+64.3%/yrLatest (2025): $2,348 · -2.2% YoY. Source: county tax records.
Cash-flow waterfall
monthlySold comps — $/sqft
last 12 mo · ≤1 miLoading sold comps…