120 Violet Sylph · Castroville, TX
Flood risk No data
- FEMA flood zone
- —
- Chance of flooding over 30 yrs
- —
- Est. flood insurance / yr
- —
Fire risk No data
- Est. fire insurance / yr
- —
Heat risk No data
- Hot days now (above threshold)
- —
- Hot days in 30 yrs
- —
Wind risk No data
- Chance of severe wind over 30 yrs
- —
Air-quality risk No data
- Unhealthy air days now
- —
- Unhealthy air days in 30 yrs
- —
Risk factors via First Street. Map © Google.
Why this score? — see what drove the D- grade
The composite is a weighted blend of 9 inputs, each scored 0–100. Each bar is that input's sub-score; the figure is the points it added to the 100-point composite (weight × sub-score).
- ARV discount +15.0/15.0
- Cash flow +7.6/30.0
- Schools +4.4/10.0
- Livability +3.7/5.0
- 1% rule +2.5/10.0
- Condition / age +2.5/5.0
- Rent growth +2.2/5.0
- DSCR +1.7/10.0
- Appreciation +0.0/10.0
$319,950
🖨 Deal sheet (PDF) 📄 Offer letter ✓ Due diligence
Listing remarks
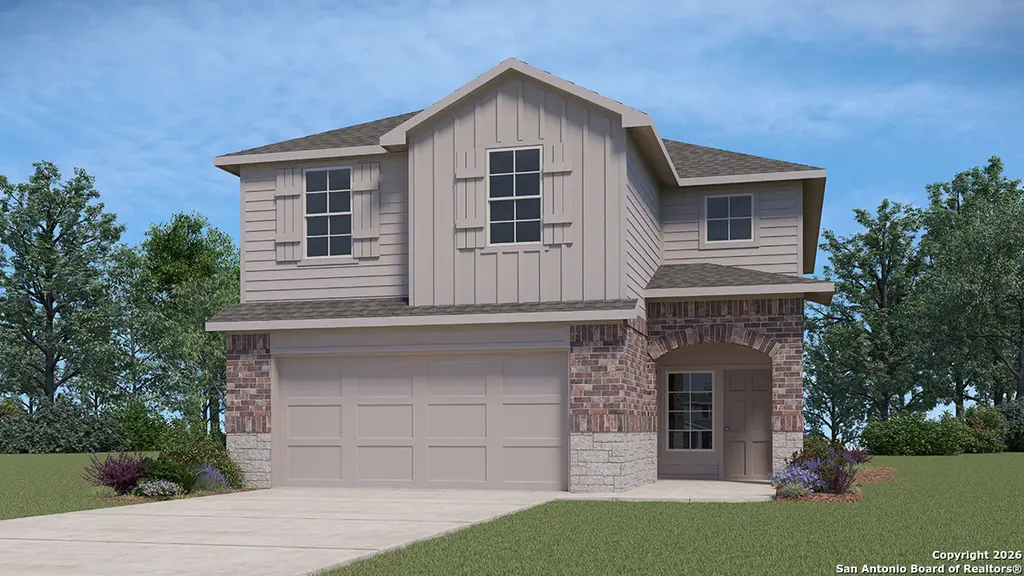
Welcome to The Kate floor plan, a two-story home located in Redbird Ranch in San Antonio, TX. This home features 2 classic front exteriors, 4 bedrooms, 2.5 baths, a spacious 2-car garage and 2223 square feet of living space. An arched, covered patio (per plan) opens to the gourmet kitchen which includes quartz or granite counter tops, stainless steel appliances and shaker style cabinets. The Kate is an open concept floorplan with the kitchen island overlooking a dining nook and living room so you'll never miss a moment. This home is unique in that all bedrooms are located upstairs, along with a loft and utility room. If entertaining downstairs and maintaining a private retreat upstairs is y
Key facts
- Arched covered patio
- Gourmet kitchen
- 4,791 sq ft lot
Tags
Property features AI
Finance
- Other: Possession at closing/funding; Sale status: For Sale
- Financial info: Down payment resource not available
- HOA & community: Mandatory HOA; HOA fee $720 annually; Association transfer fee $170; Community amenities: pool, tennis, clubhouse, park/playground, jogging trails, sports court
Exterior
- Parking: 2-car garage
- Security: Pre-wired for security
- Utilities: Water service: SAWS; Sewer service: SAWS; Gas supplier: CPS; Electricity supplier: CPS; Garbage service: TIGER; HERS rated (green certification)
- Home design: New construction by D.R. Horton; Brick, stone/rock and cement fiber exterior; Slab foundation; Composition roof; Subdivision: Redbird Ranch; Approximate age: new
- Construction: Built by D.R. Horton; Slab foundation; Composition roof; Brick, stone/rock and cement fiber exterior
- Exterior features: Covered patio; Privacy fence; Sprinkler system; Double pane windows; Street paved with curbs, gutters, sidewalks and streetlights
Interior
- Kitchen: Island kitchen; Stove/Range; Gas cooking; Microwave oven; Dishwasher; Disposal; Ice maker connection; Walk-in pantry
- Bedrooms: Master bedroom on upper level with walk-in closet and full bath; Bedroom 2: 11 x 11; Bedroom 3: 12 x 10; Bedroom 4: 12 x 11; Master bedroom dimensions: 17 x 14
- Flooring: Carpeting; Vinyl flooring
- Bathrooms: 2 full bathrooms and 1 half bathroom; Master bath with shower only and single vanity; Master bath dimensions: 11 x 10
- Heating & cooling: Central heating (natural gas); Central air conditioning (1 unit)
- Interior features: Two living areas with an open floor plan; Living/dining room combination; Island kitchen with walk-in pantry; Loft; Utility room inside; All bedrooms on upper level; Cable TV available; High-speed internet available; All window coverings remain; Pre-wired for security; Gas water heater
- Laundry & utility: Washer connection; Dryer connection; Laundry located on upper level; Utility room (6 x 6) inside
Neighborhood map
What this means for you Summary
Snapshot
- This is a 4-bed/2.5-bath single-family listed at $320k.
Deal economics
- At list price, monthly cash flow is $-382 ($-5k/yr) — negative.
- To cash-flow at today's rent, offer at most $265k (17.3% below list).
- To meet the 1% rule (rent ≥ 1% of price), the offer needs to be $239k (25.2% below list).
- Recommended offer: $239k (25.2% below list) — sets the bar for 1% rule.
- Cap rate 4.9% vs local median 2.9% in Castroville — top-decile yield for the area; either an underpriced asset or a hidden risk that comps aren't pricing in. Stress-test before assuming the spread holds.
Location & tenants
- Location reads 73/100 on livability (#212 in TX) — a middle-class / working-renter tenant base. Strengths: cost of living A+, housing A+, crime B; Watch: health & safety D+, amenities F, commute F.
- Medina Valley ISD (rural): math 48% / reading 53% proficiency, ranked #148 of 826 in TX (top 18%) — acceptable for families but not a draw, mixed tenant base, ~2y average lease.
- Zoned schools: Potranco El (math 50% / reading 51%, grade D+, #833 of 4,322 statewide, top 20%, 847 students, 47% FRL); Medina Valley Middle (math 47% / reading 49%, grade C-, #400 of 1,662 statewide, top 24%, 1,029 students, 62% FRL); Medina Valley H S (math 34% / reading 55%, grade F, #652 of 1,632 statewide, top 43%, 2,147 students, 51% FRL) — zoned schools at 53% FRL track the district average.
- Market conditions: Rents soft (-1.1%/yr); 728 active listings in the ZIP; 1 comparable units currently listed for rent nearby; solid renter incomes; 102 units permitted in Medina County in 2024 (0 in 5+ unit buildings).
Forward outlook
- Local home prices are declining (-3.0%/yr); year-one equity from $2k of loan paydown is wiped out by about $10k of value loss. Plan a longer hold.
- Medina County population projected at +24% by 2050 — long-run rental-demand tailwind backs the buy-and-hold thesis.
Negotiation context
- It's been on market 54 days — a 3% lower offer ($310k) is reasonable based on typical stale-listing flexibility.
Questions for the listing agent
- What do current leases actually rent for vs. the listed asking? Can we see a recent rent roll and the last 12 months of T-12 income?
- It's been on market 54 days. Have you received any prior offers? Is the seller open to a 25% concession, seller financing, or rate buy-down credit?
- What does the HOA fee cover, when was the last increase, and are there any pending special assessments or reserve-fund shortfalls?
- Is there a deadline driving the sale (1031 exchange, divorce, estate, relocation)? That informs how much negotiation room exists.
- The area grade is low — what's the realistic commute time and amenity access for the typical tenant pool here? Any planned neighborhood developments (good or bad) we should know about?
- What's the average days-on-market for RENTAL listings here right now (not sales)? A rising rental-DOM trend means longer vacancies and softer asking-rent achievability than the comps imply.
- What's the recent tenant-quality profile in this submarket — average credit score on applications, eviction rate, late-payment / NSF rate, and stable-employment percentage? A property-management company in the area should have these aggregated.
- How much new for-sale + rental construction is in the pipeline within 1–3 miles? Heavy new supply typically softens prices + rents 12–24 months out; constrained supply supports both.
Investment metrics
- 1% rule
- 0.75% ✗
- Cap rate
- 4.86%
- Cash-on-cash
- -5.11%
- DSCR
- 0.77
- GRM
- 11.1
CMA / ARV
- ARV (median comp)
- $412,375
- List price
- $319,950
- Delta
- -22.41%
- Verdict
- UNDERPRICED
- Comps
- 20 within 1.0 mi
Show comp detail 12 sales within ~0.75 mi
| Address | Dist | Beds/Ba | Sqft | Sold | Price | $/sf | Match |
|---|---|---|---|---|---|---|---|
| 119 Mallorys Way | 0.21mi | 4/3.5 | 2,303 (+4%) | 2mo | $349,990 | $152 | 78 |
| 153 Heidi Hl | 0.28mi | 4/3.0 | 2,080 (-6%) | 4mo | $364,990 | $175 | 71 |
| 180 Heidi Hl | 0.29mi | 3/2.5 (-1) | 2,155 (-3%) | 7mo | $434,990 | $202 | 71 |
| 113 Heidi Hl | 0.25mi | 3/2.5 (-1) | 2,155 (-3%) | 10mo | $404,990 | $188 | 70 |
| 139 Annette Dr | 0.41mi | 4/3.0 | 2,334 (+5%) | 1mo | $474,990 | $204 | 70 |
| 138 Heidi Hl | 0.26mi | 3/2.5 (-1) | 1,989 (-10%) | 0mo | $344,990 | $173 | 65 |
| 293 Ainslie St W | 0.20mi | 3/2.0 (-1) | 2,041 (-8%) | 6mo | $364,990 | $179 | 65 |
| 148 Heidi Hl | 0.26mi | 3/2.0 (-1) | 2,041 (-8%) | 3mo | $389,990 | $191 | 65 |
| 303 Ainslie St W | 0.21mi | 4/3.0 | 2,495 (+12%) | 5mo | $454,990 | $182 | 64 |
| 128 Mallorys Way | 0.21mi | 3/2.0 (-1) | 2,041 (-8%) | 7mo | $359,990 | $176 | 64 |
| 169 Mallorys Way | 0.24mi | 4/3.0 | 2,536 (+14%) | 1mo | $434,990 | $172 | 62 |
| 168 Heidi Hl | 0.28mi | 3/2.0 (-1) | 1,964 (-12%) | 8mo | $399,990 | $204 | 54 |
Match score weights: distance 35% · size 25% · config 20% · recency 20%. Top-matched comps best support the ARV.
Projected returns pro-forma
-3.0% appreciation · 0.0% rent growth · sell at horizon
- IRR
- -28.5%
- Equity multiple
- 0.07×
- Total profit
- $-83,088
- Equity at exit
- $47,706
- IRR
- -45.8%
- Equity multiple
- -0.46×
- Total profit
- $-130,441
- Equity at exit
- $27,663
Cash invested: $89,586 (down + closing). Projections, not guarantees.
Landlord ↔ Tenant lean methodology
- Overall (STATE)
- 87 Strongly Landlord-Friendly
- State Texas
- 87 Strongly Landlord-Friendly · R+5
- County
- — inherits STATE
- City
- — inherits STATE
ZIP-level market 78253
- Home prices YoY
- -33.4%
- Rents YoY
- -1.1%
- Active inventory
- 728
- Price-to-rent
- 11.1×
Monthly cashflow live
- Estimated rent
- $2,392 medium interval (Pro) →
- Mortgage (P&I)
- −$1,678
- Tax est. 1.5%
- −$400 /mo · $4,799/yr
- Insurance
- −$133
- HOA
- −$60
- Vacancy / Maint / Mgmt
- −$502
- Net cashflow
- $-382
Break-even live
Sensitivity live
| Price | -10% $-161 | -5% $-271 | +0% $-382 | +5% $-492 | +10% $-603 |
|---|---|---|---|---|---|
| Rent | -10% $-571 | -5% $-476 | +0% $-382 | +5% $-287 | +10% $-193 |
| Rate | -1.0pp $-221 | -0.5pp $-300 | base $-382 | +0.5pp $-465 | +1.0pp $-549 |
UW: 25.0% down · 7.5% · 30yr · 1.5% tax · 5.0% vac · 8.0% maint · 8.0% mgmt
Financing live
Cash to close
- Down payment
- $79,988
- Closing costs
- $9,598
- Reserves months
- —
- Total cash needed
- —
Loan-product check · same deal, 3 products live
Conventional
25% down · 7.5% · 30yr
- Down + closing
- —
- Monthly P&I
- —
- Monthly cashflow
- —
- DSCR
- —
- Eligible?
- —
Personal DTI + credit; lowest rate.
DSCR
20% down · 8.5% · 30yr
- Down + closing
- —
- Monthly P&I
- —
- Monthly cashflow
- —
- DSCR
- —
- Eligible?
- —
No personal income docs; deal must DSCR.
Hard money
10% down · 12.0% · 12mo
- Down + closing
- —
- Monthly P&I
- —
- Monthly cashflow
- —
- DSCR
- —
- Eligible?
- —
Short-term bridge; refi at stabilization.
Rent comps 1 comps
| Address | Beds | Baths | Sqft | Rent | $/sqft | DOM | Units | Dist |
|---|---|---|---|---|---|---|---|---|
| 270 Lilly Blf Castroville, TX | 4.0 | 3.0 | 2958 | $3,600 | $1.22 | 45d | 1 | 1.45mi |
HOA detail
- Monthly dues
- $60 · $720/yr
Listing history 15 events
-
2026-06-21days on market $319,950 Active 54 DOM
-
2026-06-18days on market $319,950 Active 51 DOM
-
2026-06-17days on market $319,950 Active 50 DOM
-
2026-06-16days on market $319,950 Active 49 DOM
-
2026-06-15statusdays on market $319,950 Active 48 DOM
-
2026-06-13days on market $319,950 Price Change 46 DOM
-
2026-06-09days on market $319,950 Price Change 42 DOM
-
2026-06-08days on market $319,950 Price Change 41 DOM
-
2026-06-07pricestatusdays on market $319,950 Price Change 40 DOM
-
2026-06-04days on market $321,050 Active 37 DOM
-
2026-06-03days on market $321,050 Active 36 DOM
-
2026-06-02days on market $321,050 Active 35 DOM
-
2026-06-01days on market $321,050 Active 34 DOM
-
2026-05-31days on market $321,050 Active 33 DOM
-
2026-04-28$321,050 New 1625-char remark
ⓘ Source: listings_history table (triggers on properties + properties_extension) + one-shot
backfill from property_details.listing_events for pre-trigger history.
Nearby sold comps map
Loading sold comps map…
Walkable amenities ~0.75 mi
Loading nearby amenities…
Taxation est. · year 1
- Rental income
- $28,701
- − Mortgage interest
- −$17,922
- − Property taxes
- −$4,799
- − Insurance
- −$1,600
- − Repairs & maintenance
- −$2,296
- − Management
- −$2,296
- − HOA
- −$720
- − Depreciation
- −$9,308
- Taxable loss
- −$10,240
- Est. tax savings @ 24.0%
- +$2,458
- After-tax cash flow
- $-2,122/yr
For passive investors: Depreciation is non-cash, so a rental often shows a tax loss while cash-flowing — sheltering income. Rental losses are passive: they offset passive income freely, and up to $25,000/yr can offset ordinary (W-2) income if you actively participate and your MAGI is under $100k (phasing out to $0 by $150k); unused losses carry forward. On sale, claimed depreciation is recaptured at up to 25%, and gains may owe capital-gains tax (a 1031 exchange can defer both). Figures are a year-1 estimate at your 24.0% rate — not tax advice; consult a CPA.
Schools (NCES district)
- District
- Medina Valley ISD
- NCES district ID
- 4830060
- Math proficiency
- 48% ▼ -9.00%
- Reading proficiency
- 53% ▼ -2.00%
- Median HH income
- $60,596
- Composite
- 44.2/100
- National rank
- #2851
- State rank
- #148 of 826 in TX
Livability — Castroville
- Score
- 73/100
- State rank
- #212
- US rank
- #5267
Category grades
Schools grade is shown separately in the Schools card above.
Census & demographics
- County
- Bexar County · 1,990,555 people
- Metro
- San Antonio-New Braunfels, TX
- Population (ZIP)
- 69,282
- Household income
- $106,373
- Rent vs Own
- Severe rent burden
- 1496.0
Population outlook (Medina County) Hauer SSP2
- Today (2025)
- 54,332 people
- By 2030
- 57,250 · +5.4%
- By 2040
- 62,563 · +15.1%
- By 2050
- 67,386 · +24.0%
- By 2075
- 79,538 · +46.4%
- By 2100
- 84,624 · +55.8%
Race, ethnicity, and origin ACS 2023
- Neighborhood character
- Diverse neighborhood (Simpson 0.65)
- Race & ethnicity
- Hispanic / Latino 47% White 34% Two or more races 27% Black 9% Asian 4% Native American 2%
- Hispanic origin (detail)
- Mexican 38% Puerto Rican 3%
- Common ancestry
- Italian 2% Lithuanian 1% Romanian 1%
- Foreign-born
- 9% · Canada
- Languages at home
- 73% English-only · Spanish 22% Other Asian/Pacific 1% Tagalog/Filipino 1%
Political lean MEDSL · Medina
- 2024 margin
- Solid R (+42.8) · D 28.2% · R 71.0%
- 2008→2024 swing
- -8.9pp toward R · 2008: -33.9pp · 2024: -42.8pp
- All cycles
- 2024: R+42.8 2020: R+39.2 2016: R+43.2 2012: R+39.2 2008: R+33.9
Not yet ingested
- Civics
- —
Market trends
- HPI YoY
- ▼ -99.92%
- Current HPI
- 199.1827
- Rent YoY
- ▼ -1.10%
- Metro
- San Antonio-New Braunfels, TX
- State GDP YoY
- ▲ 3.95%
- F500 in state
- 110
Industry mix (Fortune 500 HQ in TX)
| Industry | F500 HQs | Revenue |
|---|---|---|
| Energy | 16 | $1,198B |
|
||
| Technology | 5 | $198B |
|
||
| Engineering / Construction | 4 | $72B |
|
||
| Energy Services | 3 | $60B |
|
||
| Utilities | 3 | $41B |
|
||
| Healthcare | 2 | $330B |
|
||
Price history
-0.3% since first listed2 events — show timeline
- 2026-06-04 Price Changed $319,950 LERA
- 2026-04-28 Listed $321,050 LERA
Cash-flow waterfall
monthlySold comps — $/sqft
last 12 mo · ≤1 miLoading sold comps…