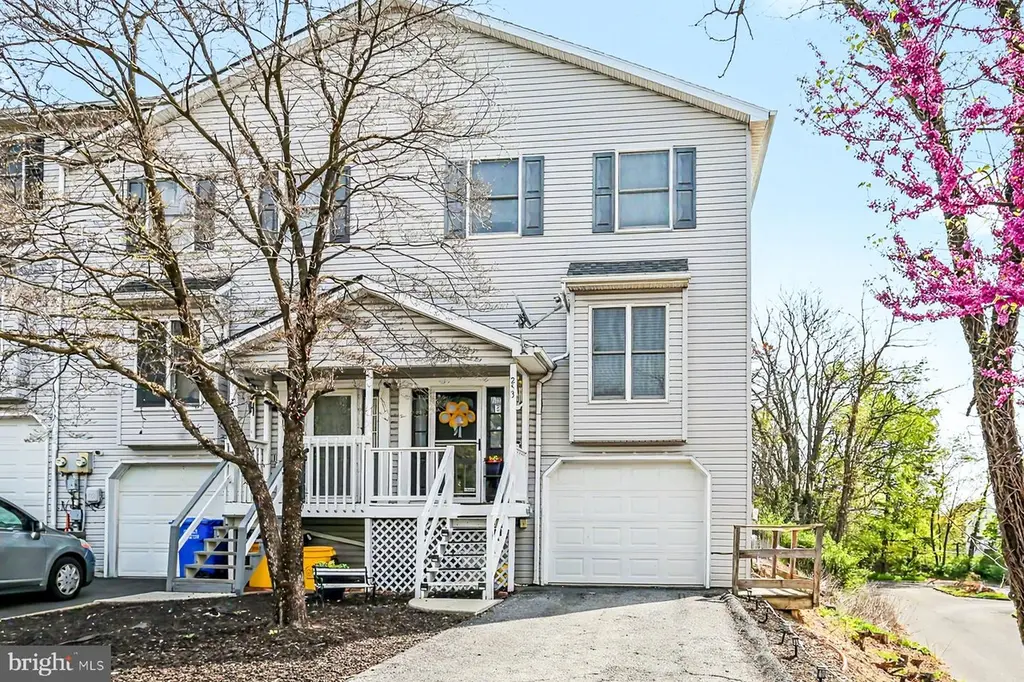
253 Worcester Ave · Swatara, PA
Flood risk 1/10 · Minimal
- FEMA flood zone
- X (unshaded)
- Chance of flooding over 30 yrs
- 0.0%
- Est. flood insurance / yr
- $473 – $860
Fire risk 1/10 · Minimal
- Est. fire insurance / yr
- $511 – $949
Heat risk 5/10 · Moderate
- Hot days now (above 100°F)
- 7 days/yr
- Hot days in 30 yrs
- 15 days/yr
Wind risk 3/10 · Minor
- Chance of severe wind over 30 yrs
- 6.0%
Air-quality risk 3/10 · Minor
- Unhealthy air days now
- 2 days/yr
- Unhealthy air days in 30 yrs
- 4 days/yr
Risk factors via First Street. Map © Google.
Why this score? — see what drove the C+ grade
The composite is a weighted blend of 9 inputs, each scored 0–100. Each bar is that input's sub-score; the figure is the points it added to the 100-point composite (weight × sub-score).
- Cash flow +23.4/30.0
- ARV discount +15.0/15.0
- DSCR +7.5/10.0
- 1% rule +6.0/10.0
- Schools +3.6/10.0
- Rent growth +3.4/5.0
- Livability +2.5/5.0
- Condition / age +2.5/5.0
- Appreciation +0.0/10.0
$224,900
🖨 Deal sheet 📄 Offer letter ✓ Due diligence
Listing remarks MLS
This end unit townhouse is conveniently located in Swatara Township. Close to shopping restaurants and highways. 3 stories finished with 3 bedrooms with ceiling fans, 1.5 baths. Living room has fireplace and access to new rear deck. Large kitchen. Lower level has family room with ceiling fan and built-ins and offers walk-out patio with rear yard access. 1 car garage.
Key facts
- Garage
- Built 1989
- Listed 3 days
Neighborhood map
What this means for you Summary
Snapshot
- This is a 3-bed/1.5-bath single-family listed at $225k.
Deal economics
- At list price, monthly cash flow is $417 ($5k/yr) — positive.
- The deal already cash-flows at list — no discount required.
- Meets the 1% rule at list price ($2k rent vs $225k).
Location & tenants
- Location reads: area grade C — affects rentability + tenant quality, not the cash-flow math above.
- Central Dauphin SD (suburban): math 30% / reading 52% proficiency, ranked #305 of 539 in PA (top 57%) — families likely to look elsewhere, expect single-tenant / working-renter base with shorter leases.
- Zoned schools: Central Dauphin East Shs (math 50% / reading 15%, grade F, #330 of 437 statewide, top 76%, 1,590 students, 100% FRL) — zoned schools average 100% FRL vs 33% district-wide (67 pts higher); higher-poverty schools than district average — tighter screening recommended.
- Market conditions: Rents rising (+3.8%/yr); 178 active listings in the ZIP; 3 comparable units currently listed for rent nearby; rentals at typical pace (median 14d on market — plan ~3-4 weeks tenant-placement turnaround); solid renter incomes; 540 units permitted in Dauphin County in 2024 (194 in 5+ unit buildings).
- This rent runs 34% of the median local income ($86k/yr) — at the standard rent-burdened threshold; future hikes will face affordability resistance.
Forward outlook
- Local home prices are declining (-3.0%/yr); year-one equity from $2k of loan paydown is wiped out by about $7k of value loss. Plan a longer hold.
Negotiation context
- Only 3 days on market — expect competitive offers; lowballing is unlikely to land.
- 5 sale attempts since 21y ago with the ask held roughly flat each time — persistent listings suggest the price (not the market) is what's stuck; bring a comps-based counter.
- Current owner paid $190k; 18% above their basis — modest negotiation headroom, anchor on the comps not their cost.
Risks & watch-outs
- Climate carrying-cost: extreme-heat days projected 7→15/yr by 2055 (HVAC capex compounding) — expect insurance premiums to compound above CPI over the hold.
Questions for the listing agent
- Is there a deadline driving the sale (1031 exchange, divorce, estate, relocation)? That informs how much negotiation room exists.
- What's the average days-on-market for RENTAL listings here right now (not sales)? A rising rental-DOM trend means longer vacancies and softer asking-rent achievability than the comps imply.
- What's the recent tenant-quality profile in this submarket — average credit score on applications, eviction rate, late-payment / NSF rate, and stable-employment percentage? A property-management company in the area should have these aggregated.
- How much new for-sale + rental construction is in the pipeline within 1–3 miles? Heavy new supply typically softens prices + rents 12–24 months out; constrained supply supports both.
Investment metrics
- 1% rule
- 1.10% ✓
- Cap rate
- 8.52%
- Cash-on-cash
- 7.95%
- DSCR
- 1.35
- GRM
- 7.6
CMA / ARV
- ARV (on-the-fly)
- $328,335
- Comps found
- 12
Show comp detail 12 sales within ~0.75 mi
| Address | Dist | Beds/Ba | Sqft | Sold | Price | $/sf | Match |
|---|---|---|---|---|---|---|---|
| 310 Harford Ave | 0.15mi | 3/1.5 | 2,050 (-1%) | 18mo | $293,180 | $143 | 77 |
| 640 Harvest Dr | 0.51mi | 3/1.5 | 1,900 (-8%) | 4mo | $335,000 | $176 | 59 |
| 101 N 62nd | 0.56mi | 3/2.5 | 2,039 (-1%) | 16mo | $440,000 | $216 | 55 |
| 4810 Etta Rd | 0.74mi | 3/2.0 | 2,118 (+3%) | 7mo | $222,000 | $105 | 53 |
| 6171 Huntingdon St | 0.49mi | 3/2.0 | 1,970 (-5%) | 18mo | $165,000 | $84 | 53 |
| 6126 Chatham Ct | 0.62mi | 4/2.5 (+1) | 2,180 (+6%) | 1mo | $455,000 | $209 | 52 |
| 4830 Etta Rd | 0.70mi | 3/2.0 | 2,188 (+6%) | 9mo | $305,000 | $139 | 48 |
| 4903 Erie Rd | 0.63mi | 4/1.5 (+1) | 1,767 (-14%) | 0mo | $281,000 | $159 | 42 |
| 4818 Tamar Dr | 0.68mi | 4/3.0 (+1) | 2,232 (+8%) | 10mo | $365,000 | $164 | 36 |
| 5050 Franklin St | 0.53mi | 4/2.5 (+1) | 2,350 (+14%) | 12mo | $369,900 | $157 | 33 |
| 4832 Sweetbrier Ter | 0.66mi | 4/2.5 (+1) | 1,840 (-11%) | 14mo | $299,900 | $163 | 30 |
| 403 N 48th St | 0.73mi | 4/2.0 (+1) | 2,300 (+11%) | 12mo | $335,900 | $146 | 30 |
Match score weights: distance 35% · size 25% · config 20% · recency 20%. Top-matched comps best support the ARV.
Projected returns pro-forma
-3.0% appreciation · 3.76% rent growth · sell at horizon
- IRR
- -3.3%
- Equity multiple
- 0.87×
- Total profit
- $-7,938
- Equity at exit
- $33,533
- IRR
- 7.2%
- Equity multiple
- 1.56×
- Total profit
- $35,381
- Equity at exit
- $19,445
Cash invested: $62,972 (down + closing). Projections, not guarantees.
Landlord ↔ Tenant lean methodology
- Overall (STATE)
- 62 Landlord-Friendly
- State Pennsylvania
- 62 Landlord-Friendly · EVEN
- County
- — inherits STATE
- City
- — inherits STATE
ZIP-level market 17111
- Rents YoY
- 3.8%
- Active inventory
- 178
- Price-to-rent
- 7.6×
Monthly cashflow live
- Estimated rent
- $2,481 medium interval (Pro) →
- Mortgage (P&I)
- −$1,179
- Tax from tax record
- −$270 /mo · $3,237/yr
- Insurance
- −$94
- HOA
- −$0
- Vacancy / Maint / Mgmt
- −$521
- Net cashflow
- $417
Break-even live
UW: 25.0% down · 7.5% · 30yr · 1.5% tax · 5.0% vac · 8.0% maint · 8.0% mgmt
Financing live
Cash to close
- Down payment
- $56,225
- Closing costs
- $6,747
- Reserves months
- —
- Total cash needed
- —
Loan-product check · same deal, 3 products live
Conventional
25% down · 7.5% · 30yr
- Down + closing
- —
- Monthly P&I
- —
- Monthly cashflow
- —
- DSCR
- —
- Eligible?
- —
Personal DTI + credit; lowest rate.
DSCR
20% down · 8.5% · 30yr
- Down + closing
- —
- Monthly P&I
- —
- Monthly cashflow
- —
- DSCR
- —
- Eligible?
- —
No personal income docs; deal must DSCR.
Hard money
10% down · 12.0% · 12mo
- Down + closing
- —
- Monthly P&I
- —
- Monthly cashflow
- —
- DSCR
- —
- Eligible?
- —
Short-term bridge; refi at stabilization.
Rent comps 3 comps
| Address | Beds | Baths | Sqft | Rent | $/sqft | DOM | Units | Dist |
|---|---|---|---|---|---|---|---|---|
| 4810 Etta Rd Harrisburg, PA | 3.0 | 2.0 | 2118 | $2,450 | $1.16 | 14d | 1 | 0.73mi |
| 6226 Lehigh Ave Harrisburg, PA | 4.0 | 4.0 | 2128 | $2,975 | $1.40 | 14d | 1 | 0.76mi |
| 6550 Somerset St Harrisburg, PA | 3.0 | 2.0 | 1488 | $2,250 | $1.51 | 14d | 1 | 0.94mi |
Listing history 19 events
-
2026-04-27status Pending
-
2026-04-25$224,900 Active
-
2026-04-20historical $224,900
-
2022-01-11soldstatus $190,000
-
2022-01-07soldstatus $190,000 Closed 369-char remark
Show marketing remark (369 chars)
This end unit townhouse is conveniently located in Swatara Township. Close to shopping restaurants and highways. 3 stories finished with 3 bedrooms with ceiling fans, 1.5 baths. Living room has fireplace and access to new rear deck. Large kitchen. Lower level has family room with ceiling fan and built-ins and offers walk-out patio with rear yard access. 1 car garage.
-
2021-11-25historical Active Under Contract 369-char remark
Show marketing remark (369 chars)
This end unit townhouse is conveniently located in Swatara Township. Close to shopping restaurants and highways. 3 stories finished with 3 bedrooms with ceiling fans, 1.5 baths. Living room has fireplace and access to new rear deck. Large kitchen. Lower level has family room with ceiling fan and built-ins and offers walk-out patio with rear yard access. 1 car garage.
-
2021-11-22$190,000 Active 369-char remark
Show marketing remark (369 chars)
This end unit townhouse is conveniently located in Swatara Township. Close to shopping restaurants and highways. 3 stories finished with 3 bedrooms with ceiling fans, 1.5 baths. Living room has fireplace and access to new rear deck. Large kitchen. Lower level has family room with ceiling fan and built-ins and offers walk-out patio with rear yard access. 1 car garage.
-
2019-07-24soldstatus $145,000
-
2019-07-19soldstatus $145,000 Closed
-
2019-05-16$145,000
-
2019-05-16historical
-
2013-07-25soldstatus $123,900
-
2013-07-25soldstatus $123,900
-
2013-06-05$123,900
-
2005-09-22soldstatus $130,400
-
2005-09-20soldstatus $130,400
-
2005-06-23$129,900
-
1993-12-14soldstatus $87,000
-
1990-03-27soldstatus $81,900
ⓘ Source: listings_history table (triggers on properties + properties_extension) + one-shot
backfill from property_details.listing_events for pre-trigger history.
Tax reassessment forecast PA · Partial reset (capped growth)
- Current annual tax
- $3,237 · $270/mo
- Projected year-2 tax
- $3,395 · $283/mo
- Expected delta
- +$158/yr (+$13/mo · 4.9%)
ⓘ Screening estimate from a state-policy table — verify with the county assessor before closing.
Climate risk First Street
- Flood 1/10 Low FEMA zone X (unshaded) · 0% chance over 30 yrs
- Wildfire 1/10 Low
- Heat 5/10 Major 7 d/yr ≥100°F today · 15 d/yr by 30 yrs out
- Wind 3/10 Moderate 6% chance of damaging wind over 30 yrs
- Air quality 3/10 Moderate 2 unhealthy d/yr today · 4 by 30 yrs out
Nearby sold comps map
Loading sold comps map…
Walkable amenities ~0.75 mi
Loading nearby amenities…
Taxation est. · year 1
- Rental income
- $29,770
- − Mortgage interest
- −$12,598
- − Property taxes
- −$3,237
- − Insurance
- −$1,124
- − Repairs & maintenance
- −$2,382
- − Management
- −$2,382
- − Depreciation
- −$6,543
- Taxable income
- $1,506
- Est. tax owed @ 24.0%
- −$361
- After-tax cash flow
- $4,643/yr
For passive investors: Depreciation is non-cash, so a rental often shows a tax loss while cash-flowing — sheltering income. Rental losses are passive: they offset passive income freely, and up to $25,000/yr can offset ordinary (W-2) income if you actively participate and your MAGI is under $100k (phasing out to $0 by $150k); unused losses carry forward. On sale, claimed depreciation is recaptured at up to 25%, and gains may owe capital-gains tax (a 1031 exchange can defer both). Figures are a year-1 estimate at your 24.0% rate — not tax advice; consult a CPA.
Schools (NCES district)
- District
- Central Dauphin SD
- NCES district ID
- 4205400
- Math proficiency
- 30% ▼ -12.00%
- Reading proficiency
- 52% ▼ -7.00%
- Median HH income
- $62,792
- Composite
- 36.46/100
- National rank
- #4664
- State rank
- #305 of 539 in PA
Livability — Swatara
No livability data for this city. (Only ~50 U.S. cities are tracked.)
Census & demographics
- Census place
- Lawnton, PA
- County
- Dauphin County · 247,857 people
- Metro
- Harrisburg-Carlisle, PA
- Population (ZIP)
- 36,744
- Household income
- $86,385
- Rent vs Own
- Severe rent burden
- 756.0
Population outlook (Dauphin County) Hauer SSP2
- Today (2025)
- 281,628 people
- By 2030
- 283,549 · +0.7%
- By 2040
- 285,385 · +1.3%
- By 2050
- 286,188 · +1.6%
- By 2075
- 291,053 · +3.3%
- By 2100
- 282,374 · +0.3%
Race, ethnicity, and origin ACS 2023
- Neighborhood character
- Diverse neighborhood (Simpson 0.65)
- Race & ethnicity
- White 53% Black 22% Asian 13% Hispanic / Latino 8% Two or more races 6%
- Hispanic origin (detail)
- Mexican 1% Puerto Rican 4%
- Common ancestry
- Romanian 4% Lithuanian 1% Serbian 1%
- Foreign-born
- 14% · India, Canada, Vietnam
- Languages at home
- 83% English-only · Other Indo-European 7% Spanish 6% Vietnamese 1%
Political lean MEDSL · Dauphin
- 2024 margin
- Lean D (+5.9) · D 52.4% · R 46.5% · Other 1.1%
- 2008→2024 swing
- -3.1pp toward R · 2008: 9.1pp · 2024: 5.9pp
- All cycles
- 2024: D+5.9 2020: D+8.5 2016: D+2.8 2012: D+6.0 2008: D+9.1
Not yet ingested
- Civics
- —
Market trends
- HPI YoY
- ▼ -140.67%
- Current HPI
- 236.6936
- Rent YoY
- ▲ 3.76%
- Metro
- Harrisburg-Carlisle, PA
- State GDP YoY
- ▲ 1.68%
- F500 in state
- 34
Industry mix (Fortune 500 HQ in PA)
| Industry | F500 HQs | Revenue |
|---|---|---|
| Healthcare | 2 | $309B |
|
||
| Insurance | 2 | $27B |
|
||
| Telecommunications / Media | 1 | $124B |
|
||
| Industrial Distribution | 1 | $22B |
|
||
| Financial Services | 1 | $20B |
|
||
| Chemicals / Materials | 1 | $18B |
|
||
Price history
+174.6% since first listed19 events — show timeline
- 2026-04-27 Pending — BRIGHT MLS
- 2026-04-25 Listed $224,900 BRIGHT MLS
- 2026-04-20 Coming Soon $224,900 BRIGHT MLS
- 2022-01-11 Sold (Public Records) $190,000 Public Records
- 2022-01-07 Sold (MLS) $190,000 BRIGHT MLS
- 2021-11-25 Contingent — BRIGHT MLS
- 2021-11-22 Listed $190,000 BRIGHT MLS
- 2019-07-24 Sold (Public Records) $145,000 Public Records
- 2019-07-19 Sold (MLS) $145,000 BRIGHT MLS
- 2019-05-16 Listing Removed — BRIGHT MLS
- 2019-05-16 Listed $145,000 BRIGHT MLS
- 2013-07-25 Sold (Public Records) $123,900 Public Records
- 2013-07-25 Sold (MLS) $123,900 BRIGHT MLS
- 2013-06-05 Listed $123,900 BRIGHT MLS
- 2005-09-22 Sold (Public Records) $130,400 Public Records
- 2005-09-20 Sold (MLS) $130,400 BRIGHT MLS
- 2005-06-23 Listed $129,900 BRIGHT MLS
- 1993-12-14 Sold (Public Records) $87,000 Public Records
- 1990-03-27 Sold (Public Records) $81,900 Public Records
Property tax history
+1.9%/yrLatest (2026): $3,237 · +5.5% YoY. Source: county tax records.
Cash-flow waterfall
monthlySold comps — $/sqft
last 12 mo · ≤1 miLoading sold comps…