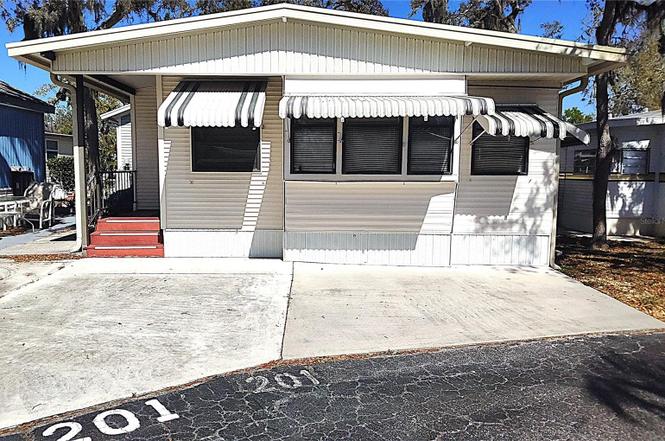
3300 26th Ave E #201 · Bradenton, FL
Flood risk 7/10 · Major
- FEMA flood zone
- X (shaded)
- Chance of flooding over 30 yrs
- 0.75%
- Est. flood insurance / yr
- $507 – $1,088
Fire risk 2/10 · Minimal
- Est. fire insurance / yr
- $947 – $1,759
Heat risk 10/10 · Severe
- Hot days now (above 107°F)
- 7 days/yr
- Hot days in 30 yrs
- 28 days/yr
Wind risk 10/10 · Severe
- Chance of severe wind over 30 yrs
- 99.0%
Air-quality risk 3/10 · Minor
- Unhealthy air days now
- 3 days/yr
- Unhealthy air days in 30 yrs
- 3 days/yr
Risk factors via First Street. Map © Google.
Why this score? — see what drove the B grade
The composite is a weighted blend of 9 inputs, each scored 0–100. Each bar is that input's sub-score; the figure is the points it added to the 100-point composite (weight × sub-score).
- Cash flow +30.0/30.0
- ARV discount +10.5/15.0
- 1% rule +10.0/10.0
- DSCR +10.0/10.0
- Schools +4.4/10.0
- Livability +4.0/5.0
- Condition / age +2.5/5.0
- Rent growth +1.1/5.0
- Appreciation +0.0/10.0
$59,900
🖨 Deal sheet 📄 Offer letter ✓ Due diligence
Listing remarks
Best value in the park! This vibrant 55+ community provides many winter time activities to keep you busy. Large heated pool, pickleball, tennis, shuffleboard, billiards and a miniature golf course. This home features 1 bedroom and 1 bath. Newer floors and newer water heater. This home is just waiting for someone to add their touches.
Key facts
- Tennis
- Billiards
- Pickleball
Tags
Property features AI
Finance
- Other: Furnished; Directions: Right behind Mixon's Farm — 26th Ave E to 33rd Street; at the end of 33rd Street take the center gate
- Financial info: Lease restrictions apply
- HOA & community: Has HOA; fees required; Monthly HOA approximately $166.67 (quarterly fee shown as $500); Association approval required; Association amenities: Clubhouse, gated community, laundry facilities, pickleball courts, pool, shuffleboard, tennis courts; Senior community; Pets not allowed
Exterior
- Utilities: Public water; Public sewer; Cable available; Electricity connected; Water connected; Sewer connected
- Home design: Manufactured single-wide home; One story; West-facing
- Construction: Frame construction; Metal roof; Crawlspace foundation; Built area about 910 square feet
- Exterior features: Asphalt road access; Lot approximately 0.04 acres
Interior
- Kitchen: Cooktop; Microwave; Refrigerator
- Bedrooms: 1 bedroom
- Flooring: Carpet; Linoleum
- Bathrooms: 1 full bathroom
- Heating & cooling: Electric heating; Central air conditioning
- Interior features: Ceiling fans
- Laundry & utility: Washer; Dryer; Indoor laundry
Neighborhood map
What this means for you Summary
Snapshot
- This is a 1-bed/1.0-bath manufactured listed at $60k.
Deal economics
- At list price, monthly cash flow is $442 ($5k/yr) — positive.
- The deal already cash-flows at list — no discount required.
- Meets the 1% rule at list price ($1k rent vs $60k).
- Recommended offer: $53k (12.0% below list) — sets the bar for market timing.
- Cap rate 16.5% vs local median 3.6% in Bradenton — top-decile yield for the area; either an underpriced asset or a hidden risk that comps aren't pricing in. Stress-test before assuming the spread holds.
Location & tenants
- Location reads 81/100 on livability (#101 in FL, #1,528 nationally) — a professional / high-income tenant draw. Strengths: commute A+, cost of living A+, housing A+; Watch: employment D+, crime D, amenities F.
- Manatee (suburban): math 54% / reading 50% proficiency, ranked #26 of 73 in FL (top 36%) — acceptable for families but not a draw, mixed tenant base, ~2y average lease.
- Market conditions: Rents falling (-5.4%/yr); 345 active listings in the ZIP; 7,472 units permitted in Manatee County in 2024 (1,782 in 5+ unit buildings).
Forward outlook
- Local home prices are declining (-3.0%/yr); year-one equity from $414 of loan paydown is wiped out by about $2k of value loss. Plan a longer hold.
- Manatee County population projected at +43% by 2050 — long-run rental-demand tailwind backs the buy-and-hold thesis.
- At projected returns (-3.0% appreciation + 0.0% rent growth), your $17k cash investment doubles in ~5 years — after that, you're playing with house money.
Negotiation context
- It's been on market 164 days — a 12% lower offer ($53k) is reasonable based on typical stale-listing flexibility.
- 3 sale attempts; this cycle's ask has dropped $20k (25%) from the opening price — seller is motivated, your offer sets the floor, not the list.
- Current owner paid $17k; list at $60k implies a 252% gain — meaningful room to come down on a strong offer.
Risks & watch-outs
- Watch-outs: flood insurance adds $66/mo.
- Climate carrying-cost: major flood risk; severe wind risk, 99% chance of damaging wind over 30y; extreme-heat days projected 7→28/yr by 2055 (HVAC capex compounding) — expect insurance premiums to compound above CPI over the hold.
Questions for the listing agent
- It's been on market 164 days. Have you received any prior offers? Is the seller open to a 12% concession, seller financing, or rate buy-down credit?
- What's the actual annual flood-insurance premium (NFIP or private), and is the property in a SFHA with mandatory coverage?
- What does the HOA fee cover, when was the last increase, and are there any pending special assessments or reserve-fund shortfalls?
- Why hasn't it sold? Are there any deal-killer items the seller is aware of (foundation, flood, title, zoning, code violations)?
- Is there a deadline driving the sale (1031 exchange, divorce, estate, relocation)? That informs how much negotiation room exists.
- Crime grade is D in this area — have there been break-ins, vandalism, or insurance claims at this property in the last 3 years? What carrier currently insures it and at what premium?
- What's the average days-on-market for RENTAL listings here right now (not sales)? A rising rental-DOM trend means longer vacancies and softer asking-rent achievability than the comps imply.
- What's the recent tenant-quality profile in this submarket — average credit score on applications, eviction rate, late-payment / NSF rate, and stable-employment percentage? A property-management company in the area should have these aggregated.
- How much new for-sale + rental construction is in the pipeline within 1–3 miles? Heavy new supply typically softens prices + rents 12–24 months out; constrained supply supports both.
Investment metrics
- 1% rule
- 2.19% ✓
- Cap rate
- 16.47%
- Cash-on-cash
- 36.36%
- DSCR
- 2.62
- GRM
- 3.8
CMA / ARV
- ARV (on-the-fly)
- $64,107
- Comps found
- 2
Show comp detail 2 sales within ~0.75 mi
| Address | Dist | Beds/Ba | Sqft | Sold | Price | $/sf | Match |
|---|---|---|---|---|---|---|---|
| 3300 26th Ave E #171 | 0.00mi | 1/1.0 | 420 (+0%) | 3mo | $29,900 | $71 | 97 |
| 3333 26th Ave E #1023 | 0.32mi | 1/1.0 | 393 (-6%) | 4mo | $60,000 | $153 | 71 |
Match score weights: distance 35% · size 25% · config 20% · recency 20%. Top-matched comps best support the ARV.
Projected returns pro-forma
-3.0% appreciation · 0.0% rent growth · sell at horizon
- IRR
- 22.4%
- Equity multiple
- 1.88×
- Total profit
- $14,714
- Equity at exit
- $8,931
- IRR
- 28.0%
- Equity multiple
- 3.07×
- Total profit
- $34,708
- Equity at exit
- $5,179
Cash invested: $16,772 (down + closing). Projections, not guarantees.
Landlord ↔ Tenant lean methodology
- Overall (STATE)
- 87 Strongly Landlord-Friendly
- State Florida
- 87 Strongly Landlord-Friendly · R+3
- County
- — inherits STATE
- City
- — inherits STATE
ZIP-level market 34208
- Rents YoY
- -5.4%
- Active inventory
- 345
- Price-to-rent
- 3.8×
Monthly cashflow live
- Estimated rent
- $1,313 medium interval (Pro) →
- Mortgage (P&I)
- −$314
- Tax from tax record
- −$24 /mo · $287/yr
- Insurance
- −$25
- Flood insurance flood zone
- −$66 /mo · $798/yr
- HOA
- −$166
- Vacancy / Maint / Mgmt
- −$276
- Net cashflow
- $442
Break-even live
UW: 25.0% down · 7.5% · 30yr · 1.5% tax · 5.0% vac · 8.0% maint · 8.0% mgmt
Financing live
Cash to close
- Down payment
- $14,975
- Closing costs
- $1,797
- Reserves months
- —
- Total cash needed
- —
Loan-product check · same deal, 3 products live
Conventional
25% down · 7.5% · 30yr
- Down + closing
- —
- Monthly P&I
- —
- Monthly cashflow
- —
- DSCR
- —
- Eligible?
- —
Personal DTI + credit; lowest rate.
DSCR
20% down · 8.5% · 30yr
- Down + closing
- —
- Monthly P&I
- —
- Monthly cashflow
- —
- DSCR
- —
- Eligible?
- —
No personal income docs; deal must DSCR.
Hard money
10% down · 12.0% · 12mo
- Down + closing
- —
- Monthly P&I
- —
- Monthly cashflow
- —
- DSCR
- —
- Eligible?
- —
Short-term bridge; refi at stabilization.
HOA detail
- Monthly dues
- $166 · $1,992/yr
- Likely covers
- waterpool
Listing history 11 events
-
2026-06-18days on market $59,900 Active 164 DOM
-
2026-06-17days on market $59,900 Active 163 DOM
-
2026-06-16days on market $59,900 Active 162 DOM
-
2026-06-15days on market $59,900 Active 161 DOM
-
2026-06-13days on market $59,900 Active 159 DOM
-
2026-06-13days on market $59,900 Active 158 DOM
-
2026-06-10days on market $59,900 Active 156 DOM
-
2026-06-09days on market $59,900 Active 155 DOM
-
2026-06-08days on market $59,900 Active 154 DOM
-
2026-06-08remarks 335-char remark
-
2026-06-08$59,900 Active 153 DOM
ⓘ Source: listings_history table (triggers on properties + properties_extension) + one-shot
backfill from property_details.listing_events for pre-trigger history.
Tax reassessment forecast FL · Resets to sale price
- Current annual tax
- $287 · $24/mo
- Projected year-2 tax
- $497 · $41/mo
- Expected delta
- +$211/yr (+$18/mo · 73.5%)
ⓘ Screening estimate from a state-policy table — verify with the county assessor before closing.
Climate risk First Street
- Flood 7/10 Severe FEMA zone X (shaded) · 75% chance over 30 yrs
- Wildfire 2/10 Low
- Heat 10/10 Extreme 7 d/yr ≥107°F today · 28 d/yr by 30 yrs out
- Wind 10/10 Extreme 99% chance of damaging wind over 30 yrs
- Air quality 3/10 Moderate 3 unhealthy d/yr today · 3 by 30 yrs out
Nearby sold comps map
Loading sold comps map…
Walkable amenities ~0.75 mi
Loading nearby amenities…
Taxation est. · year 1
- Rental income
- $15,755
- − Mortgage interest
- −$3,355
- − Property taxes
- −$287
- − Insurance
- −$1,097
- − Repairs & maintenance
- −$1,260
- − Management
- −$1,260
- − HOA
- −$1,992
- − Depreciation
- −$1,743
- Taxable income
- $4,761
- Est. tax owed @ 24.0%
- −$1,143
- After-tax cash flow
- $4,159/yr
For passive investors: Depreciation is non-cash, so a rental often shows a tax loss while cash-flowing — sheltering income. Rental losses are passive: they offset passive income freely, and up to $25,000/yr can offset ordinary (W-2) income if you actively participate and your MAGI is under $100k (phasing out to $0 by $150k); unused losses carry forward. On sale, claimed depreciation is recaptured at up to 25%, and gains may owe capital-gains tax (a 1031 exchange can defer both). Figures are a year-1 estimate at your 24.0% rate — not tax advice; consult a CPA.
Schools (NCES district)
- District
- Manatee
- NCES district ID
- 1201230
- Math proficiency
- 54% ▼ -6.00%
- Reading proficiency
- 50% ▼ -2.00%
- Median HH income
- $49,607
- Composite
- 44.43/100
- National rank
- #2806
- State rank
- #26 of 73 in FL
Livability — Bradenton
- Score
- 81/100
- State rank
- #101
- US rank
- #1528
Category grades
Schools grade is shown separately in the Schools card above.
Census & demographics
- County
- Manatee County · 416,364 people
- City population
- 227,091
- Metro
- North Port-Sarasota-Bradenton, FL
- Population (ZIP)
- 44,004
- Household income
- $60,504
- Rent vs Own
- Severe rent burden
- 1777.0
Population outlook (Manatee County) Hauer SSP2
- Today (2025)
- 447,342 people
- By 2030
- 488,911 · +9.3%
- By 2040
- 567,934 · +27.0%
- By 2050
- 637,995 · +42.6%
- By 2075
- 781,970 · +74.8%
- By 2100
- 848,272 · +89.6%
Race, ethnicity, and origin ACS 2023
- Neighborhood character
- Diverse neighborhood (Simpson 0.67)
- Race & ethnicity
- White 43% Hispanic / Latino 33% Black 18% Two or more races 16% Asian 2%
- Hispanic origin (detail)
- Mexican 18% Puerto Rican 3% Cuban 2% Dominican 2%
- Common ancestry
- Hispanic 2% Iranian 2% Lithuanian 1%
- Foreign-born
- 20% · Canada, Jamaica, China
- Languages at home
- 67% English-only · Spanish 27% French/Haitian/Cajun 3% Other Indo-European 1%
Political lean MEDSL · Manatee
- 2024 margin
- Strong R (+23.5) · D 37.9% · R 61.4%
- 2008→2024 swing
- -16.5pp toward R · 2008: -7.0pp · 2024: -23.5pp
- All cycles
- 2024: R+23.5 2020: R+16.1 2016: R+17.1 2012: R+12.5 2008: R+7.0
Not yet ingested
- Civics
- —
Market trends
- HPI YoY
- ▼ -353.49%
- Current HPI
- 287.0443
- Rent YoY
- ▼ -5.44%
- Metro
- North Port-Sarasota-Bradenton, FL
- State GDP YoY
- ▲ 3.28%
- F500 in state
- 36
Industry mix (Fortune 500 HQ in FL)
| Industry | F500 HQs | Revenue |
|---|---|---|
| Industrial Technology | 2 | $29B |
|
||
| Insurance | 2 | $17B |
|
||
| Retail | 1 | $60B |
|
||
| Technology Distribution | 1 | $58B |
|
||
| Homebuilding | 1 | $35B |
|
||
| Technology Manufacturing | 1 | $35B |
|
||
Price history
+648.8% since first listed9 events — show timeline
- 2026-06-06 Relisted — Stellar MLS as Distributed by MLS Grid
- 2026-05-22 Listing Removed — Stellar MLS as Distributed by MLS Grid
- 2026-04-12 Price Changed $59,900 Stellar MLS as Distributed by MLS Grid
- 2025-12-21 Listed $79,900 Stellar MLS as Distributed by MLS Grid
- 2025-10-17 Listing Removed — Stellar MLS as Distributed by MLS Grid
- 2025-03-17 Listed $89,900 Stellar MLS as Distributed by MLS Grid
- 1994-02-23 Sold (Public Records) $17,000 Public Records
- 1993-11-12 Sold (Public Records) $9,900 Public Records
- 1983-05-19 Sold (Public Records) $8,000 Public Records
Property tax history
+6.3%/yrLatest (2025): $287 · +11.0% YoY. Source: county tax records.
Cash-flow waterfall
monthlySold comps — $/sqft
last 12 mo · ≤1 miLoading sold comps…