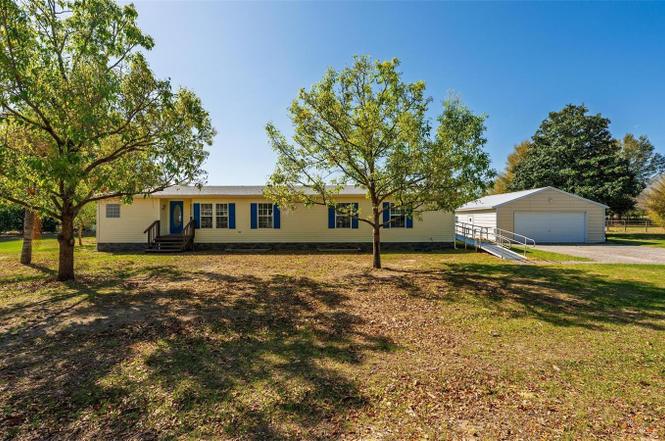
5353 NE 136th Pl · The Villages, FL
Flood risk 8/10 · Major
- FEMA flood zone
- X (unshaded)
- Chance of flooding over 30 yrs
- 0.99%
- Est. flood insurance / yr
- $507 – $1,088
Fire risk 4/10 · Minor
- Est. fire insurance / yr
- $947 – $1,759
Heat risk 8/10 · Major
- Hot days now (above 109°F)
- 7 days/yr
- Hot days in 30 yrs
- 20 days/yr
Wind risk 9/10 · Severe
- Chance of severe wind over 30 yrs
- 99.0%
Air-quality risk 3/10 · Minor
- Unhealthy air days now
- 2 days/yr
- Unhealthy air days in 30 yrs
- 2 days/yr
Risk factors via First Street. Map © Google.
Why this score? — see what drove the D- grade
The composite is a weighted blend of 9 inputs, each scored 0–100. Each bar is that input's sub-score; the figure is the points it added to the 100-point composite (weight × sub-score).
- Cash flow +13.0/30.0
- ARV discount +6.6/15.0
- Schools +5.2/10.0
- DSCR +3.9/10.0
- Livability +3.5/5.0
- 1% rule +2.6/10.0
- Rent growth +2.5/5.0
- Condition / age +2.5/5.0
- Appreciation +0.0/10.0
$320,000
🖨 Deal sheet 📄 Offer letter ✓ Due diligence
Listing remarks MLS
Back on the market! New roof, well maintained one owner mobile home near The Villages. This great home has 4 bedrooms and 3 bathrooms on rare one acre parcel.
Key facts
- Private office
- Walk-in closet
- Formal dining area
Tags
Neighborhood map
What this means for you Summary
Snapshot
- This is a 4-bed/3.0-bath manufactured listed at $320k.
Deal economics
- At list price, monthly cash flow is $-85 ($-1k/yr) — negative.
- To cash-flow at today's rent, offer at most $305k (4.7% below list).
- To meet the 1% rule (rent ≥ 1% of price), the offer needs to be $244k (23.6% below list).
- Recommended offer: $244k (23.6% below list) — sets the bar for 1% rule.
- Cap rate 6.2% vs local median 5.0% in The Villages — meaningfully above typical; check what's discounted (condition, days-on-market, listing class) to confirm the premium yield is real.
Location & tenants
- Location reads 70/100 on livability (#431 in FL) — a middle-class / working-renter tenant base. Strengths: crime A+, housing A, employment B+; Watch: amenities F, commute F, health & safety F.
- Sumter (rural): math 61% / reading 61% proficiency, ranked #11 of 73 in FL (top 15%) — acceptable for families but not a draw, mixed tenant base, ~2y average lease.
- Zoned schools: Wildwood Elementary School (math 49% / reading 52%, grade D+, #1,055 of 2,144 statewide, top 50%, 940 students, 76% FRL); Wildwood Middle/ High School (math 29% / reading 41%, grade F, #379 of 667 statewide, top 58%, 843 students, 63% FRL) — zoned schools average 69% FRL vs 51% district-wide (19 pts higher); higher-poverty schools than district average — tighter screening recommended.
- Zoned-school proficiency averages 43% at this address vs 61% district-wide (-18 pts) — the specific schools serving this property underperform the Sumter average; the district grade overstates school quality for this exact location.
- Market conditions: 160 active listings in the ZIP; 6 comparable units currently listed for rent nearby; rentals at typical pace (median 21d on market — plan ~3-4 weeks tenant-placement turnaround); solid renter incomes; 3,961 units permitted in Sumter County in 2024 (248 in 5+ unit buildings).
Forward outlook
- Local home prices are declining (-3.0%/yr); year-one equity from $2k of loan paydown is wiped out by about $10k of value loss. Plan a longer hold.
- Sumter County population projected at +45% by 2050 — long-run rental-demand tailwind backs the buy-and-hold thesis.
Negotiation context
- Only 14 days on market — expect competitive offers; lowballing is unlikely to land.
- 3 sale attempts since 4y ago with the ask held roughly flat each time — persistent listings suggest the price (not the market) is what's stuck; bring a comps-based counter.
- Current owner paid $265k; 21% above their basis — modest negotiation headroom, anchor on the comps not their cost.
Risks & watch-outs
- Watch-outs: flood insurance adds $66/mo.
- Climate carrying-cost: severe flood risk; severe wind risk, 99% chance of damaging wind over 30y; extreme-heat days projected 7→20/yr by 2055 (HVAC capex compounding) — expect insurance premiums to compound above CPI over the hold.
Questions for the listing agent
- What do current leases actually rent for vs. the listed asking? Can we see a recent rent roll and the last 12 months of T-12 income?
- What's the actual annual flood-insurance premium (NFIP or private), and is the property in a SFHA with mandatory coverage?
- Is there a deadline driving the sale (1031 exchange, divorce, estate, relocation)? That informs how much negotiation room exists.
- Schools are A-rated — typically a magnet for longer-tenancy family renters. What's the average tenant stay here, and is there a school-zone premium baked into asking?
- The area grade is low — what's the realistic commute time and amenity access for the typical tenant pool here? Any planned neighborhood developments (good or bad) we should know about?
- What's the average days-on-market for RENTAL listings here right now (not sales)? A rising rental-DOM trend means longer vacancies and softer asking-rent achievability than the comps imply.
- What's the recent tenant-quality profile in this submarket — average credit score on applications, eviction rate, late-payment / NSF rate, and stable-employment percentage? A property-management company in the area should have these aggregated.
- How much new for-sale + rental construction is in the pipeline within 1–3 miles? Heavy new supply typically softens prices + rents 12–24 months out; constrained supply supports both.
Investment metrics
- 1% rule
- 0.76% ✗
- Cap rate
- 6.22%
- Cash-on-cash
- -0.25%
- DSCR
- 0.99
- GRM
- 10.9
CMA / ARV
- ARV (on-the-fly)
- $313,472
- Comps found
- 1
Show comp detail 1 sale within ~0.75 mi
| Address | Dist | Beds/Ba | Sqft | Sold | Price | $/sf | Match |
|---|---|---|---|---|---|---|---|
| 5353 NE 136th Pl | 0.00mi | 4/3.0 | 1,984 (0%) | 1mo | $312,500 | $158 | 99 |
Match score weights: distance 35% · size 25% · config 20% · recency 20%. Top-matched comps best support the ARV.
Projected returns pro-forma
-3.0% appreciation · 3.0% rent growth · sell at horizon
- IRR
- -18.2%
- Equity multiple
- 0.36×
- Total profit
- $-57,377
- Equity at exit
- $47,713
- IRR
- -10.6%
- Equity multiple
- 0.36×
- Total profit
- $-57,305
- Equity at exit
- $27,668
Cash invested: $89,600 (down + closing). Projections, not guarantees.
Landlord ↔ Tenant lean methodology
- Overall (STATE)
- 87 Strongly Landlord-Friendly
- State Florida
- 87 Strongly Landlord-Friendly · R+3
- County
- — inherits STATE
- City
- — inherits STATE
ZIP-level market 34484
- Home prices YoY
- -31.3%
- Active inventory
- 160
- Price-to-rent
- 10.9×
Monthly cashflow live
- Estimated rent
- $2,445 high interval (Pro) →
- Mortgage (P&I)
- −$1,678
- Tax from tax record
- −$139 /mo · $1,667/yr
- Insurance
- −$133
- Flood insurance flood zone
- −$66 /mo · $798/yr
- HOA
- −$0
- Vacancy / Maint / Mgmt
- −$513
- Net cashflow
- $-85
Break-even live
UW: 25.0% down · 7.5% · 30yr · 1.5% tax · 5.0% vac · 8.0% maint · 8.0% mgmt
Financing live
Cash to close
- Down payment
- $80,000
- Closing costs
- $9,600
- Reserves months
- —
- Total cash needed
- —
Loan-product check · same deal, 3 products live
Conventional
25% down · 7.5% · 30yr
- Down + closing
- —
- Monthly P&I
- —
- Monthly cashflow
- —
- DSCR
- —
- Eligible?
- —
Personal DTI + credit; lowest rate.
DSCR
20% down · 8.5% · 30yr
- Down + closing
- —
- Monthly P&I
- —
- Monthly cashflow
- —
- DSCR
- —
- Eligible?
- —
No personal income docs; deal must DSCR.
Hard money
10% down · 12.0% · 12mo
- Down + closing
- —
- Monthly P&I
- —
- Monthly cashflow
- —
- DSCR
- —
- Eligible?
- —
Short-term bridge; refi at stabilization.
Rent comps 6 comps
| Address | Beds | Baths | Sqft | Rent | $/sqft | DOM | Units | Dist |
|---|---|---|---|---|---|---|---|---|
| 3057 Saint Thomas Ln The Villages, FL | 3.0 | 2.0 | 2044 | $2,850 | $1.39 | 21d | 1 | 1.05mi |
| 12580 NE 49th Dr Oxford, FL | 3.0 | 2.0 | 1940 | $2,400 | $1.24 | 21d | 1 | 1.10mi |
| 971 Kingmont Ter The Villages, FL | 3.0 | 2.0 | 1392 | $3,400 | $2.44 | 21d | 1 | 1.27mi |
| 17713 SE 95th Cir Summerfield, FL | 3.0 | 2.0 | 1450 | $2,000 | $1.38 | 21d | 1 | 1.32mi |
| 12362 NE 50th Vw Oxford, FL | 4.0 | 4.0 | 1929 | $2,300 | $1.19 | 21d | 1 | 1.39mi |
| 12388 NE 48th Loop Oxford, FL | 3.0 | 2.0 | 1426 | $1,700 | $1.19 | 21d | 1 | 1.40mi |
Listing history 10 events
-
2026-03-27status Pending
-
2026-03-13$320,000 Active
-
2022-07-12soldstatus $265,000 Closed 158-char remark
Show marketing remark (158 chars)
Back on the market! New roof, well maintained one owner mobile home near The Villages. This great home has 4 bedrooms and 3 bathrooms on rare one acre parcel.
-
2022-05-26status Pending 158-char remark
Show marketing remark (158 chars)
Back on the market! New roof, well maintained one owner mobile home near The Villages. This great home has 4 bedrooms and 3 bathrooms on rare one acre parcel.
-
2022-05-23price $275,000 158-char remark
Show marketing remark (158 chars)
Back on the market! New roof, well maintained one owner mobile home near The Villages. This great home has 4 bedrooms and 3 bathrooms on rare one acre parcel.
-
2022-05-17status Active 158-char remark
Show marketing remark (158 chars)
Back on the market! New roof, well maintained one owner mobile home near The Villages. This great home has 4 bedrooms and 3 bathrooms on rare one acre parcel.
-
2022-04-02status Pending 158-char remark
Show marketing remark (158 chars)
Back on the market! New roof, well maintained one owner mobile home near The Villages. This great home has 4 bedrooms and 3 bathrooms on rare one acre parcel.
-
2022-04-01$250,000 Active 158-char remark
Show marketing remark (158 chars)
Back on the market! New roof, well maintained one owner mobile home near The Villages. This great home has 4 bedrooms and 3 bathrooms on rare one acre parcel.
-
2005-02-14soldstatus $40,900
-
1997-09-22soldstatus $15,000
ⓘ Source: listings_history table (triggers on properties + properties_extension) + one-shot
backfill from property_details.listing_events for pre-trigger history.
Tax reassessment forecast FL · Resets to sale price
- Current annual tax
- $1,667 · $139/mo
- Projected year-2 tax
- $2,656 · $221/mo
- Expected delta
- +$989/yr (+$82/mo · 59.3%)
ⓘ Screening estimate from a state-policy table — verify with the county assessor before closing.
Climate risk First Street
- Flood 8/10 Severe FEMA zone X (unshaded) · 99% chance over 30 yrs
- Wildfire 4/10 Moderate
- Heat 8/10 Severe 7 d/yr ≥109°F today · 20 d/yr by 30 yrs out
- Wind 9/10 Extreme 99% chance of damaging wind over 30 yrs
- Air quality 3/10 Moderate 2 unhealthy d/yr today · 2 by 30 yrs out
Nearby sold comps map
Loading sold comps map…
Walkable amenities ~0.75 mi
Loading nearby amenities…
Taxation est. · year 1
- Rental income
- $29,338
- − Mortgage interest
- −$17,925
- − Property taxes
- −$1,667
- − Insurance
- −$2,398
- − Repairs & maintenance
- −$2,347
- − Management
- −$2,347
- − Depreciation
- −$9,309
- Taxable loss
- −$6,655
- Est. tax savings @ 24.0%
- +$1,597
- After-tax cash flow
- $572/yr
For passive investors: Depreciation is non-cash, so a rental often shows a tax loss while cash-flowing — sheltering income. Rental losses are passive: they offset passive income freely, and up to $25,000/yr can offset ordinary (W-2) income if you actively participate and your MAGI is under $100k (phasing out to $0 by $150k); unused losses carry forward. On sale, claimed depreciation is recaptured at up to 25%, and gains may owe capital-gains tax (a 1031 exchange can defer both). Figures are a year-1 estimate at your 24.0% rate — not tax advice; consult a CPA.
Schools (NCES district)
- District
- Sumter
- NCES district ID
- 1201800
- Math proficiency
- 61% ▼ -4.00%
- Reading proficiency
- 61% ▼ -2.00%
- Median HH income
- $48,240
- Composite
- 51.74/100
- National rank
- #1682
- State rank
- #11 of 73 in FL
Livability — The Villages
- Score
- 70/100
- State rank
- #431
- US rank
- #7363
Category grades
Schools grade is shown separately in the Schools card above.
Census & demographics
- County
- Sumter County · 110,591 people
- City population
- 83,973
- Metro
- The Villages, FL
- Population (ZIP)
- 5,050
- Household income
- $92,582
- Rent vs Own
- Severe rent burden
- 149.0
Population outlook (Sumter County) Hauer SSP2
- Today (2025)
- 161,172 people
- By 2030
- 180,083 · +11.7%
- By 2040
- 209,892 · +30.2%
- By 2050
- 234,186 · +45.3%
- By 2075
- 284,602 · +76.6%
- By 2100
- 317,039 · +96.7%
Race, ethnicity, and origin ACS 2023
- Neighborhood character
- Predominantly White (82%)
- Race & ethnicity
- White 82% Black 7% Two or more races 6% Hispanic / Latino 5% Asian 2%
- Common ancestry
- Lithuanian 5% Romanian 3% Italian 2%
- Foreign-born
- 4% · Canada, Philippines, Jamaica
- Languages at home
- 95% English-only · Spanish 4% Other Asian/Pacific 1%
Political lean MEDSL · Sumter
- 2024 margin
- Solid R (+37.6) · D 30.9% · R 68.6%
- 2008→2024 swing
- -10.6pp toward R · 2008: -27.0pp · 2024: -37.6pp
- All cycles
- 2024: R+37.6 2020: R+36.1 2016: R+39.2 2012: R+34.9 2008: R+27.0
Not yet ingested
- Civics
- —
Market trends
- HPI YoY
- ▼ -86.11%
- Current HPI
- 189.0678
- Rent YoY
- —
- Metro
- The Villages, FL
- State GDP YoY
- ▲ 3.28%
- F500 in state
- 36
Industry mix (Fortune 500 HQ in FL)
| Industry | F500 HQs | Revenue |
|---|---|---|
| Industrial Technology | 2 | $29B |
|
||
| Insurance | 2 | $17B |
|
||
| Retail | 1 | $60B |
|
||
| Technology Distribution | 1 | $58B |
|
||
| Homebuilding | 1 | $35B |
|
||
| Technology Manufacturing | 1 | $35B |
|
||
Price history
+2033.3% since first listed10 events — show timeline
- 2026-03-27 Pending — Stellar MLS as Distributed by MLS Grid
- 2026-03-13 Listed $320,000 Stellar MLS as Distributed by MLS Grid
- 2022-07-12 Sold (MLS) $265,000 Stellar MLS as Distributed by MLS Grid
- 2022-05-26 Pending — Stellar MLS as Distributed by MLS Grid
- 2022-05-23 Price Changed $275,000 Stellar MLS as Distributed by MLS Grid
- 2022-05-17 Relisted — Stellar MLS as Distributed by MLS Grid
- 2022-04-02 Pending — Stellar MLS as Distributed by MLS Grid
- 2022-04-01 Listed $250,000 Stellar MLS as Distributed by MLS Grid
- 2005-02-14 Sold (Public Records) $40,900 Public Records
- 1997-09-22 Sold (Public Records) $15,000 Public Records
Property tax history
+5.2%/yrLatest (2025): $1,667 · -1.0% YoY. Source: county tax records.
Cash-flow waterfall
monthlySold comps — $/sqft
last 12 mo · ≤1 miLoading sold comps…