 Duplex
5742 N 99th St #5744 · Milwaukee, WI
Flood risk 1/10 · Minimal
- FEMA flood zone
- X (unshaded)
- Chance of flooding over 30 yrs
- 0.0%
- Est. flood insurance / yr
- $473 – $860
Fire risk 1/10 · Minimal
- Est. fire insurance / yr
- $636 – $1,182
Heat risk 2/10 · Minimal
- Hot days now (above 101°F)
- 7 days/yr
- Hot days in 30 yrs
- 13 days/yr
Wind risk 2/10 · Minimal
- Chance of severe wind over 30 yrs
- —
Air-quality risk 2/10 · Minimal
- Unhealthy air days now
- 2 days/yr
- Unhealthy air days in 30 yrs
- 2 days/yr
Risk factors via First Street. Map © Google.
Why this score? — see what drove the C grade
The composite is a weighted blend of 9 inputs, each scored 0–100. Each bar is that input's sub-score; the figure is the points it added to the 100-point composite (weight × sub-score).
- Cash flow +26.0/30.0
- DSCR +8.7/10.0
- 1% rule +6.9/10.0
- ARV discount +4.7/15.0
- Rent growth +4.3/5.0
- Livability +4.0/5.0
- Condition / age +2.2/5.0
- Schools +1.2/10.0
- Appreciation +0.0/10.0
$219,500
🖨 Deal sheet 📄 Offer letter ✓ Due diligence
Multi-family units
County records classify this as Multi-Family (2-4 Unit). Listing-text estimate: 2 units. confirmed
Listing remarks MLS
This 2 story duplex is perfect if you are looking for an investment property. Both units feature 3 bedrooms and one bath. Property features a detached garage. This duplex is fully rented at a total of $1,850/month with month to month leases. Property is being sold in AS IS Condition.
Key facts
- 3 bedroom layouts
- 3 car garage
- 5,662 sq ft lot
Tags
Property features AI
Finance
- Other: Two separate residential units
Exterior
- Parking: Detached 3-car garage
- Utilities: Municipal water; Municipal sewer; 2 electric meters; 2 gas meters
- Home design: 2-story duplex; Multi-family property
- Construction: Less than 1/2 acre lot (approximately 0.13 acre); Zoned RT2
- Exterior features: Brick, stone and vinyl exterior
Interior
- Kitchen: Unit 2 kitchen located on upper level
- Bedrooms: Unit 1: 3 bedrooms; Unit 2: 3 bedrooms (master and other bedrooms on upper level)
- Bathrooms: Unit 1: 1 full bathroom; Unit 2: 1 full bathroom
- Interior features: Full basement with block construction
Neighborhood map
What this means for you Summary
Snapshot
- This is a 2 × 3-bed/1.0-bath units multifamily listed at $220k. Condition is rated fair.
Deal economics
- At list price, monthly cash flow is $544 ($7k/yr) — positive. Per door: $272/mo.
- The deal already cash-flows at list — no discount required.
- Meets the 1% rule at list price ($3k rent vs $220k).
- Recommended offer: $216k (1.5% below list) — sets the bar for market timing.
- Cap rate 9.3% vs local median 5.1% in Milwaukee — top-decile yield for the area; either an underpriced asset or a hidden risk that comps aren't pricing in. Stress-test before assuming the spread holds.
Location & tenants
- Location reads 81/100 on livability (#55 in WI, #1,534 nationally) — a professional / high-income tenant draw. Strengths: amenities A+, commute A+, cost of living A+; Watch: employment D+, schools F, crime F.
- Milwaukee School District (urban): math 10% / reading 18% proficiency, ranked #337 of 342 in WI (top 98%) — low school quality limits family demand, transient renter base, plan for 1-2y turnover; 77% free/reduced lunch — lower-income household profile, screen leases tightly.
- Market conditions: Rents rising fast (+7.1%/yr); 45 active listings in the ZIP; 1,017 units permitted in Milwaukee County in 2024 (803 in 5+ unit buildings).
- At $2,609/mo this rent would consume 55% of the median local household income ($57k/yr) (locally 1391% of renters already pay >50% of income on rent) — very limited rent-growth headroom before tenants either downsize or default.
Forward outlook
- Local home prices are declining (-3.0%/yr); year-one equity from $2k of loan paydown is wiped out by about $7k of value loss. Plan a longer hold.
- Milwaukee County population projected at +4% by 2050 — modest demand growth; plan on rents tracking national, not racing it.
- At projected returns (-3.0% appreciation + 7.1% rent growth), your $61k cash investment doubles in ~8 years — after that, you're playing with house money.
Negotiation context
- It's been on market 20 days — a 2% lower offer ($216k) is reasonable based on typical stale-listing flexibility.
- 7 sale attempts since 5y ago with the ask held roughly flat each time — persistent listings suggest the price (not the market) is what's stuck; bring a comps-based counter.
- Current owner paid $138k; list at $220k implies a 60% gain — meaningful room to come down on a strong offer.
Questions for the listing agent
- Can we see the unit-by-unit rent roll, current vacancy, and any below-market leases? What's the average tenancy length?
- What capital expenditures (roof, boiler, parking lot, exteriors) have been made in the last 5 years, and what's planned in the next 2?
- Have any recent inspections been done? Can we get a copy of the seller's disclosures and any deferred-maintenance estimates?
- Built in 1964 — when were the roof, HVAC, electrical panel, plumbing, and water heater last replaced?
- Is there a deadline driving the sale (1031 exchange, divorce, estate, relocation)? That informs how much negotiation room exists.
- Schools are F-rated, which usually means shorter tenancies and higher turnover. Who's the typical renter profile here, and what's been the actual vacancy rate?
- Crime grade is F in this area — have there been break-ins, vandalism, or insurance claims at this property in the last 3 years? What carrier currently insures it and at what premium?
- What's the average days-on-market for RENTAL listings here right now (not sales)? A rising rental-DOM trend means longer vacancies and softer asking-rent achievability than the comps imply.
- What's the recent tenant-quality profile in this submarket — average credit score on applications, eviction rate, late-payment / NSF rate, and stable-employment percentage? A property-management company in the area should have these aggregated.
- How much new apartment / multifamily construction is in the pipeline within 1–3 miles? Heavy new supply (>2% of stock underway) typically softens rents 12–24 months out; light construction supports rent growth.
Investment metrics
- 1% rule
- 1.19% ✓
- Cap rate
- 9.27%
- Cash-on-cash
- 10.63%
- DSCR
- 1.47
- GRM
- 7.0
CMA / ARV
- ARV (on-the-fly)
- $206,448
- Comps found
- 12
Show comp detail 12 sales within ~0.75 mi
| Address | Dist | Beds/Ba | Sqft | Sold | Price | $/sf | Match |
|---|---|---|---|---|---|---|---|
| 5728 N 98th St #5730 | 0.06mi | 5/2.0 (-1) | 2,021 (-0%) | 14mo | $207,000 | $102 | 81 |
| 5671 N 98th St #5673 | 0.09mi | 5/2.0 (-1) | 2,041 (+1%) | 13mo | $245,000 | $120 | 79 |
| 5723 N 97th St #5725 | 0.09mi | 5/2.0 (-1) | 2,077 (+3%) | 10mo | $205,150 | $99 | 78 |
| 5812 N 94th St #5814 | 0.33mi | 6/2.0 | 1,983 (-2%) | 12mo | $230,000 | $116 | 71 |
| 5368 N 103rd St #5370 | 0.56mi | 6/2.0 | 2,056 (+2%) | 4mo | $245,000 | $119 | 68 |
| 5666 N 97th St #5668 | 0.15mi | 5/2.0 (-1) | 1,799 (-11%) | 3mo | $194,900 | $108 | 67 |
| 5822 N 92nd St | 0.45mi | 5/2.5 (-1) | 2,168 (+7%) | 4mo | $158,000 | $73 | 57 |
| 5743 N 91st St #5745 | 0.46mi | 6/2.0 | 2,144 (+6%) | 20mo | $199,900 | $93 | 52 |
| 5816 N 94th St #5818 | 0.33mi | 5/2.0 (-1) | 1,856 (-8%) | 17mo | $167,100 | $90 | 52 |
| 5806 N 92nd St Unit 5806A | 0.44mi | 5/2.5 (-1) | 2,276 (+12%) | 17mo | $195,000 | $86 | 37 |
| 10741 W Wren Ave #10743 | 0.61mi | 6/3.0 | 2,242 (+11%) | 19mo | $264,500 | $118 | 33 |
| 6294 N Denmark St #6296 | 0.70mi | 6/3.0 | 2,324 (+15%) | 22mo | $195,000 | $84 | 21 |
Match score weights: distance 35% · size 25% · config 20% · recency 20%. Top-matched comps best support the ARV.
Projected returns pro-forma
-3.0% appreciation · 7.14% rent growth · sell at horizon
- IRR
- 4.2%
- Equity multiple
- 1.17×
- Total profit
- $10,451
- Equity at exit
- $32,728
- IRR
- 17.3%
- Equity multiple
- 2.70×
- Total profit
- $104,489
- Equity at exit
- $18,978
Cash invested: $61,460 (down + closing). Projections, not guarantees.
Landlord ↔ Tenant lean methodology
- Overall (STATE)
- 73 Landlord-Friendly
- State Wisconsin
- 73 Landlord-Friendly · R+2
- County
- — inherits STATE
- City
- — inherits STATE
ZIP-level market 53225
- Home prices YoY
- -21.1%
- Rents YoY
- 7.1%
- Active inventory
- 45
- Price-to-rent
- 14.0×
Monthly cashflow live
- Estimated rent
- $2,609 high interval (Pro) →
- Mortgage (P&I)
- −$1,151
- Tax est. 1.5%
- −$274 /mo · $3,292/yr
- Insurance
- −$91
- HOA
- −$0
- Vacancy / Maint / Mgmt
- −$548
- Net cashflow
- $544
Break-even live
2-unit breakdown (identical units grouped — click to expand)
| Units | Beds | Baths | Est. rent |
|---|---|---|---|
| 2× units | 3 | 1 | $2,608 |
| #1 | 3 | 1 | $1,304 |
| #2 | 3 | 1 | $1,304 |
| Total (2 units) | $2,609 | ||
UW: 25.0% down · 7.5% · 30yr · 1.5% tax · 5.0% vac · 8.0% maint · 8.0% mgmt
Financing live
Cash to close
- Down payment
- $54,875
- Closing costs
- $6,585
- Reserves months
- —
- Total cash needed
- —
Loan-product check · same deal, 3 products live
Conventional
25% down · 7.5% · 30yr
- Down + closing
- —
- Monthly P&I
- —
- Monthly cashflow
- —
- DSCR
- —
- Eligible?
- —
Personal DTI + credit; lowest rate.
DSCR
20% down · 8.5% · 30yr
- Down + closing
- —
- Monthly P&I
- —
- Monthly cashflow
- —
- DSCR
- —
- Eligible?
- —
No personal income docs; deal must DSCR.
Hard money
10% down · 12.0% · 12mo
- Down + closing
- —
- Monthly P&I
- —
- Monthly cashflow
- —
- DSCR
- —
- Eligible?
- —
Short-term bridge; refi at stabilization.
Listing history 14 events
-
2026-06-18days on market $219,500 Active 20 DOM
-
2026-06-17days on market $219,500 Active 19 DOM
-
2026-06-16statusdays on market $219,500 Active 18 DOM
-
2026-06-15days on market $219,500 Contingent 17 DOM
-
2026-06-13days on market $219,500 Contingent 15 DOM
-
2026-06-13days on market $219,500 Contingent 14 DOM
-
2026-06-09days on market $219,500 Contingent 11 DOM
-
2026-06-08days on market $219,500 Contingent 10 DOM
-
2026-06-07days on market $219,500 Contingent 9 DOM
-
2026-06-05days on market $219,500 Contingent 6 DOM
-
2026-06-03statusdays on market $219,500 Contingent 5 DOM
-
2026-06-02days on market $219,500 Active 4 DOM
-
2026-06-01days on market $219,500 Active 3 DOM
-
2026-05-31days on market $219,500 Active 2 DOM
ⓘ Source: listings_history table (triggers on properties + properties_extension) + one-shot
backfill from property_details.listing_events for pre-trigger history.
Climate risk First Street
- Flood 1/10 Low FEMA zone X (unshaded) · 0% chance over 30 yrs
- Wildfire 1/10 Low
- Heat 2/10 Low 7 d/yr ≥101°F today · 13 d/yr by 30 yrs out
- Wind 2/10 Low
- Air quality 2/10 Low 2 unhealthy d/yr today · 2 by 30 yrs out
Nearby sold comps map
Loading sold comps map…
Walkable amenities ~0.75 mi
Loading nearby amenities…
Taxation est. · year 1
- Rental income
- $31,308
- − Mortgage interest
- −$12,295
- − Property taxes
- −$3,292
- − Insurance
- −$1,098
- − Repairs & maintenance
- −$2,505
- − Management
- −$2,505
- − Depreciation
- −$6,385
- Taxable income
- $3,228
- Est. tax owed @ 24.0%
- −$775
- After-tax cash flow
- $5,756/yr
For passive investors: Depreciation is non-cash, so a rental often shows a tax loss while cash-flowing — sheltering income. Rental losses are passive: they offset passive income freely, and up to $25,000/yr can offset ordinary (W-2) income if you actively participate and your MAGI is under $100k (phasing out to $0 by $150k); unused losses carry forward. On sale, claimed depreciation is recaptured at up to 25%, and gains may owe capital-gains tax (a 1031 exchange can defer both). Figures are a year-1 estimate at your 24.0% rate — not tax advice; consult a CPA.
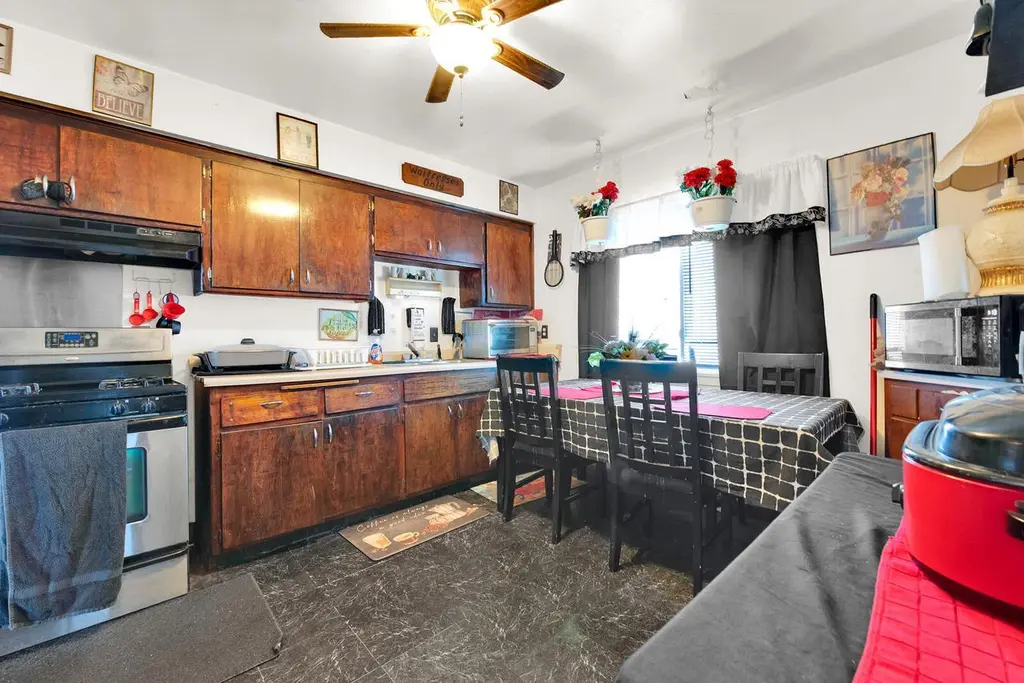
Condition & rehab AI · 12 photos
This multi-family property requires moderate renovations to update the kitchen and bathrooms, which will significantly increase its resale and rental value.
Repairs flagged
- Major kitchen cabinets — severely dated and worn
- Major kitchen countertops — severely worn and outdated
- Major bathroom fixtures — dated and cluttered
- Major flooring — worn linoleum
Value-add opportunities
- Both update kitchen cabinets and countertops — modernizing the kitchen will appeal to both buyers and renters
- Both update bathroom fixtures and organization — modernizing the bathroom will appeal to both buyers and renters
- Both replace worn flooring — new flooring will improve the overall appearance and functionality of the home
Renovation cost estimate screening
| Repair item | Severity | Est. cost |
|---|---|---|
| kitchen cabinets · severely dated and worn | Major | $15,000–50,000 |
| kitchen countertops · severely worn and outdated | Major | $15,000–50,000 |
| bathroom fixtures · dated and cluttered | Major | $15,000–50,000 |
| flooring · worn linoleum | Major | $15,000–50,000 |
| Total estimated repair cost · 4 items | $60,000–200,000 |
Value-add ROI direction
- Both update kitchen cabinets and countertops — modernizing the kitchen will appeal to both buyers and renters ↑
- Both update bathroom fixtures and organization — modernizing the bathroom will appeal to both buyers and renters ↑
- Both replace worn flooring — new flooring will improve the overall appearance and functionality of the home ↑
ⓘ Cost ranges are severity-bucket heuristics (US national rule-of-thumb). Get contractor quotes + a written scope before underwriting a rehab budget.
Schools (NCES district)
- District
- Milwaukee School District
- NCES district ID
- 5509600
- Math proficiency
- 10% ▼ -5.00%
- Reading proficiency
- 18% ▬ 0.00%
- Median HH income
- $36,339
- Composite
- 11.61/100
- National rank
- #9696
- State rank
- #337 of 342 in WI
Livability — Milwaukee
- Score
- 81/100
- State rank
- #55
- US rank
- #1534
Category grades
Schools grade is shown separately in the Schools card above.
Census & demographics
- Census place
- Milwaukee, WI
- County
- Milwaukee County · 926,379 people
- City population
- 573,768
- Metro
- Milwaukee-Waukesha, WI
- Population (ZIP)
- 25,187
- Household income
- $56,545
- Rent vs Own
- Severe rent burden
- 1391.0
Population outlook (Milwaukee County) Hauer SSP2
- Today (2025)
- 995,758 people
- By 2030
- 1,009,124 · +1.3%
- By 2040
- 1,028,128 · +3.3%
- By 2050
- 1,040,066 · +4.4%
- By 2075
- 1,057,849 · +6.2%
- By 2100
- 1,039,774 · +4.4%
Race, ethnicity, and origin ACS 2023
- Neighborhood character
- Diverse neighborhood (Simpson 0.59)
- Race & ethnicity
- Black 58% White 26% Two or more races 7% Asian 6% Hispanic / Latino 5%
- Hispanic origin (detail)
- Mexican 2% Puerto Rican 3%
- Common ancestry
- Romanian 2% Lithuanian 2% Iranian 1%
- Foreign-born
- 8% · Canada, Vietnam
- Languages at home
- 89% English-only · Other Asian/Pacific 4% Spanish 3% Other Indo-European 1%
Political lean MEDSL · Milwaukee
- 2024 margin
- Solid D (+38.5) · D 68.3% · R 29.8% · Other 1.8%
- 2008→2024 swing
- +2.7pp toward D · 2008: 35.9pp · 2024: 38.5pp
- All cycles
- 2024: D+38.5 2020: D+39.9 2016: D+37.5 2012: D+34.6 2008: D+35.9
Not yet ingested
- Civics
- —
Market trends
- HPI YoY
- ▼ -70.59%
- Current HPI
- 264.1941
- Rent YoY
- ▲ 7.14%
- Metro
- Milwaukee-Waukesha, WI
- State GDP YoY
- ▲ 2.10%
- F500 in state
- 20
Industry mix (Fortune 500 HQ in WI)
| Industry | F500 HQs | Revenue |
|---|---|---|
| Industrial Machinery | 4 | $23B |
|
||
| Industrial Technology | 2 | $36B |
|
||
| Insurance | 1 | $36B |
|
||
| Professional Services | 1 | $19B |
|
||
| Utilities | 1 | $9B |
|
||
| Consumer Goods | 1 | $3B |
|
||
Price history
+15.6% since first listed26 events — show timeline
- 2026-05-29 Listed $219,500 METROMLS
- 2024-10-24 Rental Removed $845 APPFOLIO
- 2024-10-09 Listed for Rent $845 APPFOLIO
- 2022-07-01 Listing Removed — METROMLS
- 2022-06-08 Sold (MLS) $137,500 METROMLS
- 2022-06-01 Relisted — METROMLS
- 2022-06-01 Listing Removed — METROMLS
- 2022-04-22 Contingent — METROMLS
- 2022-04-21 Price Changed $149,900 METROMLS
- 2022-04-17 Price Changed $154,900 METROMLS
- 2022-04-04 Price Changed $159,900 METROMLS
- 2022-03-21 Relisted — METROMLS
- 2022-02-04 Contingent — METROMLS
- 2022-01-01 Listing Removed — METROMLS
- 2022-01-01 Listed $164,900 METROMLS
- 2021-12-08 Price Changed $164,900 METROMLS
- 2021-11-20 Relisted — METROMLS
- 2021-11-15 Contingent — METROMLS
- 2021-10-23 Price Changed $171,900 METROMLS
- 2021-10-16 Price Changed $172,900 METROMLS
- 2021-09-15 Price Changed $173,900 METROMLS
- 2021-08-28 Price Changed $174,900 METROMLS
- 2021-08-05 Price Changed $179,900 METROMLS
- 2021-07-27 Price Changed $184,900 METROMLS
- 2021-07-11 Price Changed $188,900 METROMLS
- 2021-06-19 Listed $189,900 METROMLS
Cash-flow waterfall
monthlySold comps — $/sqft
last 12 mo · ≤1 miLoading sold comps…