17311 E US Highway 40 Site Unit L23 · Independence, MO
Flood risk 1/10 · Minimal
- FEMA flood zone
- X (unshaded)
- Chance of flooding over 30 yrs
- 0.0%
- Est. flood insurance / yr
- $507 – $1,088
Fire risk 1/10 · Minimal
- Est. fire insurance / yr
- $1,054 – $1,958
Heat risk 4/10 · Minor
- Hot days now (above 108°F)
- 7 days/yr
- Hot days in 30 yrs
- 17 days/yr
Wind risk 2/10 · Minimal
- Chance of severe wind over 30 yrs
- —
Air-quality risk 3/10 · Minor
- Unhealthy air days now
- 3 days/yr
- Unhealthy air days in 30 yrs
- 3 days/yr
Risk factors via First Street. Map © Google.
Why this score? — see what drove the B- grade
The composite is a weighted blend of 9 inputs, each scored 0–100. Each bar is that input's sub-score; the figure is the points it added to the 100-point composite (weight × sub-score).
- Cash flow +30.0/30.0
- DSCR +10.0/10.0
- 1% rule +9.2/10.0
- ARV discount +7.5/15.0
- Livability +4.1/5.0
- Rent growth +3.8/5.0
- Schools +2.7/10.0
- Condition / age +2.2/5.0
- Appreciation +0.0/10.0
$124,900
🖨 Deal sheet 📄 Offer letter ✓ Due diligence
Listing remarks
Just In Time For Summer, Your New Home Is Here!
Key facts
- Built 2026
- Listed 13 days
Property features AI
Finance
- Financial info: List price $124,900
Exterior
- Home design: Single-family residence (Highland Manor plan); Living area approximately 1,344
- Exterior features: Located on E US Highway 40 (Site L23)
Interior
- Bedrooms: 3 bedrooms
- Bathrooms: 2 bathrooms (full)
- Interior features: Spec home (Highland Manor plan); Active listing
Neighborhood map
What this means for you Summary
Snapshot
- This is a 3-bed/2.0-bath manufactured listed at $125k. Condition is rated fair.
Deal economics
- At list price, monthly cash flow is $538 ($6k/yr) — positive.
- The deal already cash-flows at list — no discount required.
- Meets the 1% rule at list price ($2k rent vs $125k).
- Cap rate 11.5% vs local median 5.0% in Independence — top-decile yield for the area; either an underpriced asset or a hidden risk that comps aren't pricing in. Stress-test before assuming the spread holds.
Location & tenants
- Location reads 82/100 on livability (#10 in MO, #1,296 nationally) — a professional / high-income tenant draw. Strengths: amenities A+, commute A+, cost of living A+; Watch: schools C-, employment D+, crime F.
- Independence 30 (suburban): math 26% / reading 38% proficiency, ranked #252 of 324 in MO (top 78%) — families likely to look elsewhere, expect single-tenant / working-renter base with shorter leases.
- Market conditions: Rents rising fast (+5.1%/yr); 200 active listings in the ZIP; 13 comparable units currently listed for rent nearby; rentals leasing fast (median 13d on market — plan ~1-2 weeks tenant-placement turnaround); 4,002 units permitted in Jackson County in 2024 (2,271 in 5+ unit buildings).
- This rent runs 34% of the median local income ($62k/yr) — at the standard rent-burdened threshold; future hikes will face affordability resistance.
Forward outlook
- Local home prices are declining (-3.0%/yr); year-one equity from $864 of loan paydown is wiped out by about $4k of value loss. Plan a longer hold.
- Jackson County population projected at +4% by 2050 — modest demand growth; plan on rents tracking national, not racing it.
- At projected returns (-3.0% appreciation + 5.1% rent growth), your $35k cash investment doubles in ~6 years — after that, you're playing with house money.
Negotiation context
- Only 13 days on market — expect competitive offers; lowballing is unlikely to land.
Questions for the listing agent
- Have any recent inspections been done? Can we get a copy of the seller's disclosures and any deferred-maintenance estimates?
- Is there a deadline driving the sale (1031 exchange, divorce, estate, relocation)? That informs how much negotiation room exists.
- Crime grade is F in this area — have there been break-ins, vandalism, or insurance claims at this property in the last 3 years? What carrier currently insures it and at what premium?
- What's the average days-on-market for RENTAL listings here right now (not sales)? A rising rental-DOM trend means longer vacancies and softer asking-rent achievability than the comps imply.
- What's the recent tenant-quality profile in this submarket — average credit score on applications, eviction rate, late-payment / NSF rate, and stable-employment percentage? A property-management company in the area should have these aggregated.
- How much new for-sale + rental construction is in the pipeline within 1–3 miles? Heavy new supply typically softens prices + rents 12–24 months out; constrained supply supports both.
Investment metrics
- 1% rule
- 1.42% ✓
- Cap rate
- 11.46%
- Cash-on-cash
- 18.47%
- DSCR
- 1.82
- GRM
- 5.9
CMA / ARV
No comps found within radius.
Projected returns pro-forma
-3.0% appreciation · 5.09% rent growth · sell at horizon
- IRR
- 12.5%
- Equity multiple
- 1.51×
- Total profit
- $17,880
- Equity at exit
- $18,623
- IRR
- 23.0%
- Equity multiple
- 3.18×
- Total profit
- $76,135
- Equity at exit
- $10,799
Cash invested: $34,972 (down + closing). Projections, not guarantees.
Landlord ↔ Tenant lean methodology
- Overall (STATE)
- 81 Strongly Landlord-Friendly
- State Missouri
- 81 Strongly Landlord-Friendly · R+10
- County
- — inherits STATE
- City
- — inherits STATE
ZIP-level market 64055
- Rents YoY
- 5.1%
- Active inventory
- 200
- Price-to-rent
- 5.9×
Monthly cashflow live
- Estimated rent
- $1,774 high interval (Pro) →
- Mortgage (P&I)
- −$655
- Tax est. 1.5%
- −$156 /mo · $1,874/yr
- Insurance
- −$52
- HOA
- −$0
- Vacancy / Maint / Mgmt
- −$373
- Net cashflow
- $538
Break-even live
UW: 25.0% down · 7.5% · 30yr · 1.5% tax · 5.0% vac · 8.0% maint · 8.0% mgmt
Financing live
Cash to close
- Down payment
- $31,225
- Closing costs
- $3,747
- Reserves months
- —
- Total cash needed
- —
Loan-product check · same deal, 3 products live
Conventional
25% down · 7.5% · 30yr
- Down + closing
- —
- Monthly P&I
- —
- Monthly cashflow
- —
- DSCR
- —
- Eligible?
- —
Personal DTI + credit; lowest rate.
DSCR
20% down · 8.5% · 30yr
- Down + closing
- —
- Monthly P&I
- —
- Monthly cashflow
- —
- DSCR
- —
- Eligible?
- —
No personal income docs; deal must DSCR.
Hard money
10% down · 12.0% · 12mo
- Down + closing
- —
- Monthly P&I
- —
- Monthly cashflow
- —
- DSCR
- —
- Eligible?
- —
Short-term bridge; refi at stabilization.
Rent comps 13 comps
| Address | Beds | Baths | Sqft | Rent | $/sqft | DOM | Units | Dist |
|---|---|---|---|---|---|---|---|---|
| 17312 E 50th Terrace Ct S Independence, MO | 3.0 | 2.0 | 1244 | $2,050 | $1.65 | 21d | 1 | 0.29mi |
| 4580 Bass Pro Dr Independence, MO | 1.0–2.0 | 1.0–2.0 | 1114 | $1,829 | $1.64 | 2d | 10 | 0.52mi |
| 16301 E 48th Ter Kansas City, MO | 1.0–2.0 | 1.0–2.0 | 945 | $1,270 | $1.34 | 21d | 7 | 0.63mi |
| 5006 Breckenridge Ave Kansas City, MO | 3.0 | 2.0 | 1220 | $1,695 | $1.39 | 21d | 1 | 0.87mi |
| 4020 S Crackerneck Rd Independence, MO | 3.0 | 3.0 | 1488 | $2,200 | $1.48 | 2d | 1 | 0.95mi |
| 3926 S Redwood Dr Independence, MO | 2.0 | 1.0 | 945 | $1,050 | $1.11 | 23d | 1 | 1.07mi |
| 3100 Quail Creek Dr Independence, MO | 1.0–2.0 | 1.0 | 961 | $1,330 | $1.38 | 12d | 1 | 1.10mi |
| 15404 E 48th St Kansas City, MO | 2.0 | 1.5 | 1325 | $1,350 | $1.02 | 23d | 1 | 1.20mi |
| 15312 E 48th St Kansas City, MO | 3.0 | 2.0 | 1160 | $1,700 | $1.47 | 12d | 1 | 1.24mi |
| 19301 E Eastland Center Ct Independence, MO | 1.0–2.0 | 1.0 | 750 | $1,575 | $2.10 | 3d | 5 | 1.28mi |
| 4631 S Eastland Center Dr Independence, MO | 1.0–3.0 | 1.0–3.0 | 1022 | $1,919 | $1.88 | 2d | 22 | 1.31mi |
| 4631 S Eastland Center Dr Independence, MO | 1.0–3.0 | 1.0–3.0 | 1022 | $2,044 | $2.00 | 44d | 29 | 1.31mi |
| 15403 E 43rd Ter S Independence, MO | 3.0 | 2.0 | 1689 | $2,046 | $1.21 | 2d | 1 | 1.35mi |
Listing history 10 events
-
2026-06-18days on market $124,900 Active 13 DOM
-
2026-06-17days on market $124,900 Active 12 DOM
-
2026-06-16days on market $124,900 Active 11 DOM
-
2026-06-15days on market $124,900 Active 10 DOM
-
2026-06-13days on market $124,900 Active 8 DOM
-
2026-06-09days on market $124,900 Active 5 DOM
-
2026-06-08days on market $124,900 Active 4 DOM
-
2026-06-07days on market $124,900 Active 3 DOM
-
2026-06-05remarks 47-char remark
-
2026-06-05$124,900 Active 1 DOM
ⓘ Source: listings_history table (triggers on properties + properties_extension) + one-shot
backfill from property_details.listing_events for pre-trigger history.
Climate risk First Street
- Flood 1/10 Low FEMA zone X (unshaded) · 0% chance over 30 yrs
- Wildfire 1/10 Low
- Heat 4/10 Moderate 7 d/yr ≥108°F today · 17 d/yr by 30 yrs out
- Wind 2/10 Low
- Air quality 3/10 Moderate 3 unhealthy d/yr today · 3 by 30 yrs out
Nearby sold comps map
Loading sold comps map…
Walkable amenities ~0.75 mi
Loading nearby amenities…
Taxation est. · year 1
- Rental income
- $21,288
- − Mortgage interest
- −$6,996
- − Property taxes
- −$1,874
- − Insurance
- −$624
- − Repairs & maintenance
- −$1,703
- − Management
- −$1,703
- − Depreciation
- −$3,633
- Taxable income
- $4,754
- Est. tax owed @ 24.0%
- −$1,141
- After-tax cash flow
- $5,319/yr
For passive investors: Depreciation is non-cash, so a rental often shows a tax loss while cash-flowing — sheltering income. Rental losses are passive: they offset passive income freely, and up to $25,000/yr can offset ordinary (W-2) income if you actively participate and your MAGI is under $100k (phasing out to $0 by $150k); unused losses carry forward. On sale, claimed depreciation is recaptured at up to 25%, and gains may owe capital-gains tax (a 1031 exchange can defer both). Figures are a year-1 estimate at your 24.0% rate — not tax advice; consult a CPA.
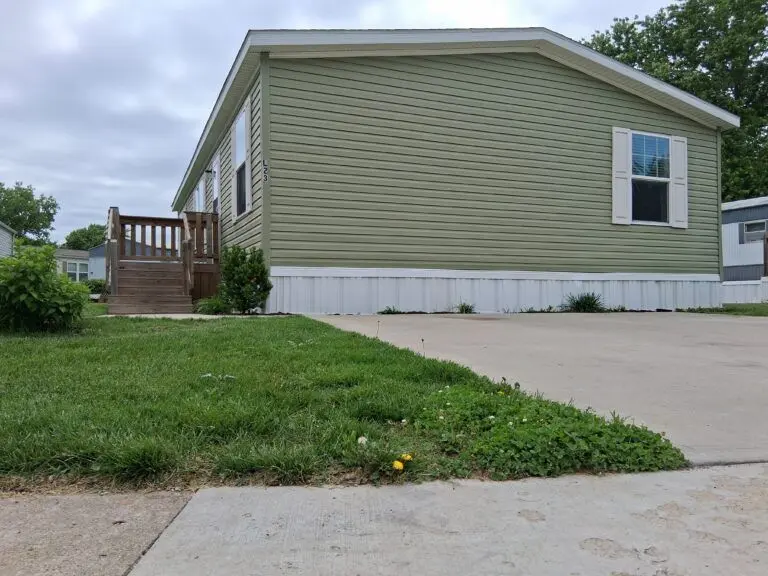
Condition & rehab AI · 4 photos
A manufactured home with average exterior condition, requiring minor repairs and maintenance. Fresh paint and landscaping would significantly enhance its curb appeal and value.
Repairs flagged
- Minor Driveway — Cracks visible in concrete driveway
- Minor Landscaping — Weeds and grass patches in yard
Value-add opportunities
- Both Paint exterior — Fresh paint enhances curb appeal and value
- Both Landscaping — Well-maintained landscaping improves curb appeal and rental value
Renovation cost estimate screening
| Repair item | Severity | Est. cost |
|---|---|---|
| Driveway · Cracks visible in concrete driveway | Minor | $500–3,000 |
| Landscaping · Weeds and grass patches in yard | Minor | $500–3,000 |
| Total estimated repair cost · 2 items | $1,000–6,000 |
Value-add ROI direction
- Both Paint exterior — Fresh paint enhances curb appeal and value ↑
- Both Landscaping — Well-maintained landscaping improves curb appeal and rental value ↑
ⓘ Cost ranges are severity-bucket heuristics (US national rule-of-thumb). Get contractor quotes + a written scope before underwriting a rehab budget.
Schools (NCES district)
- District
- Independence 30
- NCES district ID
- 2915480
- Math proficiency
- 26% ▼ -8.00%
- Reading proficiency
- 38% ▼ -5.00%
- Median HH income
- $41,843
- Composite
- 27.04/100
- National rank
- #7054
- State rank
- #252 of 324 in MO
Livability — Independence
- Score
- 82/100
- State rank
- #10
- US rank
- #1296
Category grades
Schools grade is shown separately in the Schools card above.
Census & demographics
- Census place
- Independence, MO
- County
- Jackson County · 687,798 people
- City population
- 117,675
- Metro
- Kansas City, MO-KS
- Population (ZIP)
- 35,960
- Household income
- $62,439
- Rent vs Own
- Severe rent burden
- 1404.0
Population outlook (Jackson County) Hauer SSP2
- Today (2025)
- 719,589 people
- By 2030
- 731,456 · +1.6%
- By 2040
- 746,689 · +3.8%
- By 2050
- 749,289 · +4.1%
- By 2075
- 736,227 · +2.3%
- By 2100
- 668,210 · -7.1%
Race, ethnicity, and origin ACS 2023
- Neighborhood character
- Predominantly White (71%)
- Race & ethnicity
- White 71% Black 13% Hispanic / Latino 10% Two or more races 8% Asian 1%
- Hispanic origin (detail)
- Mexican 7% Puerto Rican 2%
- Common ancestry
- Italian 9% Lithuanian 2% Slovak 2%
- Foreign-born
- 4% · Canada
- Languages at home
- 94% English-only · Spanish 4%
Political lean MEDSL · Jackson
- 2024 margin
- D (+19.3) · D 58.9% · R 39.5% · Other 1.6%
- 2008→2024 swing
- -6.1pp toward R · 2008: 25.4pp · 2024: 19.3pp
- All cycles
- 2024: D+19.3 2020: D+22.0 2016: D+16.6 2012: D+19.0 2008: D+25.4
Not yet ingested
- Civics
- —
Market trends
- HPI YoY
- ▼ -180.54%
- Current HPI
- 245.3636
- Rent YoY
- ▲ 5.09%
- Metro
- Kansas City, MO-KS
- State GDP YoY
- ▲ 1.84%
- F500 in state
- 20
Industry mix (Fortune 500 HQ in MO)
| Industry | F500 HQs | Revenue |
|---|---|---|
| Healthcare | 1 | $163B |
|
||
| Insurance | 1 | $21B |
|
||
| Industrial Technology | 1 | $17B |
|
||
| Retail | 1 | $16B |
|
||
| Industrial Distribution | 1 | $10B |
|
||
| Utilities | 1 | $9B |
|
||
Cash-flow waterfall
monthlySold comps — $/sqft
last 12 mo · ≤1 miLoading sold comps…