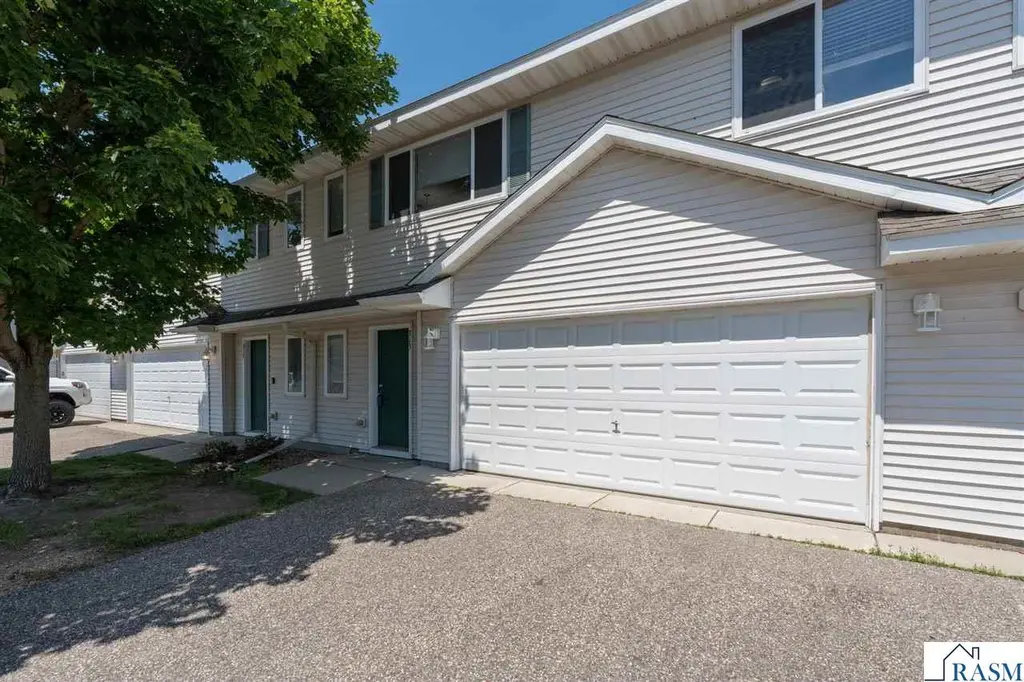
313 Tanager Path · Mankato, MN
Flood risk 1/10 · Minimal
- FEMA flood zone
- X
- Chance of flooding over 30 yrs
- 0.0%
- Est. flood insurance / yr
- $507 – $1,088
Fire risk 3/10 · Minor
- Est. fire insurance / yr
- $888 – $1,650
Heat risk 2/10 · Minimal
- Hot days now (above 99°F)
- 7 days/yr
- Hot days in 30 yrs
- 15 days/yr
Wind risk 2/10 · Minimal
- Chance of severe wind over 30 yrs
- —
Air-quality risk 1/10 · Minimal
- Unhealthy air days now
- 0 days/yr
- Unhealthy air days in 30 yrs
- 0 days/yr
Risk factors via First Street. Map © Google.
Why this score? — see what drove the D grade
The composite is a weighted blend of 9 inputs, each scored 0–100. Each bar is that input's sub-score; the figure is the points it added to the 100-point composite (weight × sub-score).
- Cash flow +11.5/30.0
- ARV discount +7.5/15.0
- Rent growth +4.6/5.0
- Schools +4.4/10.0
- Livability +3.9/5.0
- 1% rule +3.6/10.0
- DSCR +3.4/10.0
- Condition / age +2.5/5.0
- Appreciation +0.0/10.0
$200,000
🖨 Deal sheet (PDF) 📄 Offer letter ✓ Due diligence
Listing remarks MLS
Enjoy maintenance free living in this well cared for 3 bedroom, 2 bath, 2 stall tuck-under garage townhome located in the popular Wings Over White Oaks Association on Mankato's Hilltop, close to MNSU and easy access to many local amenities nearby. Association Fee of $103/month covers exterior maintenance, snow removal, lawn care AND building insurance, so keeping costs down continues to be an advantage here when it comes to only needing to worry about carrying a "studs in" home owners policy. Newer water heater and flooring (2018), stainless appliances, turn key ready!
Key facts
- New carpet
- Large pantry
- 1,307 sq ft lot
Tags
Property features AI
Finance
- HOA & community: Homeowners association with a $155 monthly fee
Exterior
- Parking: Attached 2-car garage; Garage door opener; Asphalt driveway
- Security: Smoke detector(s)
- Utilities: Public water; Public sewer; Underground utilities
- Home design: Single-family residence (townhome); Residential property
- Construction: Vinyl siding construction
- Exterior features: Asphalt roof; Vinyl siding; Private maintained road; 1400 SF lot (0.03 acre)
Interior
- Kitchen: Dishwasher; Disposal; Microwave; Cooktop; Range; Refrigerator
- Bathrooms: 1 full bathroom; 1 three-quarter bathroom
- Heating & cooling: Central air; Ceiling fan(s); Natural gas forced air heating
- Interior features: Eat-in kitchen; Window coverings; Smoke detector(s)
- Laundry & utility: Washer; Dryer; Gas water heater; Water softener
Neighborhood map
What this means for you Summary
Snapshot
- This is a 3-bed/1.0-bath townhouse listed at $200k.
Deal economics
- At list price, monthly cash flow is $-65 ($-776/yr) — negative.
- To cash-flow at today's rent, offer at most $189k (5.7% below list).
- To meet the 1% rule (rent ≥ 1% of price), the offer needs to be $172k (13.9% below list).
- Recommended offer: $172k (13.9% below list) — sets the bar for 1% rule.
- Cap rate 5.9% vs local median 3.5% in Mankato — top-decile yield for the area; either an underpriced asset or a hidden risk that comps aren't pricing in. Stress-test before assuming the spread holds.
Location & tenants
- Location reads 77/100 on livability (#133 in MN, #2,970 nationally) — a middle-class / working-renter tenant base. Strengths: housing A+, health & safety A+, cost of living A; Watch: crime C-, amenities C-, commute F.
- Mankato Public School District (urban): math 48% / reading 56% proficiency, ranked #98 of 301 in MN (top 33%) — acceptable for families but not a draw, mixed tenant base, ~2y average lease.
- Zoned schools: Rosa Parks Elementary (math 54% / reading 46%, grade D+, #417 of 857 statewide, top 49%, 434 students, 63% FRL); Prairie Winds Middle School (math 40% / reading 51%, grade D+, #106 of 258 statewide, top 43%, 954 students, 47% FRL); Mankato East Senior High (math 32% / reading 62%, grade D-, #166 of 471 statewide, top 39%, 1,293 students, 42% FRL) — zoned schools average 51% FRL vs 29% district-wide (22 pts higher); higher-poverty schools than district average — tighter screening recommended.
- Market conditions: Rents rising fast (+8.6%/yr); 359 active listings in the ZIP; 7 comparable units currently listed for rent nearby; rentals lingering (median 46d on market — plan ~5-8 weeks vacancy on turnover, expect pricing pressure); 100% of comp listings sitting > 30 days — soft ceiling on asking rent; 269 units permitted in Blue Earth County in 2024 (154 in 5+ unit buildings).
Forward outlook
- Local home prices are declining (-3.0%/yr); year-one equity from $1k of loan paydown is wiped out by about $6k of value loss. Plan a longer hold.
- Blue Earth County population projected at +18% by 2050 — long-run rental-demand tailwind backs the buy-and-hold thesis.
Negotiation context
- It's been on market 15 days — a 2% lower offer ($197k) is reasonable based on typical stale-listing flexibility.
- 6 sale attempts since 9y ago with the ask held roughly flat each time — persistent listings suggest the price (not the market) is what's stuck; bring a comps-based counter.
Questions for the listing agent
- What do current leases actually rent for vs. the listed asking? Can we see a recent rent roll and the last 12 months of T-12 income?
- What does the HOA fee cover, when was the last increase, and are there any pending special assessments or reserve-fund shortfalls?
- Is there a deadline driving the sale (1031 exchange, divorce, estate, relocation)? That informs how much negotiation room exists.
- Schools are B-rated — typically a magnet for longer-tenancy family renters. What's the average tenant stay here, and is there a school-zone premium baked into asking?
- The area grade is low — what's the realistic commute time and amenity access for the typical tenant pool here? Any planned neighborhood developments (good or bad) we should know about?
- What's the average days-on-market for RENTAL listings here right now (not sales)? A rising rental-DOM trend means longer vacancies and softer asking-rent achievability than the comps imply.
- What's the recent tenant-quality profile in this submarket — average credit score on applications, eviction rate, late-payment / NSF rate, and stable-employment percentage? A property-management company in the area should have these aggregated.
- How much new for-sale + rental construction is in the pipeline within 1–3 miles? Heavy new supply typically softens prices + rents 12–24 months out; constrained supply supports both.
Investment metrics
- 1% rule
- 0.86% ✗
- Cap rate
- 5.90%
- Cash-on-cash
- -1.39%
- DSCR
- 0.94
- GRM
- 9.7
CMA / ARV
No comps found within radius.
Projected returns pro-forma
-3.0% appreciation · 8.0% rent growth · sell at horizon
- IRR
- -12.9%
- Equity multiple
- 0.51×
- Total profit
- $-27,375
- Equity at exit
- $29,821
- IRR
- 2.5%
- Equity multiple
- 1.22×
- Total profit
- $12,490
- Equity at exit
- $17,292
Cash invested: $56,000 (down + closing). Projections, not guarantees.
Landlord ↔ Tenant lean methodology
- Overall (STATE)
- 46 Balanced
- State Minnesota
- 46 Balanced · D+2
- County
- — inherits STATE
- City
- — inherits STATE
ZIP-level market 56001
- Rents YoY
- 8.6%
- Active inventory
- 359
- Price-to-rent
- 9.7×
Monthly cashflow live
- Estimated rent
- $1,722 high interval (Pro) →
- Mortgage (P&I)
- −$1,049
- Tax from tax record
- −$138 /mo · $1,654/yr
- Insurance
- −$83
- HOA
- −$155
- Vacancy / Maint / Mgmt
- −$362
- Net cashflow
- $-65
Break-even live
Sensitivity live
| Price | -10% $49 | -5% $-8 | +0% $-65 | +5% $-121 | +10% $-178 |
|---|---|---|---|---|---|
| Rent | -10% $-201 | -5% $-133 | +0% $-65 | +5% $3 | +10% $71 |
| Rate | -1.0pp $36 | -0.5pp $-14 | base $-65 | +0.5pp $-116 | +1.0pp $-169 |
UW: 25.0% down · 7.5% · 30yr · 1.5% tax · 5.0% vac · 8.0% maint · 8.0% mgmt
Financing live
Cash to close
- Down payment
- $50,000
- Closing costs
- $6,000
- Reserves months
- —
- Total cash needed
- —
Loan-product check · same deal, 3 products live
Conventional
25% down · 7.5% · 30yr
- Down + closing
- —
- Monthly P&I
- —
- Monthly cashflow
- —
- DSCR
- —
- Eligible?
- —
Personal DTI + credit; lowest rate.
DSCR
20% down · 8.5% · 30yr
- Down + closing
- —
- Monthly P&I
- —
- Monthly cashflow
- —
- DSCR
- —
- Eligible?
- —
No personal income docs; deal must DSCR.
Hard money
10% down · 12.0% · 12mo
- Down + closing
- —
- Monthly P&I
- —
- Monthly cashflow
- —
- DSCR
- —
- Eligible?
- —
Short-term bridge; refi at stabilization.
Rent comps 7 comps
| Address | Beds | Baths | Sqft | Rent | $/sqft | DOM | Units | Dist |
|---|---|---|---|---|---|---|---|---|
| 103 Everglades Trl Mankato, MN | 2.0–4.0 | 2.5 | 1453 | $1,860 | $1.28 | 45d | 3 | 0.25mi |
| 109 Willow Cascades Trl Unit 109 WCT Mankato, MN | 3.0 | 2.5 | 1500 | $1,850 | $1.23 | 45d | 1 | 0.28mi |
| 701 S Victory Dr Unit 8 Mankato, MN | 2.0 | 1.0 | 925 | $1,349 | $1.46 | 45d | 1 | 0.51mi |
| 50 Hilltop Ln Mankato, MN | 1.0–2.0 | 1.0 | 760 | $1,010 | $1.33 | 45d | 11 | 0.87mi |
| 875 Heron Dr Mankato, MN | 2.0 | 1.0 | 919 | $1,098 | $1.19 | 45d | 1 | 0.91mi |
| 200 Briargate Rd Mankato, MN | 1.0–3.0 | 1.0–3.0 | 912 | $1,799 | $1.97 | 45d | 32 | 1.12mi |
| 140 Homestead Rd Mankato, MN | 1.0–3.0 | 1.0 | 843 | $1,313 | $1.56 | 45d | 8 | 1.12mi |
HOA detail
- Monthly dues
- $155 · $1,860/yr
- Likely covers
- waterlandscapingsnow removalexterior maint.insurance
Listing history 13 events
-
2026-06-18status $200,000 Pending 15 DOM
-
2026-06-17days on market $200,000 Active Under Contract 15 DOM
-
2026-06-16days on market $200,000 Active Under Contract 14 DOM
-
2026-06-15days on market $200,000 Active Under Contract 13 DOM
-
2026-06-14days on market $200,000 Active Under Contract 11 DOM
-
2026-06-13statusdays on market $200,000 Active Under Contract 10 DOM
-
2026-06-10days on market $200,000 Active 8 DOM
-
2026-06-09days on market $200,000 Active 7 DOM
-
2026-06-08days on market $200,000 Active 6 DOM
-
2026-06-07days on market $200,000 Active 5 DOM
-
2026-06-05days on market $200,000 Active 2 DOM
-
2026-06-03remarks 699-char remark
-
2026-06-03$200,000 Active 1 DOM
ⓘ Source: listings_history table (triggers on properties + properties_extension) + one-shot
backfill from property_details.listing_events for pre-trigger history.
Tax reassessment forecast MN · Partial reset (capped growth)
- Current annual tax
- $1,654 · $138/mo
- Projected year-2 tax
- $1,947 · $162/mo
- Expected delta
- +$293/yr (+$24/mo · 17.7%)
ⓘ Screening estimate from a state-policy table — verify with the county assessor before closing.
Climate risk First Street
- Flood 1/10 Low FEMA zone X · 0% chance over 30 yrs
- Wildfire 3/10 Moderate
- Heat 2/10 Low 7 d/yr ≥99°F today · 15 d/yr by 30 yrs out
- Wind 2/10 Low
- Air quality 1/10 Low 0 unhealthy d/yr today · 0 by 30 yrs out
Nearby sold comps map
Loading sold comps map…
Walkable amenities ~0.75 mi
Loading nearby amenities…
Taxation est. · year 1
- Rental income
- $20,663
- − Mortgage interest
- −$11,203
- − Property taxes
- −$1,654
- − Insurance
- −$1,000
- − Repairs & maintenance
- −$1,653
- − Management
- −$1,653
- − HOA
- −$1,860
- − Depreciation
- −$5,818
- Taxable loss
- −$4,178
- Est. tax savings @ 24.0%
- +$1,003
- After-tax cash flow
- $227/yr
For passive investors: Depreciation is non-cash, so a rental often shows a tax loss while cash-flowing — sheltering income. Rental losses are passive: they offset passive income freely, and up to $25,000/yr can offset ordinary (W-2) income if you actively participate and your MAGI is under $100k (phasing out to $0 by $150k); unused losses carry forward. On sale, claimed depreciation is recaptured at up to 25%, and gains may owe capital-gains tax (a 1031 exchange can defer both). Figures are a year-1 estimate at your 24.0% rate — not tax advice; consult a CPA.
Schools (NCES district)
- District
- Mankato Public School District
- NCES district ID
- 2718780
- Math proficiency
- 48% ▼ -11.00%
- Reading proficiency
- 56% ▼ -8.00%
- Median HH income
- $49,469
- Composite
- 44.36/100
- National rank
- #2819
- State rank
- #98 of 301 in MN
Livability — Mankato
- Score
- 77/100
- State rank
- #133
- US rank
- #2970
Category grades
Schools grade is shown separately in the Schools card above.
Census & demographics
- Census place
- Mankato, MN
- County
- Blue Earth County · 51,585 people
- City population
- 51,585
- Metro
- Mankato, MN
- Population (ZIP)
- 51,585
- Household income
- $69,531
- Rent vs Own
- Severe rent burden
- 2394.0
Population outlook (Blue Earth County) Hauer SSP2
- Today (2025)
- 70,208 people
- By 2030
- 72,708 · +3.6%
- By 2040
- 77,481 · +10.4%
- By 2050
- 82,842 · +18.0%
- By 2075
- 99,990 · +42.4%
- By 2100
- 116,795 · +66.4%
Race, ethnicity, and origin ACS 2023
- Neighborhood character
- Predominantly White (83%)
- Race & ethnicity
- White 83% Black 6% Hispanic / Latino 5% Two or more races 4% Asian 3%
- Common ancestry
- Portuguese 11% Lithuanian 3% Romanian 3%
- Foreign-born
- 8% · Canada, Vietnam, South Korea
- Languages at home
- 90% English-only · Spanish 3% Other Indo-European 1% Vietnamese 1%
Political lean MEDSL · Blue Earth
- 2024 margin
- Toss-up / Even · D 48.3% · R 49.5% · Other 2.1%
- 2008→2024 swing
- -14.2pp toward R · 2008: 12.9pp · 2024: -1.2pp
- All cycles
- 2024: R+1.2 2020: D+4.4 2016: R+3.7 2012: D+9.5 2008: D+12.9
Not yet ingested
- Civics
- —
Market trends
- HPI YoY
- ▼ -192.46%
- Current HPI
- 189.8485
- Rent YoY
- ▲ 8.55%
- Metro
- Mankato, MN
- State GDP YoY
- ▲ 2.41%
- F500 in state
- 34
Industry mix (Fortune 500 HQ in MN)
| Industry | F500 HQs | Revenue |
|---|---|---|
| Healthcare | 2 | $407B |
|
||
| Retail | 2 | $150B |
|
||
| Consumer Goods | 2 | $32B |
|
||
| Industrial Machinery | 2 | $6B |
|
||
| Agriculture | 1 | $40B |
|
||
| Healthcare / Medical Devices | 1 | $32B |
|
||
Price history
+60.1% since first listed16 events — show timeline
- 2026-06-01 Listed $200,000 RASM
- 2022-06-16 Sold (Public Records) $180,000 Public Records
- 2022-06-10 Sold (MLS) $180,000 RASM
- 2022-04-22 Listed $180,000 RASM
- 2020-04-23 Sold (Public Records) $145,000 Public Records
- 2020-04-17 Sold (MLS) $145,000 RASM
- 2020-04-17 Sold (MLS) $145,000 NORTHSTARMLS as Distributed by MLS Grid
- 2020-03-16 Pending — NORTHSTARMLS as Distributed by MLS Grid
- 2020-03-13 Listed $144,900 RASM
- 2020-03-12 Listed $144,900 NORTHSTARMLS as Distributed by MLS Grid
- 2017-07-26 Sold (Public Records) $125,000 Public Records
- 2017-07-21 Sold (MLS) $125,000 RASM
- 2017-07-21 Sold (MLS) $125,000 NORTHSTARMLS as Distributed by MLS Grid
- 2017-06-12 Pending — NORTHSTARMLS as Distributed by MLS Grid
- 2017-06-09 Listed $124,900 NORTHSTARMLS as Distributed by MLS Grid
- 2017-06-08 Listed $124,900 RASM
Property tax history
+3.9%/yrLatest (2025): $1,654 · -4.8% YoY. Source: county tax records.
Cash-flow waterfall
monthlySold comps — $/sqft
last 12 mo · ≤1 miLoading sold comps…