 13-Plex
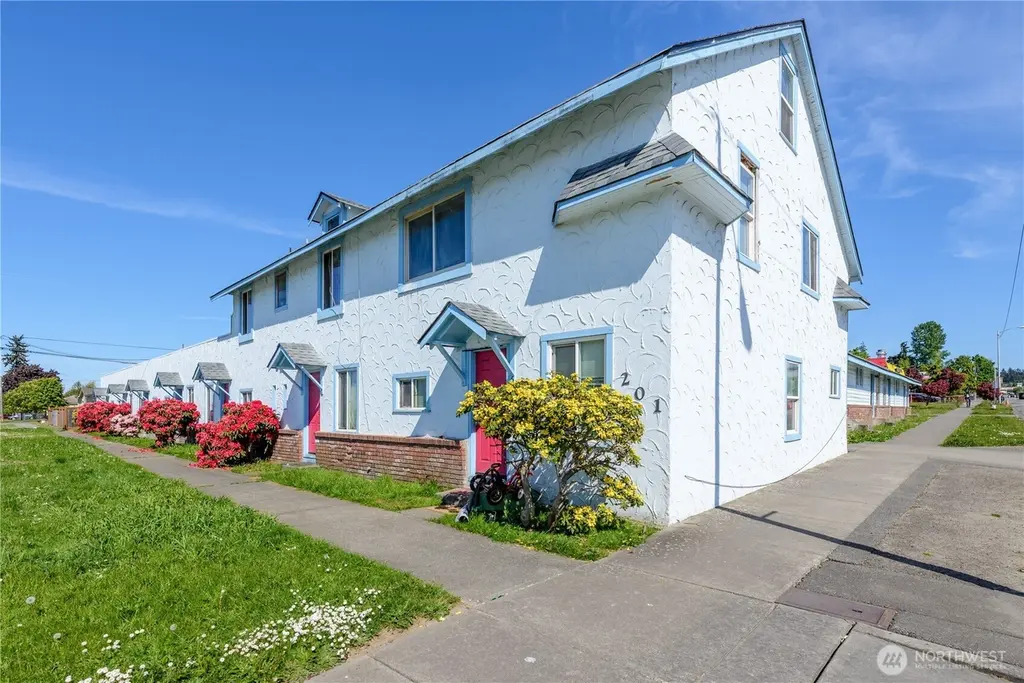
201 E Liberty St · Port Angeles, WA
Flood risk No data
- FEMA flood zone
- —
- Chance of flooding over 30 yrs
- —
- Est. flood insurance / yr
- —
Fire risk No data
- Est. fire insurance / yr
- —
Heat risk No data
- Hot days now (above threshold)
- —
- Hot days in 30 yrs
- —
Wind risk No data
- Chance of severe wind over 30 yrs
- —
Air-quality risk No data
- Unhealthy air days now
- —
- Unhealthy air days in 30 yrs
- —
Risk factors via First Street. Map © Google.
Why this score? — see what drove the B grade
The composite is a weighted blend of 9 inputs, each scored 0–100. Each bar is that input's sub-score; the figure is the points it added to the 100-point composite (weight × sub-score).
- Cash flow +30.0/30.0
- DSCR +10.0/10.0
- 1% rule +9.1/10.0
- ARV discount +7.5/15.0
- Schools +5.2/10.0
- Livability +3.9/5.0
- Rent growth +2.5/5.0
- Condition / age +2.5/5.0
- Appreciation +0.0/10.0
$995,000
🖨 Deal sheet 📄 Offer letter ✓ Due diligence
Multi-family units
County records classify this as Multi-Family (5+ Unit). Listing-text estimate: 13 units. confirmed
5+ unit building — per-unit beds/baths from public records are typically unavailable; the breakdown below (if shown) is an estimate from the listing text.
Listing remarks
13 unit apartment complex is centrally located in Port Angeles and ready for a new owner! Ideally located on the corner of Liberty and Front St provides convenient access to all the amenities Port Angeles has to offer making it an attractive housing option within the Olympic Peninsula rental market. Seven 1 bedroom units, five 2 bedroom units, and one 4 bedroom unit. All units have 1 bathroom. Eight of the units have been recently upgraded/updated in the last 3 years. Coin Op laundry room on-site is managed by an outside company. 4 car garage has new roof in 2022 and is used for storage only at this time. Large courtyard in the middle of the buildings. Tons of untapped potential.
Key facts
- Centrally located
- Convenient access
- Recently upgraded
Tags
Property features AI
Finance
- Other: Possible commercial use noted; Zoned by the city
- Financial info: Property listed for cash or conventional terms; Multi-family financial snapshot available (income and expenses listed separately)
Exterior
- Parking: Four covered parking spaces; Four garage spaces; Fifteen uncovered parking spaces; RV parking
- Utilities: Electric service; City water (City of PA); City sewer (Sewer connected, City of PA); Water/sewer/garbage line item noted
- Home design: Residential income property (multi-family); Two stories
- Construction: Stucco and wood construction; Composition roof; Poured concrete foundation; Effective year built 2020
- Exterior features: Stucco and wood exterior; Corner lot with curbs, paved surfaces and sidewalks; RV parking available
Interior
- Kitchen: Range/oven included in units; Refrigerator included in units; Most units do not include a dishwasher
- Bedrooms: Mix of 1-, 2- and 4-bedroom units across the building
- Bathrooms: Each unit has one bathroom
- Heating & cooling: Baseboard heating; No central cooling
- Interior features: Basement; Coin-op laundry; Storage
- Laundry & utility: Coin-op laundry (shared); Individual units do not include washer/dryer
Neighborhood map
What this means for you Summary
Snapshot
- This is a 7×1bd/1ba + 5×2bd/1ba + 1×4bd/1ba units multifamily listed at $995k.
Deal economics
- At list price, monthly cash flow is $5k ($59k/yr) — positive. Per door: $377/mo.
- The deal already cash-flows at list — no discount required.
- Meets the 1% rule at list price ($14k rent vs $995k).
- Cap rate 12.2% vs local median 2.8% in Port Angeles — top-decile yield for the area; either an underpriced asset or a hidden risk that comps aren't pricing in. Stress-test before assuming the spread holds.
Location & tenants
- Location reads 78/100 on livability (#138 in WA, #2,729 nationally) — a middle-class / working-renter tenant base. Strengths: amenities A+, commute A+, health & safety A+; Watch: employment C-, crime F.
- Port Angeles School District (town): math 55% / reading 65% proficiency, ranked #70 of 291 in WA (top 24%) — acceptable for families but not a draw, mixed tenant base, ~2y average lease.
- Market conditions: 268 active listings in the ZIP; 166 units permitted in Clallam County in 2024 (0 in 5+ unit buildings).
Forward outlook
- Local home prices are declining (-3.0%/yr); year-one equity from $7k of loan paydown is wiped out by about $30k of value loss. Plan a longer hold.
- Clallam County population projected at +5% by 2050 — modest demand growth; plan on rents tracking national, not racing it.
- At projected returns (-3.0% appreciation + 3.0% rent growth), your $279k cash investment doubles in ~6 years — after that, you're playing with house money.
Negotiation context
- Only 5 days on market — expect competitive offers; lowballing is unlikely to land.
- 3 sale attempts since 3y ago with the ask held roughly flat each time — persistent listings suggest the price (not the market) is what's stuck; bring a comps-based counter.
Risks & watch-outs
- Watch-outs: built in 1952 — expect roof / HVAC / electrical / plumbing capex.
Questions for the listing agent
- Can we see the unit-by-unit rent roll, current vacancy, and any below-market leases? What's the average tenancy length?
- What capital expenditures (roof, boiler, parking lot, exteriors) have been made in the last 5 years, and what's planned in the next 2?
- Built in 1952 — when were the roof, HVAC, electrical panel, plumbing, and water heater last replaced?
- Is there a deadline driving the sale (1031 exchange, divorce, estate, relocation)? That informs how much negotiation room exists.
- Schools are B-rated — typically a magnet for longer-tenancy family renters. What's the average tenant stay here, and is there a school-zone premium baked into asking?
- Crime grade is F in this area — have there been break-ins, vandalism, or insurance claims at this property in the last 3 years? What carrier currently insures it and at what premium?
- What's the average days-on-market for RENTAL listings here right now (not sales)? A rising rental-DOM trend means longer vacancies and softer asking-rent achievability than the comps imply.
- What's the recent tenant-quality profile in this submarket — average credit score on applications, eviction rate, late-payment / NSF rate, and stable-employment percentage? A property-management company in the area should have these aggregated.
- How much new apartment / multifamily construction is in the pipeline within 1–3 miles? Heavy new supply (>2% of stock underway) typically softens rents 12–24 months out; light construction supports rent growth.
Investment metrics
- 1% rule
- 1.41% ✓
- Cap rate
- 12.20%
- Cash-on-cash
- 21.09%
- DSCR
- 1.94
- GRM
- 5.9
CMA / ARV
No comps found within radius.
Projected returns pro-forma
-3.0% appreciation · 3.0% rent growth · sell at horizon
- IRR
- 13.5%
- Equity multiple
- 1.54×
- Total profit
- $150,474
- Equity at exit
- $148,358
- IRR
- 22.4%
- Equity multiple
- 2.91×
- Total profit
- $531,864
- Equity at exit
- $86,029
Cash invested: $278,600 (down + closing). Projections, not guarantees.
Landlord ↔ Tenant lean methodology
- Overall (STATE)
- 28 Tenant-Leaning
- State Washington
- 28 Tenant-Leaning · D+8
- County
- — inherits STATE
- City
- — inherits STATE
ZIP-level market 98362
- Active inventory
- 268
- Price-to-rent
- 80.8×
Monthly cashflow live
- Estimated rent
- $14,066 medium interval (Pro) →
- Mortgage (P&I)
- −$5,218
- Tax from tax record
- −$583 /mo · $6,990/yr
- Insurance
- −$415
- HOA
- −$0
- Vacancy / Maint / Mgmt
- −$2,954
- Net cashflow
- $4,897
Break-even live
13-unit breakdown (identical units grouped — click to expand)
| Units | Beds | Baths | Est. rent |
|---|---|---|---|
| 7× units | 1 | 1 | $7,182 |
| #1 | 1 | 1 | $1,026 |
| #2 | 1 | 1 | $1,026 |
| #3 | 1 | 1 | $1,026 |
| #4 | 1 | 1 | $1,026 |
| #5 | 1 | 1 | $1,026 |
| #6 | 1 | 1 | $1,026 |
| #7 | 1 | 1 | $1,026 |
| 5× units | 2 | 1 | $5,610 |
| #8 | 2 | 1 | $1,122 |
| #9 | 2 | 1 | $1,122 |
| #10 | 2 | 1 | $1,122 |
| #11 | 2 | 1 | $1,122 |
| #12 | 2 | 1 | $1,122 |
| 1× unit | 4 | 1 | $1,278 |
| Total (13 units) | $14,066 | ||
UW: 25.0% down · 7.5% · 30yr · 1.5% tax · 5.0% vac · 8.0% maint · 8.0% mgmt
Financing live
Cash to close
- Down payment
- $248,750
- Closing costs
- $29,850
- Reserves months
- —
- Total cash needed
- —
Loan-product check · same deal, 3 products live
Conventional
25% down · 7.5% · 30yr
- Down + closing
- —
- Monthly P&I
- —
- Monthly cashflow
- —
- DSCR
- —
- Eligible?
- —
Personal DTI + credit; lowest rate.
DSCR
20% down · 8.5% · 30yr
- Down + closing
- —
- Monthly P&I
- —
- Monthly cashflow
- —
- DSCR
- —
- Eligible?
- —
No personal income docs; deal must DSCR.
Hard money
10% down · 12.0% · 12mo
- Down + closing
- —
- Monthly P&I
- —
- Monthly cashflow
- —
- DSCR
- —
- Eligible?
- —
Short-term bridge; refi at stabilization.
Listing history 6 events
-
2026-05-22status Pending
-
2026-05-17$995,000 Active
-
2024-03-14historical $1,200
-
2024-01-26$1,200
-
2023-10-20historical $1,000
-
2023-10-08$1,000
ⓘ Source: listings_history table (triggers on properties + properties_extension) + one-shot
backfill from property_details.listing_events for pre-trigger history.
Tax reassessment forecast WA · Resets to sale price
- Current annual tax
- $6,990 · $583/mo
- Projected year-2 tax
- $9,751 · $813/mo
- Expected delta
- +$2,761/yr (+$230/mo · 39.5%)
ⓘ Screening estimate from a state-policy table — verify with the county assessor before closing.
Nearby sold comps map
Loading sold comps map…
Walkable amenities ~0.75 mi
Loading nearby amenities…
Taxation est. · year 1
- Rental income
- $168,792
- − Mortgage interest
- −$55,735
- − Property taxes
- −$6,990
- − Insurance
- −$4,975
- − Repairs & maintenance
- −$13,503
- − Management
- −$13,503
- − Depreciation
- −$28,945
- Taxable income
- $45,139
- Est. tax owed @ 24.0%
- −$10,833
- After-tax cash flow
- $47,932/yr
For passive investors: Depreciation is non-cash, so a rental often shows a tax loss while cash-flowing — sheltering income. Rental losses are passive: they offset passive income freely, and up to $25,000/yr can offset ordinary (W-2) income if you actively participate and your MAGI is under $100k (phasing out to $0 by $150k); unused losses carry forward. On sale, claimed depreciation is recaptured at up to 25%, and gains may owe capital-gains tax (a 1031 exchange can defer both). Figures are a year-1 estimate at your 24.0% rate — not tax advice; consult a CPA.
Schools (NCES district)
- District
- Port Angeles School District
- NCES district ID
- 5306820
- Math proficiency
- 55% ▬ 0.00%
- Reading proficiency
- 65% ▲ 1.00%
- Median HH income
- $46,594
- Composite
- 52.34/100
- National rank
- #3432
- State rank
- #70 of 291 in WA
Livability — Port Angeles
- Score
- 78/100
- State rank
- #138
- US rank
- #2729
Category grades
Schools grade is shown separately in the Schools card above.
Census & demographics
- Census place
- Port Angeles, WA
- Population (ZIP)
- 23,907
Population outlook (Clallam County) Hauer SSP2
- Today (2025)
- 76,817 people
- By 2030
- 78,177 · +1.8%
- By 2040
- 79,795 · +3.9%
- By 2050
- 80,890 · +5.3%
- By 2075
- 83,933 · +9.3%
- By 2100
- 82,141 · +6.9%
Race, ethnicity, and origin ACS 2023
- Neighborhood character
- Predominantly White (84%)
- Race & ethnicity
- White 84% Two or more races 8% Hispanic / Latino 7% Native American 1% Asian 1%
- Hispanic origin (detail)
- Mexican 4%
- Common ancestry
- Italian 6% Portuguese 6% Lithuanian 4%
- Foreign-born
- 4% · Canada
- Languages at home
- 95% English-only · Spanish 3% German/W. Germanic 1%
Political lean MEDSL · Clallam
- 2024 margin
- Lean D (+7.9) · D 52.6% · R 44.7% · Other 2.7%
- 2008→2024 swing
- +4.6pp toward D · 2008: 3.3pp · 2024: 7.9pp
- All cycles
- 2024: D+7.9 2020: D+3.4 2016: R+1.6 2012: D+0.4 2008: D+3.3
Not yet ingested
- Civics
- —
Market trends
- HPI YoY
- ▼ -340.90%
- Current HPI
- 189.7112
- Rent YoY
- —
- Metro
- —
- State GDP YoY
- ▲ 4.65%
- F500 in state
- 22
Industry mix (Fortune 500 HQ in WA)
| Industry | F500 HQs | Revenue |
|---|---|---|
| Retail | 2 | $269B |
|
||
| Technology / Retail | 1 | $638B |
|
||
| Technology | 1 | $245B |
|
||
| Telecommunications | 1 | $38B |
|
||
| Food / Beverage | 1 | $36B |
|
||
| Automotive / Trucks | 1 | $34B |
|
||
Price history
+99400.0% since first listed6 events — show timeline
- 2026-05-22 Pending — NWMLS as Distributed by MLS Grid
- 2026-05-17 Listed $995,000 NWMLS as Distributed by MLS Grid
- 2024-03-14 Rental Removed $1,200 APPFOLIO
- 2024-01-26 Listed for Rent $1,200 APPFOLIO
- 2023-10-20 Rental Removed $1,000 APPFOLIO
- 2023-10-08 Listed for Rent $1,000 APPFOLIO
Property tax history
+2.0%/yrLatest (2026): $6,990 · +12.2% YoY. Source: county tax records.
Cash-flow waterfall
monthlySold comps — $/sqft
last 12 mo · ≤1 miLoading sold comps…