 Multi-family
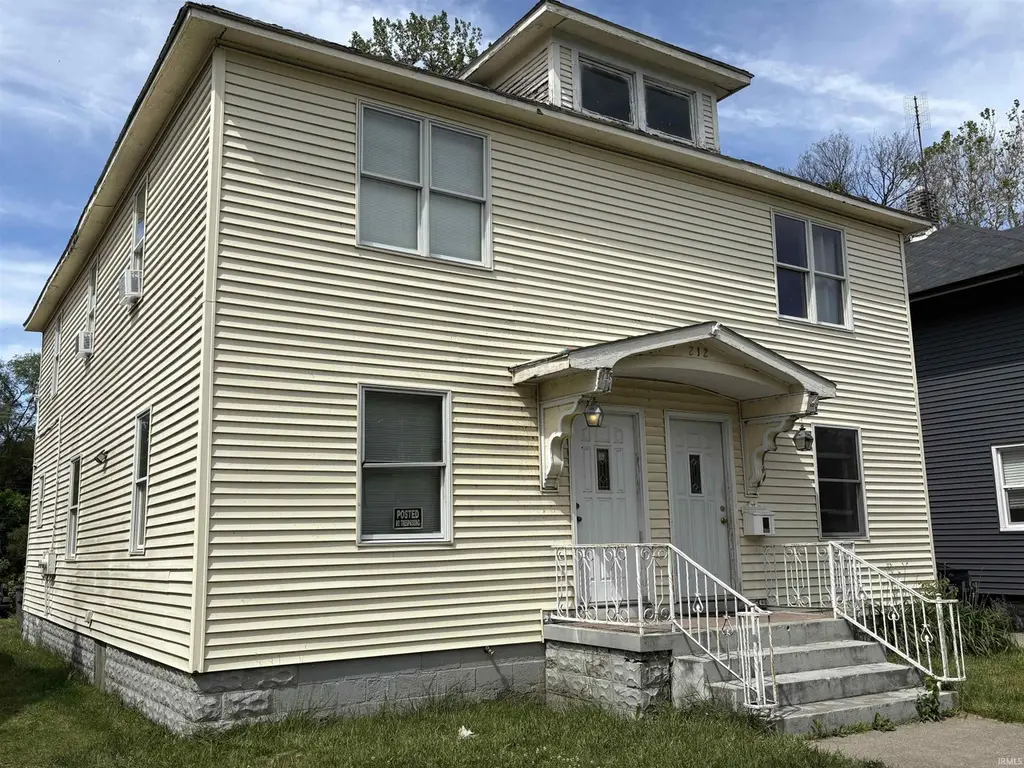
212 W Crawford St · Elkhart, IN
Flood risk 1/10 · Minimal
- FEMA flood zone
- X (unshaded)
- Chance of flooding over 30 yrs
- 0.0%
- Est. flood insurance / yr
- $473 – $860
Fire risk 1/10 · Minimal
- Est. fire insurance / yr
- $717 – $1,331
Heat risk 2/10 · Minimal
- Hot days now (above 101°F)
- 7 days/yr
- Hot days in 30 yrs
- 16 days/yr
Wind risk 2/10 · Minimal
- Chance of severe wind over 30 yrs
- —
Air-quality risk 3/10 · Minor
- Unhealthy air days now
- 2 days/yr
- Unhealthy air days in 30 yrs
- 3 days/yr
Risk factors via First Street. Map © Google.
Why this score? — see what drove the B+ grade
The composite is a weighted blend of 9 inputs, each scored 0–100. Each bar is that input's sub-score; the figure is the points it added to the 100-point composite (weight × sub-score).
- Cash flow +30.0/30.0
- ARV discount +15.0/15.0
- 1% rule +10.0/10.0
- DSCR +10.0/10.0
- Rent growth +4.3/5.0
- Livability +3.4/5.0
- Condition / age +2.5/5.0
- Schools +1.8/10.0
- Appreciation +0.0/10.0
$89,900
🖨 Deal sheet 📄 Offer letter ✓ Due diligence
Multi-family units
County records classify this as Multi-Family (2-4 Unit). Listing-text estimate: 1 unit. estimate disagrees with records
Listing remarks
This duplex is a perfect investment property! Needs some TLC, it was being used as a single family home. It could easily be turned back into a duplex. The address is set up for a duplex. Sold as is.
Key facts
- 6,839 sq ft lot
- 2 garage spots
- Built 1920
Property features AI
Exterior
- Parking: Detached 2-car garage
- Utilities: Public water; Public sewer
- Home design: Single-family residence; Site-built home; 2 stories
- Construction: Shingle siding; Vinyl siding; Brick/mortar foundation; Block foundation; Built as residential (site-built)
- Exterior features: Level lot; Shed(s)
Interior
- Kitchen: Electric range
- Bathrooms: 2 full bathrooms
- Heating & cooling: Forced air heating; Window-unit cooling
- Interior features: Unfinished basement; 1 fireplace
- Laundry & utility: Main-level laundry; Washer; Gas water heater; Water heater
Neighborhood map
What this means for you Summary
Snapshot
- This is a 3-bed/2.0-bath multifamily listed at $90k.
Deal economics
- At list price, monthly cash flow is $791 ($9k/yr) — positive.
- The deal already cash-flows at list — no discount required.
- Meets the 1% rule at list price ($2k rent vs $90k).
- Cap rate 16.9% vs local median 4.0% in Elkhart — top-decile yield for the area; either an underpriced asset or a hidden risk that comps aren't pricing in. Stress-test before assuming the spread holds.
Location & tenants
- Location reads 68/100 on livability (#224 in IN) — a middle-class / working-renter tenant base. Strengths: cost of living A+, housing A+, health & safety A+; Watch: amenities C-, crime F, commute F.
- Elkhart Community Schools (urban): math 18% / reading 25% proficiency, ranked #271 of 301 in IN (top 90%) — low school quality limits family demand, transient renter base, plan for 1-2y turnover.
- Zoned schools: Beardsley Elementary School (math 9% / reading 8%, grade F, #939 of 994 statewide, top 95%, 457 students, 73% FRL); North Side Middle School (math 15% / reading 31%, grade F, #263 of 330 statewide, top 80%, 627 students, 72% FRL); Elkhart High School (math 17% / reading 51%, grade F, #285 of 369 statewide, top 78%, 3,325 students, 63% FRL).
- Market conditions: Rents rising fast (+7.0%/yr); 269 active listings in the ZIP; 1 comparable units currently listed for rent nearby; 484 units permitted in Elkhart County in 2024 (136 in 5+ unit buildings).
- This rent runs 36% of the median local income ($66k/yr) — at the standard rent-burdened threshold; future hikes will face affordability resistance.
Forward outlook
- Local home prices are declining (-3.0%/yr); year-one equity from $622 of loan paydown is wiped out by about $3k of value loss. Plan a longer hold.
- Elkhart County population projected at +7% by 2050 — modest demand growth; plan on rents tracking national, not racing it.
- At projected returns (-3.0% appreciation + 7.0% rent growth), your $25k cash investment doubles in ~3 years — after that, you're playing with house money.
Negotiation context
- Only 2 days on market — expect competitive offers; lowballing is unlikely to land.
Risks & watch-outs
- Watch-outs: property tax is 3.5% of price; built in 1920 — expect roof / HVAC / electrical / plumbing capex.
Questions for the listing agent
- Built in 1920 — when were the roof, HVAC, electrical panel, plumbing, and water heater last replaced?
- Property tax is high relative to price — has the assessment been appealed recently, and will the sale trigger a re-assessment?
- Is there a deadline driving the sale (1031 exchange, divorce, estate, relocation)? That informs how much negotiation room exists.
- Schools are F-rated, which usually means shorter tenancies and higher turnover. Who's the typical renter profile here, and what's been the actual vacancy rate?
- Crime grade is F in this area — have there been break-ins, vandalism, or insurance claims at this property in the last 3 years? What carrier currently insures it and at what premium?
- What's the average days-on-market for RENTAL listings here right now (not sales)? A rising rental-DOM trend means longer vacancies and softer asking-rent achievability than the comps imply.
- What's the recent tenant-quality profile in this submarket — average credit score on applications, eviction rate, late-payment / NSF rate, and stable-employment percentage? A property-management company in the area should have these aggregated.
- How much new apartment / multifamily construction is in the pipeline within 1–3 miles? Heavy new supply (>2% of stock underway) typically softens rents 12–24 months out; light construction supports rent growth.
Investment metrics
- 1% rule
- 2.20% ✓
- Cap rate
- 16.85%
- Cash-on-cash
- 37.72%
- DSCR
- 2.68
- GRM
- 3.8
CMA / ARV
- ARV (on-the-fly)
- $110,700
- Comps found
- 1
Show comp detail 1 sale within ~0.75 mi
| Address | Dist | Beds/Ba | Sqft | Sold | Price | $/sf | Match |
|---|---|---|---|---|---|---|---|
| 207 N 2nd St | 0.45mi | 4/4.0 (+1) | 2,442 (-1%) | 4mo | $111,100 | $45 | 61 |
Match score weights: distance 35% · size 25% · config 20% · recency 20%. Top-matched comps best support the ARV.
Projected returns pro-forma
-3.0% appreciation · 7.03% rent growth · sell at horizon
- IRR
- 38.7%
- Equity multiple
- 2.76×
- Total profit
- $44,294
- Equity at exit
- $13,404
- IRR
- 47.3%
- Equity multiple
- 6.61×
- Total profit
- $141,171
- Equity at exit
- $7,773
Cash invested: $25,172 (down + closing). Projections, not guarantees.
Landlord ↔ Tenant lean methodology
- Overall (STATE)
- 90 Strongly Landlord-Friendly
- State Indiana
- 90 Strongly Landlord-Friendly · R+11
- County
- — inherits STATE
- City
- — inherits STATE
ZIP-level market 46514
- Rents YoY
- 7.0%
- Active inventory
- 269
- Price-to-rent
- 7.6×
Monthly cashflow live
- Estimated rent
- $1,978 high interval (Pro) →
- Mortgage (P&I)
- −$471
- Tax from tax record
- −$262 /mo · $3,150/yr
- Insurance
- −$37
- HOA
- −$0
- Vacancy / Maint / Mgmt
- −$415
- Net cashflow
- $791
Break-even live
2-unit breakdown (identical units grouped — click to expand)
| Units | Beds | Baths | Est. rent |
|---|---|---|---|
| 2× units | 1 | 1 | $1,978 |
| #1 | 1 | 1 | $989 |
| #2 | 1 | 1 | $989 |
| Total (2 units) | $1,978 | ||
UW: 25.0% down · 7.5% · 30yr · 1.5% tax · 5.0% vac · 8.0% maint · 8.0% mgmt
Financing live
Cash to close
- Down payment
- $22,475
- Closing costs
- $2,697
- Reserves months
- —
- Total cash needed
- —
Loan-product check · same deal, 3 products live
Conventional
25% down · 7.5% · 30yr
- Down + closing
- —
- Monthly P&I
- —
- Monthly cashflow
- —
- DSCR
- —
- Eligible?
- —
Personal DTI + credit; lowest rate.
DSCR
20% down · 8.5% · 30yr
- Down + closing
- —
- Monthly P&I
- —
- Monthly cashflow
- —
- DSCR
- —
- Eligible?
- —
No personal income docs; deal must DSCR.
Hard money
10% down · 12.0% · 12mo
- Down + closing
- —
- Monthly P&I
- —
- Monthly cashflow
- —
- DSCR
- —
- Eligible?
- —
Short-term bridge; refi at stabilization.
Rent comps 1 comps
| Address | Beds | Baths | Sqft | Rent | $/sqft | DOM | Units | Dist |
|---|---|---|---|---|---|---|---|---|
| 721 N Michigan St Elkhart, IN | 4.0 | 2.0 | 1952 | $2,499 | $1.28 | 21d | 1 | 0.41mi |
Listing history 4 events
-
2026-06-05status $89,900 Pending 2 DOM
-
2026-06-03days on market $89,900 Active 2 DOM
-
2026-06-01remarks 198-char remark
-
2026-06-01$89,900 Active 1 DOM
ⓘ Source: listings_history table (triggers on properties + properties_extension) + one-shot
backfill from property_details.listing_events for pre-trigger history.
Tax reassessment forecast IN · Partial reset (capped growth)
- Current annual tax
- $3,150 · $262/mo
- Projected year-2 tax
- $3,150 · $262/mo
- Expected delta
- $0/yr ($0/mo · 0.0%)
ⓘ Screening estimate from a state-policy table — verify with the county assessor before closing.
Climate risk First Street
- Flood 1/10 Low FEMA zone X (unshaded) · 0% chance over 30 yrs
- Wildfire 1/10 Low
- Heat 2/10 Low 7 d/yr ≥101°F today · 16 d/yr by 30 yrs out
- Wind 2/10 Low
- Air quality 3/10 Moderate 2 unhealthy d/yr today · 3 by 30 yrs out
Nearby sold comps map
Loading sold comps map…
Walkable amenities ~0.75 mi
Loading nearby amenities…
Taxation est. · year 1
- Rental income
- $23,736
- − Mortgage interest
- −$5,036
- − Property taxes
- −$3,150
- − Insurance
- −$450
- − Repairs & maintenance
- −$1,899
- − Management
- −$1,899
- − Depreciation
- −$2,615
- Taxable income
- $8,688
- Est. tax owed @ 24.0%
- −$2,085
- After-tax cash flow
- $7,410/yr
For passive investors: Depreciation is non-cash, so a rental often shows a tax loss while cash-flowing — sheltering income. Rental losses are passive: they offset passive income freely, and up to $25,000/yr can offset ordinary (W-2) income if you actively participate and your MAGI is under $100k (phasing out to $0 by $150k); unused losses carry forward. On sale, claimed depreciation is recaptured at up to 25%, and gains may owe capital-gains tax (a 1031 exchange can defer both). Figures are a year-1 estimate at your 24.0% rate — not tax advice; consult a CPA.
Schools (NCES district)
- District
- Elkhart Community Schools
- NCES district ID
- 1803270
- Math proficiency
- 18% ▼ -12.00%
- Reading proficiency
- 25% ▼ -9.00%
- Median HH income
- $42,881
- Composite
- 18.45/100
- National rank
- #8928
- State rank
- #271 of 301 in IN
Livability — Elkhart
- Score
- 68/100
- State rank
- #224
- US rank
- #9852
Category grades
Schools grade is shown separately in the Schools card above.
Census & demographics
- Census place
- Elkhart, IN
- County
- Elkhart County · 107,928 people
- City population
- 74,260
- Metro
- Elkhart-Goshen, IN
- Population (ZIP)
- 42,389
- Household income
- $65,833
- Rent vs Own
- Severe rent burden
- 1061.0
Population outlook (Elkhart County) Hauer SSP2
- Today (2025)
- 213,761 people
- By 2030
- 218,103 · +2.0%
- By 2040
- 225,381 · +5.4%
- By 2050
- 229,447 · +7.3%
- By 2075
- 232,856 · +8.9%
- By 2100
- 214,088 · +0.2%
Race, ethnicity, and origin ACS 2023
- Neighborhood character
- Predominantly White (74%)
- Race & ethnicity
- White 74% Hispanic / Latino 14% Two or more races 6% Black 5% Asian 1%
- Hispanic origin (detail)
- Mexican 10%
- Common ancestry
- Lithuanian 2% Romanian 2% Italian 2%
- Foreign-born
- 8% · Canada
- Languages at home
- 89% English-only · Spanish 10%
Political lean MEDSL · Elkhart
- 2024 margin
- Solid R (+32.4) · D 33.1% · R 65.5% · Other 1.4%
- 2008→2024 swing
- -21.2pp toward R · 2008: -11.2pp · 2024: -32.4pp
- All cycles
- 2024: R+32.4 2020: R+28.1 2016: R+32.4 2012: R+26.5 2008: R+11.2
Not yet ingested
- Civics
- —
Market trends
- HPI YoY
- ▼ -246.78%
- Current HPI
- 225.6
- Rent YoY
- ▲ 7.03%
- Metro
- Elkhart-Goshen, IN
- State GDP YoY
- ▲ 2.90%
- F500 in state
- 18
Industry mix (Fortune 500 HQ in IN)
| Industry | F500 HQs | Revenue |
|---|---|---|
| Industrial Machinery | 2 | $37B |
|
||
| Healthcare | 1 | $177B |
|
||
| Pharmaceuticals | 1 | $45B |
|
||
| Metals / Steel | 1 | $18B |
|
||
| Agriculture | 1 | $17B |
|
||
| Packaging | 1 | $12B |
|
||
Price history
1 event — show timeline
- 2026-06-01 Listed $89,900 IRMLS
Property tax history
-0.1%/yrLatest (2025): $3,150 · +8.9% YoY. Source: county tax records.
Cash-flow waterfall
monthlySold comps — $/sqft
last 12 mo · ≤1 miLoading sold comps…