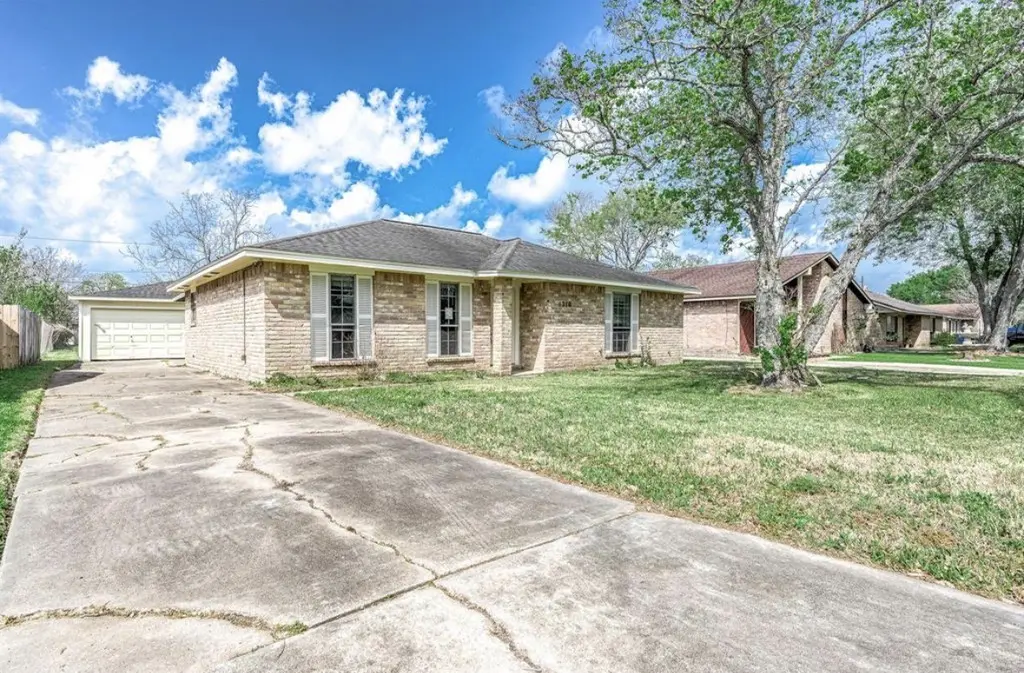
1310 Northbrook Dr · Angleton, TX
Flood risk 1/10 · Minimal
- FEMA flood zone
- X (unshaded)
- Chance of flooding over 30 yrs
- 0.0%
- Est. flood insurance / yr
- $507 – $1,088
Fire risk 5/10 · Moderate
- Est. fire insurance / yr
- $1,222 – $2,270
Heat risk 10/10 · Severe
- Hot days now (above 111°F)
- 7 days/yr
- Hot days in 30 yrs
- 26 days/yr
Wind risk 9/10 · Severe
- Chance of severe wind over 30 yrs
- 99.0%
Air-quality risk 2/10 · Minimal
- Unhealthy air days now
- 1 days/yr
- Unhealthy air days in 30 yrs
- 1 days/yr
Risk factors via First Street. Map © Google.
Why this score? — see what drove the D+ grade
The composite is a weighted blend of 9 inputs, each scored 0–100. Each bar is that input's sub-score; the figure is the points it added to the 100-point composite (weight × sub-score).
- Cash flow +14.0/30.0
- ARV discount +13.4/15.0
- 1% rule +4.4/10.0
- DSCR +4.3/10.0
- Livability +3.7/5.0
- Schools +3.5/10.0
- Rent growth +2.5/5.0
- Condition / age +2.5/5.0
- Appreciation +0.0/10.0
$194,000
🖨 Deal sheet (PDF) 📄 Offer letter ✓ Due diligence
Listing remarks MLS
Handyman Specials. New exterior paint. This is an amazing deal in the heart of City of Angleton.
Key facts
- Large backyard
- Oversized lot
- 9,600 sq ft lot
Tags
Property features AI
Exterior
- Parking: 2-car garage
- Utilities: Public water; Public sewer
- Home design: Residential property; Single-story entry (all bedrooms listed on first floor)
- Construction: Brick construction; Built in 1977; Slab foundation; Shingle and wood roof
- Exterior features: Lot described as 'Other'
Interior
- Bedrooms: Primary bedroom on the first floor (approx. 14 x 12); Bedroom on the first floor (approx. 12 x 12); Bedroom on the first floor (approx. 12 x 12)
- Bathrooms: 2 full bathrooms
- Heating & cooling: Central heating (gas); Central electric air conditioning
- Interior features: 3 total rooms
Neighborhood map
What this means for you Summary
Snapshot
- This is a 3-bed/2.0-bath single-family listed at $194k.
Deal economics
- At list price, monthly cash flow is $26 ($316/yr) — positive.
- The deal already cash-flows at list — no discount required.
- To meet the 1% rule (rent ≥ 1% of price), the offer needs to be $182k (6.4% below list).
- Recommended offer: $182k (6.4% below list) — sets the bar for 1% rule.
- Cap rate 6.5% vs local median 4.0% in Angleton — top-decile yield for the area; either an underpriced asset or a hidden risk that comps aren't pricing in. Stress-test before assuming the spread holds.
Location & tenants
- Location reads 74/100 on livability (#171 in TX, #4,520 nationally) — a middle-class / working-renter tenant base. Strengths: cost of living A+, housing A+, employment A-; Watch: amenities F, commute F.
- Angleton ISD (suburban): math 36% / reading 44% proficiency, ranked #375 of 826 in TX (top 45%) — families likely to look elsewhere, expect single-tenant / working-renter base with shorter leases.
- Zoned schools: Northside El (math 47% / reading 52%, grade D, #865 of 4,322 statewide, top 21%, 497 students, 67% FRL); Angleton J H School (math 26% / reading 41%, grade F, #911 of 1,662 statewide, top 56%, 1,561 students, 68% FRL); Angleton H S (math 22% / reading 45%, grade F, #1,011 of 1,632 statewide, top 63%, 2,066 students, 67% FRL).
- Market conditions: 932 active listings in the ZIP; 9 comparable units currently listed for rent nearby; rentals at typical pace (median 26d on market — plan ~3-4 weeks tenant-placement turnaround); 44% of comp listings sitting > 30 days — soft ceiling on asking rent; solid renter incomes; 3,960 units permitted in Brazoria County in 2024 (593 in 5+ unit buildings).
Forward outlook
- Local home prices are declining (-3.0%/yr); year-one equity from $1k of loan paydown is wiped out by about $6k of value loss. Plan a longer hold.
- Brazoria County population projected at +44% by 2050 — long-run rental-demand tailwind backs the buy-and-hold thesis.
Negotiation context
- It's been on market 29 days — a 2% lower offer ($191k) is reasonable based on typical stale-listing flexibility.
- 5 sale attempts since 3y ago with the ask held roughly flat each time — persistent listings suggest the price (not the market) is what's stuck; bring a comps-based counter.
Risks & watch-outs
- Climate carrying-cost: severe wind risk, 99% chance of damaging wind over 30y; moderate wildfire risk; extreme-heat days projected 7→26/yr by 2055 (HVAC capex compounding) — expect insurance premiums to compound above CPI over the hold.
Questions for the listing agent
- Built in 1977 — when were the roof, HVAC, electrical panel, plumbing, and water heater last replaced?
- Is there a deadline driving the sale (1031 exchange, divorce, estate, relocation)? That informs how much negotiation room exists.
- Schools are D-rated, which usually means shorter tenancies and higher turnover. Who's the typical renter profile here, and what's been the actual vacancy rate?
- The area grade is low — what's the realistic commute time and amenity access for the typical tenant pool here? Any planned neighborhood developments (good or bad) we should know about?
- What's the average days-on-market for RENTAL listings here right now (not sales)? A rising rental-DOM trend means longer vacancies and softer asking-rent achievability than the comps imply.
- What's the recent tenant-quality profile in this submarket — average credit score on applications, eviction rate, late-payment / NSF rate, and stable-employment percentage? A property-management company in the area should have these aggregated.
- How much new for-sale + rental construction is in the pipeline within 1–3 miles? Heavy new supply typically softens prices + rents 12–24 months out; constrained supply supports both.
Investment metrics
- 1% rule
- 0.94% ✗
- Cap rate
- 6.46%
- Cash-on-cash
- 0.58%
- DSCR
- 1.03
- GRM
- 8.9
CMA / ARV
- ARV (median comp)
- $223,365
- List price
- $194,000
- Delta
- -13.15%
- Verdict
- UNDERPRICED
- Comps
- 20 within 1.0 mi
Show comp detail 12 sales within ~0.75 mi
| Address | Dist | Beds/Ba | Sqft | Sold | Price | $/sf | Match |
|---|---|---|---|---|---|---|---|
| 1226 Valley Dr | 0.15mi | 3/2.0 | 1,281 (0%) | 2mo | $149,900 | $117 | 91 |
| 224 Amy St | 0.26mi | 3/2.0 | 1,302 (+2%) | 3mo | $255,990 | $197 | 82 |
| 1405 Northview Dr | 0.12mi | 3/2.0 | 1,172 (-8%) | 3mo | $125,400 | $107 | 78 |
| 213 Bastrop St | 0.51mi | 3/2.0 | 1,281 (0%) | 1mo | $189,000 | $148 | 76 |
| 205 Bastrop St | 0.49mi | 3/2.0 | 1,281 (0%) | 2mo | $185,000 | $144 | 75 |
| 11 Robin Ct | 0.14mi | 3/2.0 | 1,409 (+10%) | 5mo | $255,630 | $181 | 73 |
| 229 Austin St | 0.58mi | 3/2.0 | 1,250 (-2%) | 2mo | $195,000 | $156 | 67 |
| 142 Kelly St | 0.42mi | 3/2.0 | 1,388 (+8%) | 2mo | $224,900 | $162 | 65 |
| 1305 Sagebrush St | 0.63mi | 3/2.0 | 1,322 (+3%) | 2mo | $209,000 | $158 | 64 |
| 249 Austin St | 0.63mi | 3/2.0 | 1,250 (-2%) | 4mo | $150,000 | $120 | 64 |
| 1321 Sagebrush St | 0.61mi | 2/2.0 (-1) | 1,362 (+6%) | 3mo | $129,000 | $95 | 54 |
| 1021 Wimberly St | 0.54mi | 4/1.0 (+1) | 1,172 (-8%) | 4mo | $179,000 | $153 | 48 |
Match score weights: distance 35% · size 25% · config 20% · recency 20%. Top-matched comps best support the ARV.
Projected returns pro-forma
-3.0% appreciation · 3.0% rent growth · sell at horizon
- IRR
- -15.3%
- Equity multiple
- 0.45×
- Total profit
- $-29,691
- Equity at exit
- $28,926
- IRR
- -6.7%
- Equity multiple
- 0.57×
- Total profit
- $-23,414
- Equity at exit
- $16,774
Cash invested: $54,320 (down + closing). Projections, not guarantees.
Landlord ↔ Tenant lean methodology
- Overall (STATE)
- 87 Strongly Landlord-Friendly
- State Texas
- 87 Strongly Landlord-Friendly · R+5
- County
- — inherits STATE
- City
- — inherits STATE
ZIP-level market 77515
- Home prices YoY
- -5.1%
- Active inventory
- 932
- Price-to-rent
- 8.9×
Monthly cashflow live
- Estimated rent
- $1,817 high interval (Pro) →
- Mortgage (P&I)
- −$1,017
- Tax from tax record
- −$311 /mo · $3,729/yr
- Insurance
- −$81
- HOA
- −$0
- Vacancy / Maint / Mgmt
- −$382
- Net cashflow
- $26
Break-even live
Sensitivity live
| Price | -10% $136 | -5% $81 | +0% $26 | +5% $-29 | +10% $-84 |
|---|---|---|---|---|---|
| Rent | -10% $-117 | -5% $-45 | +0% $26 | +5% $98 | +10% $170 |
| Rate | -1.0pp $124 | -0.5pp $76 | base $26 | +0.5pp $-24 | +1.0pp $-75 |
UW: 25.0% down · 7.5% · 30yr · 1.5% tax · 5.0% vac · 8.0% maint · 8.0% mgmt
Financing live
Cash to close
- Down payment
- $48,500
- Closing costs
- $5,820
- Reserves months
- —
- Total cash needed
- —
Loan-product check · same deal, 3 products live
Conventional
25% down · 7.5% · 30yr
- Down + closing
- —
- Monthly P&I
- —
- Monthly cashflow
- —
- DSCR
- —
- Eligible?
- —
Personal DTI + credit; lowest rate.
DSCR
20% down · 8.5% · 30yr
- Down + closing
- —
- Monthly P&I
- —
- Monthly cashflow
- —
- DSCR
- —
- Eligible?
- —
No personal income docs; deal must DSCR.
Hard money
10% down · 12.0% · 12mo
- Down + closing
- —
- Monthly P&I
- —
- Monthly cashflow
- —
- DSCR
- —
- Eligible?
- —
Short-term bridge; refi at stabilization.
Rent comps 9 comps
| Address | Beds | Baths | Sqft | Rent | $/sqft | DOM | Units | Dist |
|---|---|---|---|---|---|---|---|---|
| 1405 Northview Dr Angleton, TX | 3.0 | 2.0 | 1172 | $2,225 | $1.90 | 4d | 1 | 0.13mi |
| 1300 Buchta Rd Angleton, TX | 1.0–3.0 | 1.0–2.0 | 773 | $1,113 | $1.44 | 0d | 13 | 0.29mi |
| 1300 Buchta Rd Angleton, TX | 1.0–3.0 | 1.0–2.0 | 773 | $1,085 | $1.40 | 26d | 8 | 0.29mi |
| 128 Dallas St Angleton, TX | 3.0 | 2.0 | 1390 | $1,900 | $1.37 | 45d | 1 | 0.31mi |
| 3 Dallas Ct #1 Angleton, TX | 3.0 | 3.0 | 1550 | $1,450 | $0.94 | 45d | 1 | 0.36mi |
| 152 Bastrop St Angleton, TX | 3.0 | 2.0 | 1639 | $1,745 | $1.06 | 45d | 1 | 0.46mi |
| 1400 E Henderson Rd Angleton, TX | 1.0–2.0 | 1.0–2.0 | 752 | $999 | $1.33 | 0d | 1 | 0.65mi |
| 301 Cannan Dr Angleton, TX | 1.0–2.0 | 1.0–2.0 | 801 | $1,192 | $1.49 | 0d | 10 | 1.07mi |
| 307 Cannan Dr Angleton, TX | 2.0 | 2.0 | 936 | $1,100 | $1.18 | 45d | 1 | 1.17mi |
Listing history 24 events
-
2026-06-07days on market $194,000 Pending 29 DOM
-
2026-06-04days on market $194,000 Pending 28 DOM
-
2026-06-03days on market $194,000 Pending 27 DOM
-
2026-06-02days on market $194,000 Pending 26 DOM
-
2026-06-01days on market $194,000 Pending 25 DOM
-
2026-05-31days on market $194,000 Pending 24 DOM
-
2026-05-07$194,000 Active 790-char remark
-
2024-11-20historical
-
2024-11-14price $180,000
-
2024-11-14status Active
-
2024-11-08status Option Pending
-
2024-10-31price $199,000
-
2024-10-17status Active
-
2024-08-27status Pending
-
2024-08-21status Option Pending
-
2024-08-07price $205,000
-
2024-07-22price $210,000
-
2024-07-15price $225,000
-
2024-06-22$230,000 Active
-
2023-05-01soldstatus
-
2023-04-28soldstatus Sold
Show marketing remark (96 chars)
Handyman Specials. New exterior paint. This is an amazing deal in the heart of City of Angleton.
-
2023-04-07$124,900 Active
Show marketing remark (96 chars)
Handyman Specials. New exterior paint. This is an amazing deal in the heart of City of Angleton.
-
2021-10-06soldstatus
-
2004-01-23soldstatus
ⓘ Source: listings_history table (triggers on properties + properties_extension) + one-shot
backfill from property_details.listing_events for pre-trigger history.
Tax reassessment forecast TX · Resets to sale price
- Current annual tax
- $3,729 · $311/mo
- Projected year-2 tax
- $3,729 · $311/mo
- Expected delta
- $0/yr ($0/mo · -0.0%)
ⓘ Screening estimate from a state-policy table — verify with the county assessor before closing.
Climate risk First Street
- Flood 1/10 Low FEMA zone X (unshaded) · 0% chance over 30 yrs
- Wildfire 5/10 Major
- Heat 10/10 Extreme 7 d/yr ≥111°F today · 26 d/yr by 30 yrs out
- Wind 9/10 Extreme 99% chance of damaging wind over 30 yrs
- Air quality 2/10 Low 1 unhealthy d/yr today · 1 by 30 yrs out
Nearby sold comps map
Loading sold comps map…
Walkable amenities ~0.75 mi
Loading nearby amenities…
Taxation est. · year 1
- Rental income
- $21,801
- − Mortgage interest
- −$10,867
- − Property taxes
- −$3,729
- − Insurance
- −$970
- − Repairs & maintenance
- −$1,744
- − Management
- −$1,744
- − Depreciation
- −$5,644
- Taxable loss
- −$2,896
- Est. tax savings @ 24.0%
- +$695
- After-tax cash flow
- $1,011/yr
For passive investors: Depreciation is non-cash, so a rental often shows a tax loss while cash-flowing — sheltering income. Rental losses are passive: they offset passive income freely, and up to $25,000/yr can offset ordinary (W-2) income if you actively participate and your MAGI is under $100k (phasing out to $0 by $150k); unused losses carry forward. On sale, claimed depreciation is recaptured at up to 25%, and gains may owe capital-gains tax (a 1031 exchange can defer both). Figures are a year-1 estimate at your 24.0% rate — not tax advice; consult a CPA.
Schools (NCES district)
- District
- Angleton ISD
- NCES district ID
- 4808310
- Math proficiency
- 36% ▼ -8.00%
- Reading proficiency
- 44% ▲ 1.00%
- Median HH income
- $55,670
- Composite
- 35.01/100
- National rank
- #5046
- State rank
- #375 of 826 in TX
Livability — Angleton
- Score
- 74/100
- State rank
- #171
- US rank
- #4520
Category grades
Schools grade is shown separately in the Schools card above.
Census & demographics
- Census place
- Angleton, TX
- County
- Brazoria County · 374,982 people
- City population
- 34,088
- Metro
- Houston-The Woodlands-Sugar Land, TX
- Population (ZIP)
- 34,088
- Household income
- $88,787
- Rent vs Own
- Severe rent burden
- 785.0
Population outlook (Brazoria County) Hauer SSP2
- Today (2025)
- 420,414 people
- By 2030
- 457,585 · +8.8%
- By 2040
- 532,232 · +26.6%
- By 2050
- 605,399 · +44.0%
- By 2075
- 779,358 · +85.4%
- By 2100
- 883,759 · +110.2%
Race, ethnicity, and origin ACS 2023
- Neighborhood character
- Diverse neighborhood (Simpson 0.58)
- Race & ethnicity
- White 55% Hispanic / Latino 33% Two or more races 18% Black 8% Asian 2%
- Hispanic origin (detail)
- Mexican 28%
- Common ancestry
- Lithuanian 3% Romanian 2% Slovak 1%
- Foreign-born
- 8% · Canada, Vietnam
- Languages at home
- 78% English-only · Spanish 20% Other Asian/Pacific 1%
Political lean MEDSL · Brazoria
- 2024 margin
- R (+19.7) · D 39.5% · R 59.2% · Other 1.3%
- 2008→2024 swing
- +9.9pp toward D · 2008: -29.6pp · 2024: -19.7pp
- All cycles
- 2024: R+19.7 2020: R+18.2 2016: R+24.6 2012: R+34.2 2008: R+29.6
Not yet ingested
- Civics
- —
Market trends
- HPI YoY
- ▼ -15.59%
- Current HPI
- 288.7286
- Rent YoY
- —
- Metro
- Houston-The Woodlands-Sugar Land, TX
- State GDP YoY
- ▲ 3.95%
- F500 in state
- 110
Industry mix (Fortune 500 HQ in TX)
| Industry | F500 HQs | Revenue |
|---|---|---|
| Energy | 16 | $1,198B |
|
||
| Technology | 5 | $198B |
|
||
| Engineering / Construction | 4 | $72B |
|
||
| Energy Services | 3 | $60B |
|
||
| Utilities | 3 | $41B |
|
||
| Healthcare | 2 | $330B |
|
||
Price history
+55.3% since first listed20 events — show timeline
- 2026-06-06 Pending — HARMLS
- 2026-05-29 Pending — HARMLS
- 2026-05-07 Listed $194,000 HARMLS
- 2024-11-20 Listing Removed — HARMLS
- 2024-11-14 Price Changed $180,000 HARMLS
- 2024-11-14 Relisted — HARMLS
- 2024-11-08 Pending — HARMLS
- 2024-10-31 Price Changed $199,000 HARMLS
- 2024-10-17 Relisted — HARMLS
- 2024-08-27 Pending — HARMLS
- 2024-08-21 Pending — HARMLS
- 2024-08-07 Price Changed $205,000 HARMLS
- 2024-07-22 Price Changed $210,000 HARMLS
- 2024-07-15 Price Changed $225,000 HARMLS
- 2024-06-22 Listed $230,000 HARMLS
- 2023-05-01 Sold (Public Records) — Public Records
- 2023-04-28 Sold (MLS) — HARMLS
- 2023-04-07 Listed $124,900 HARMLS
- 2021-10-06 Sold (Public Records) — Public Records
- 2004-01-23 Sold (Public Records) — Public Records
Property tax history
+2.7%/yrLatest (2025): $3,729 · -1.6% YoY. Source: county tax records.
Cash-flow waterfall
monthlySold comps — $/sqft
last 12 mo · ≤1 miLoading sold comps…